Free Statistics

of Irreproducible Research!

Author's title

Author*Unverified author*
R Software Modulerwasp_autocorrelation.wasp
Title produced by software(Partial) Autocorrelation Function
Date of computationMon, 28 Mar 2011 18:53:36 +0000
Cite this page as followsStatistical Computations at FreeStatistics.org, Office for Research Development and Education, URL https://freestatistics.org/blog/index.php?v=date/2011/Mar/28/t13013382303ceayb9ydm1vubi.htm/, Retrieved Sun, 12 May 2024 13:10:14 +0000
Statistical Computations at FreeStatistics.org, Office for Research Development and Education, URL https://freestatistics.org/blog/index.php?pk=119788, Retrieved Sun, 12 May 2024 13:10:14 +0000
QR Codes:

Original text written by user:
IsPrivate?No (this computation is public)
User-defined keywordsKDGP2W12
Estimated Impact257
Family? (F = Feedback message, R = changed R code, M = changed R Module, P = changed Parameters, D = changed Data)
-       [(Partial) Autocorrelation Function] [Alexander De Raey...] [2011-03-28 18:53:36] [67591050a6cb6cfbed77a59a4d2c72eb] [Current]
Feedback Forum

Post a new message
Dataseries X:
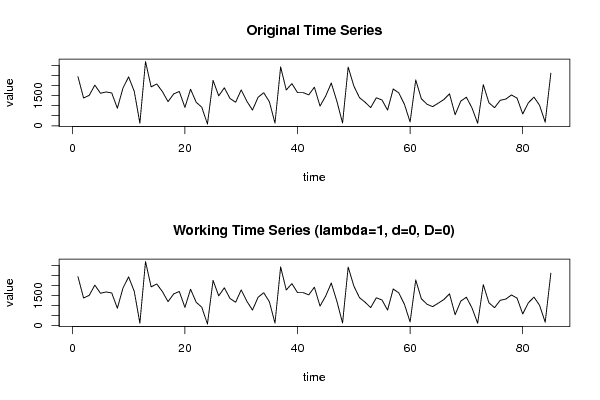
2435
1379
1511
2021
1614
1680
1630
870
1877
2428
1711
127
3192
1934
2075
1700
1198
1582
1705
911
1817
1168
920
84
2254
1485
1886
1358
1167
1781
1218
779
1418
1641
1196
132
2926
1777
2094
1648
1646
1537
1917
977
1475
2124
1209
135
2917
1981
1398
1171
903
1390
1280
781
1828
1631
1063
186
2275
1342
1070
950
1121
1305
1586
548
1225
1419
880
124
2044
1143
897
1264
1326
1529
1373
587
1137
1426
1016
176
2614


Summary of computational transaction
Raw Inputview raw input (R code)
Raw Outputview raw output of R engine
Computing time1 seconds
R Server'Herman Ole Andreas Wold' @ www.yougetit.org

\begin{tabular}{lllllllll}
\hline
Summary of computational transaction \tabularnewline
Raw Input & view raw input (R code)  \tabularnewline
Raw Output & view raw output of R engine  \tabularnewline
Computing time & 1 seconds \tabularnewline
R Server & 'Herman Ole Andreas Wold' @ www.yougetit.org \tabularnewline
\hline
\end{tabular}
%Source: https://freestatistics.org/blog/index.php?pk=119788&T=0

[TABLE]
[ROW][C]Summary of computational transaction[/C][/ROW]
[ROW][C]Raw Input[/C][C]view raw input (R code) [/C][/ROW]
[ROW][C]Raw Output[/C][C]view raw output of R engine [/C][/ROW]
[ROW][C]Computing time[/C][C]1 seconds[/C][/ROW]
[ROW][C]R Server[/C][C]'Herman Ole Andreas Wold' @ www.yougetit.org[/C][/ROW]
[/TABLE]
Source: https://freestatistics.org/blog/index.php?pk=119788&T=0

Globally Unique Identifier (entire table): ba.freestatistics.org/blog/index.php?pk=119788&T=0

As an alternative you can also use a QR Code:  

The GUIDs for individual cells are displayed in the table below:

Summary of computational transaction
Raw Inputview raw input (R code)
Raw Outputview raw output of R engine
Computing time1 seconds
R Server'Herman Ole Andreas Wold' @ www.yougetit.org


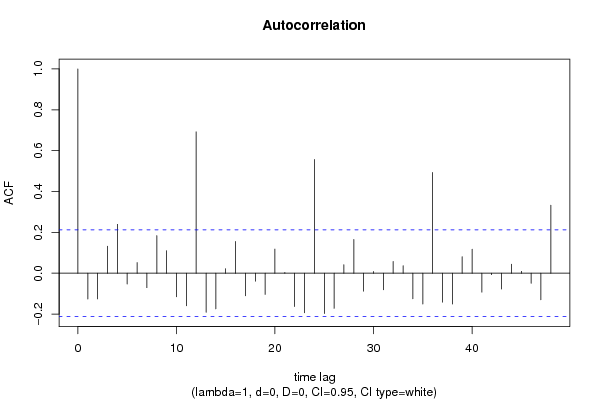
Autocorrelation Function
Time lag kACF(k)T-STATP-value
1-0.125989-1.16160.124333
2-0.125771-1.15950.12474
30.1323111.21980.112948
40.2391282.20460.01509
5-0.053157-0.49010.312668
60.0520320.47970.316332
7-0.07058-0.65070.258492
80.1839331.69580.046794
90.1104631.01840.155685
10-0.115-1.06030.146017
11-0.158898-1.4650.073309
120.6920526.38040
13-0.191467-1.76520.040557
14-0.174412-1.6080.055772
150.02190.20190.420234
160.15511.42990.078199
17-0.11029-1.01680.156062
18-0.038658-0.35640.361207
19-0.103484-0.95410.171374
200.1179961.08790.139863
210.0035280.03250.487066
22-0.163332-1.50590.067906
23-0.193348-1.78260.039113
240.5564935.13061e-06
25-0.197171-1.81780.036307
26-0.171956-1.58540.0583
270.0415290.38290.351381
280.1649851.52110.065974
29-0.087827-0.80970.21018
300.0081590.07520.470108
31-0.080584-0.74290.22978
320.057380.5290.299085
330.036970.34080.367031
34-0.125136-1.15370.125929
35-0.150881-1.3910.08392
360.4927484.54299e-06
37-0.141703-1.30640.097465
38-0.150773-1.39010.08407
390.0805020.74220.230007
400.1170671.07930.141753
41-0.092481-0.85260.19813
42-0.006933-0.06390.474592
43-0.077042-0.71030.239734
440.0442630.40810.342119
450.0091290.08420.466561
46-0.048741-0.44940.327155
47-0.130233-1.20070.116603
480.3330193.07030.001436

\begin{tabular}{lllllllll}
\hline
Autocorrelation Function \tabularnewline
Time lag k & ACF(k) & T-STAT & P-value \tabularnewline
1 & -0.125989 & -1.1616 & 0.124333 \tabularnewline
2 & -0.125771 & -1.1595 & 0.12474 \tabularnewline
3 & 0.132311 & 1.2198 & 0.112948 \tabularnewline
4 & 0.239128 & 2.2046 & 0.01509 \tabularnewline
5 & -0.053157 & -0.4901 & 0.312668 \tabularnewline
6 & 0.052032 & 0.4797 & 0.316332 \tabularnewline
7 & -0.07058 & -0.6507 & 0.258492 \tabularnewline
8 & 0.183933 & 1.6958 & 0.046794 \tabularnewline
9 & 0.110463 & 1.0184 & 0.155685 \tabularnewline
10 & -0.115 & -1.0603 & 0.146017 \tabularnewline
11 & -0.158898 & -1.465 & 0.073309 \tabularnewline
12 & 0.692052 & 6.3804 & 0 \tabularnewline
13 & -0.191467 & -1.7652 & 0.040557 \tabularnewline
14 & -0.174412 & -1.608 & 0.055772 \tabularnewline
15 & 0.0219 & 0.2019 & 0.420234 \tabularnewline
16 & 0.1551 & 1.4299 & 0.078199 \tabularnewline
17 & -0.11029 & -1.0168 & 0.156062 \tabularnewline
18 & -0.038658 & -0.3564 & 0.361207 \tabularnewline
19 & -0.103484 & -0.9541 & 0.171374 \tabularnewline
20 & 0.117996 & 1.0879 & 0.139863 \tabularnewline
21 & 0.003528 & 0.0325 & 0.487066 \tabularnewline
22 & -0.163332 & -1.5059 & 0.067906 \tabularnewline
23 & -0.193348 & -1.7826 & 0.039113 \tabularnewline
24 & 0.556493 & 5.1306 & 1e-06 \tabularnewline
25 & -0.197171 & -1.8178 & 0.036307 \tabularnewline
26 & -0.171956 & -1.5854 & 0.0583 \tabularnewline
27 & 0.041529 & 0.3829 & 0.351381 \tabularnewline
28 & 0.164985 & 1.5211 & 0.065974 \tabularnewline
29 & -0.087827 & -0.8097 & 0.21018 \tabularnewline
30 & 0.008159 & 0.0752 & 0.470108 \tabularnewline
31 & -0.080584 & -0.7429 & 0.22978 \tabularnewline
32 & 0.05738 & 0.529 & 0.299085 \tabularnewline
33 & 0.03697 & 0.3408 & 0.367031 \tabularnewline
34 & -0.125136 & -1.1537 & 0.125929 \tabularnewline
35 & -0.150881 & -1.391 & 0.08392 \tabularnewline
36 & 0.492748 & 4.5429 & 9e-06 \tabularnewline
37 & -0.141703 & -1.3064 & 0.097465 \tabularnewline
38 & -0.150773 & -1.3901 & 0.08407 \tabularnewline
39 & 0.080502 & 0.7422 & 0.230007 \tabularnewline
40 & 0.117067 & 1.0793 & 0.141753 \tabularnewline
41 & -0.092481 & -0.8526 & 0.19813 \tabularnewline
42 & -0.006933 & -0.0639 & 0.474592 \tabularnewline
43 & -0.077042 & -0.7103 & 0.239734 \tabularnewline
44 & 0.044263 & 0.4081 & 0.342119 \tabularnewline
45 & 0.009129 & 0.0842 & 0.466561 \tabularnewline
46 & -0.048741 & -0.4494 & 0.327155 \tabularnewline
47 & -0.130233 & -1.2007 & 0.116603 \tabularnewline
48 & 0.333019 & 3.0703 & 0.001436 \tabularnewline
\hline
\end{tabular}
%Source: https://freestatistics.org/blog/index.php?pk=119788&T=1

[TABLE]
[ROW][C]Autocorrelation Function[/C][/ROW]
[ROW][C]Time lag k[/C][C]ACF(k)[/C][C]T-STAT[/C][C]P-value[/C][/ROW]
[ROW][C]1[/C][C]-0.125989[/C][C]-1.1616[/C][C]0.124333[/C][/ROW]
[ROW][C]2[/C][C]-0.125771[/C][C]-1.1595[/C][C]0.12474[/C][/ROW]
[ROW][C]3[/C][C]0.132311[/C][C]1.2198[/C][C]0.112948[/C][/ROW]
[ROW][C]4[/C][C]0.239128[/C][C]2.2046[/C][C]0.01509[/C][/ROW]
[ROW][C]5[/C][C]-0.053157[/C][C]-0.4901[/C][C]0.312668[/C][/ROW]
[ROW][C]6[/C][C]0.052032[/C][C]0.4797[/C][C]0.316332[/C][/ROW]
[ROW][C]7[/C][C]-0.07058[/C][C]-0.6507[/C][C]0.258492[/C][/ROW]
[ROW][C]8[/C][C]0.183933[/C][C]1.6958[/C][C]0.046794[/C][/ROW]
[ROW][C]9[/C][C]0.110463[/C][C]1.0184[/C][C]0.155685[/C][/ROW]
[ROW][C]10[/C][C]-0.115[/C][C]-1.0603[/C][C]0.146017[/C][/ROW]
[ROW][C]11[/C][C]-0.158898[/C][C]-1.465[/C][C]0.073309[/C][/ROW]
[ROW][C]12[/C][C]0.692052[/C][C]6.3804[/C][C]0[/C][/ROW]
[ROW][C]13[/C][C]-0.191467[/C][C]-1.7652[/C][C]0.040557[/C][/ROW]
[ROW][C]14[/C][C]-0.174412[/C][C]-1.608[/C][C]0.055772[/C][/ROW]
[ROW][C]15[/C][C]0.0219[/C][C]0.2019[/C][C]0.420234[/C][/ROW]
[ROW][C]16[/C][C]0.1551[/C][C]1.4299[/C][C]0.078199[/C][/ROW]
[ROW][C]17[/C][C]-0.11029[/C][C]-1.0168[/C][C]0.156062[/C][/ROW]
[ROW][C]18[/C][C]-0.038658[/C][C]-0.3564[/C][C]0.361207[/C][/ROW]
[ROW][C]19[/C][C]-0.103484[/C][C]-0.9541[/C][C]0.171374[/C][/ROW]
[ROW][C]20[/C][C]0.117996[/C][C]1.0879[/C][C]0.139863[/C][/ROW]
[ROW][C]21[/C][C]0.003528[/C][C]0.0325[/C][C]0.487066[/C][/ROW]
[ROW][C]22[/C][C]-0.163332[/C][C]-1.5059[/C][C]0.067906[/C][/ROW]
[ROW][C]23[/C][C]-0.193348[/C][C]-1.7826[/C][C]0.039113[/C][/ROW]
[ROW][C]24[/C][C]0.556493[/C][C]5.1306[/C][C]1e-06[/C][/ROW]
[ROW][C]25[/C][C]-0.197171[/C][C]-1.8178[/C][C]0.036307[/C][/ROW]
[ROW][C]26[/C][C]-0.171956[/C][C]-1.5854[/C][C]0.0583[/C][/ROW]
[ROW][C]27[/C][C]0.041529[/C][C]0.3829[/C][C]0.351381[/C][/ROW]
[ROW][C]28[/C][C]0.164985[/C][C]1.5211[/C][C]0.065974[/C][/ROW]
[ROW][C]29[/C][C]-0.087827[/C][C]-0.8097[/C][C]0.21018[/C][/ROW]
[ROW][C]30[/C][C]0.008159[/C][C]0.0752[/C][C]0.470108[/C][/ROW]
[ROW][C]31[/C][C]-0.080584[/C][C]-0.7429[/C][C]0.22978[/C][/ROW]
[ROW][C]32[/C][C]0.05738[/C][C]0.529[/C][C]0.299085[/C][/ROW]
[ROW][C]33[/C][C]0.03697[/C][C]0.3408[/C][C]0.367031[/C][/ROW]
[ROW][C]34[/C][C]-0.125136[/C][C]-1.1537[/C][C]0.125929[/C][/ROW]
[ROW][C]35[/C][C]-0.150881[/C][C]-1.391[/C][C]0.08392[/C][/ROW]
[ROW][C]36[/C][C]0.492748[/C][C]4.5429[/C][C]9e-06[/C][/ROW]
[ROW][C]37[/C][C]-0.141703[/C][C]-1.3064[/C][C]0.097465[/C][/ROW]
[ROW][C]38[/C][C]-0.150773[/C][C]-1.3901[/C][C]0.08407[/C][/ROW]
[ROW][C]39[/C][C]0.080502[/C][C]0.7422[/C][C]0.230007[/C][/ROW]
[ROW][C]40[/C][C]0.117067[/C][C]1.0793[/C][C]0.141753[/C][/ROW]
[ROW][C]41[/C][C]-0.092481[/C][C]-0.8526[/C][C]0.19813[/C][/ROW]
[ROW][C]42[/C][C]-0.006933[/C][C]-0.0639[/C][C]0.474592[/C][/ROW]
[ROW][C]43[/C][C]-0.077042[/C][C]-0.7103[/C][C]0.239734[/C][/ROW]
[ROW][C]44[/C][C]0.044263[/C][C]0.4081[/C][C]0.342119[/C][/ROW]
[ROW][C]45[/C][C]0.009129[/C][C]0.0842[/C][C]0.466561[/C][/ROW]
[ROW][C]46[/C][C]-0.048741[/C][C]-0.4494[/C][C]0.327155[/C][/ROW]
[ROW][C]47[/C][C]-0.130233[/C][C]-1.2007[/C][C]0.116603[/C][/ROW]
[ROW][C]48[/C][C]0.333019[/C][C]3.0703[/C][C]0.001436[/C][/ROW]
[/TABLE]
Source: https://freestatistics.org/blog/index.php?pk=119788&T=1

Globally Unique Identifier (entire table): ba.freestatistics.org/blog/index.php?pk=119788&T=1

As an alternative you can also use a QR Code:  

The GUIDs for individual cells are displayed in the table below:

Autocorrelation Function
Time lag kACF(k)T-STATP-value
1-0.125989-1.16160.124333
2-0.125771-1.15950.12474
30.1323111.21980.112948
40.2391282.20460.01509
5-0.053157-0.49010.312668
60.0520320.47970.316332
7-0.07058-0.65070.258492
80.1839331.69580.046794
90.1104631.01840.155685
10-0.115-1.06030.146017
11-0.158898-1.4650.073309
120.6920526.38040
13-0.191467-1.76520.040557
14-0.174412-1.6080.055772
150.02190.20190.420234
160.15511.42990.078199
17-0.11029-1.01680.156062
18-0.038658-0.35640.361207
19-0.103484-0.95410.171374
200.1179961.08790.139863
210.0035280.03250.487066
22-0.163332-1.50590.067906
23-0.193348-1.78260.039113
240.5564935.13061e-06
25-0.197171-1.81780.036307
26-0.171956-1.58540.0583
270.0415290.38290.351381
280.1649851.52110.065974
29-0.087827-0.80970.21018
300.0081590.07520.470108
31-0.080584-0.74290.22978
320.057380.5290.299085
330.036970.34080.367031
34-0.125136-1.15370.125929
35-0.150881-1.3910.08392
360.4927484.54299e-06
37-0.141703-1.30640.097465
38-0.150773-1.39010.08407
390.0805020.74220.230007
400.1170671.07930.141753
41-0.092481-0.85260.19813
42-0.006933-0.06390.474592
43-0.077042-0.71030.239734
440.0442630.40810.342119
450.0091290.08420.466561
46-0.048741-0.44940.327155
47-0.130233-1.20070.116603
480.3330193.07030.001436


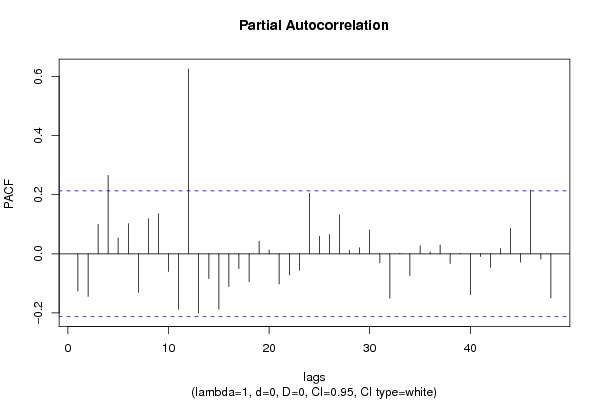
Partial Autocorrelation Function
Time lag kPACF(k)T-STATP-value
1-0.125989-1.16160.124333
2-0.143929-1.3270.094039
30.0996650.91890.180382
40.2646922.44030.008375
50.0529610.48830.313305
60.1017920.93850.175329
7-0.130259-1.20090.116557
80.1187011.09440.138442
90.1351661.24620.108063
10-0.059724-0.55060.291666
11-0.187472-1.72840.043773
120.6252375.76440
13-0.199923-1.84320.034393
14-0.0836-0.77080.221496
15-0.187477-1.72850.043769
16-0.110774-1.02130.155009
17-0.049699-0.45820.323989
18-0.09476-0.87360.192387
190.0425990.39270.347748
200.0125030.11530.454249
21-0.102363-0.94370.173989
22-0.071758-0.66160.255017
23-0.055485-0.51150.305147
240.2049231.88930.031131
250.0588570.54260.2944
260.0650670.59990.275089
270.1316811.2140.114048
280.0116960.10780.457192
290.0201380.18570.426575
300.080260.740.23068
31-0.030457-0.28080.389772
32-0.149296-1.37640.08615
330.0004830.00450.498227
34-0.073611-0.67870.2496
350.0267940.2470.40274
360.0066260.06110.475715
370.0299140.27580.391688
38-0.032855-0.30290.381349
390.0012360.01140.495467
40-0.138617-1.2780.102367
41-0.009001-0.0830.467028
42-0.04564-0.42080.337488
430.0179770.16570.434377
440.0860060.79290.215012
45-0.028271-0.26060.3975
460.2148731.9810.02541
47-0.017905-0.16510.434636
48-0.149073-1.37440.086468

\begin{tabular}{lllllllll}
\hline
Partial Autocorrelation Function \tabularnewline
Time lag k & PACF(k) & T-STAT & P-value \tabularnewline
1 & -0.125989 & -1.1616 & 0.124333 \tabularnewline
2 & -0.143929 & -1.327 & 0.094039 \tabularnewline
3 & 0.099665 & 0.9189 & 0.180382 \tabularnewline
4 & 0.264692 & 2.4403 & 0.008375 \tabularnewline
5 & 0.052961 & 0.4883 & 0.313305 \tabularnewline
6 & 0.101792 & 0.9385 & 0.175329 \tabularnewline
7 & -0.130259 & -1.2009 & 0.116557 \tabularnewline
8 & 0.118701 & 1.0944 & 0.138442 \tabularnewline
9 & 0.135166 & 1.2462 & 0.108063 \tabularnewline
10 & -0.059724 & -0.5506 & 0.291666 \tabularnewline
11 & -0.187472 & -1.7284 & 0.043773 \tabularnewline
12 & 0.625237 & 5.7644 & 0 \tabularnewline
13 & -0.199923 & -1.8432 & 0.034393 \tabularnewline
14 & -0.0836 & -0.7708 & 0.221496 \tabularnewline
15 & -0.187477 & -1.7285 & 0.043769 \tabularnewline
16 & -0.110774 & -1.0213 & 0.155009 \tabularnewline
17 & -0.049699 & -0.4582 & 0.323989 \tabularnewline
18 & -0.09476 & -0.8736 & 0.192387 \tabularnewline
19 & 0.042599 & 0.3927 & 0.347748 \tabularnewline
20 & 0.012503 & 0.1153 & 0.454249 \tabularnewline
21 & -0.102363 & -0.9437 & 0.173989 \tabularnewline
22 & -0.071758 & -0.6616 & 0.255017 \tabularnewline
23 & -0.055485 & -0.5115 & 0.305147 \tabularnewline
24 & 0.204923 & 1.8893 & 0.031131 \tabularnewline
25 & 0.058857 & 0.5426 & 0.2944 \tabularnewline
26 & 0.065067 & 0.5999 & 0.275089 \tabularnewline
27 & 0.131681 & 1.214 & 0.114048 \tabularnewline
28 & 0.011696 & 0.1078 & 0.457192 \tabularnewline
29 & 0.020138 & 0.1857 & 0.426575 \tabularnewline
30 & 0.08026 & 0.74 & 0.23068 \tabularnewline
31 & -0.030457 & -0.2808 & 0.389772 \tabularnewline
32 & -0.149296 & -1.3764 & 0.08615 \tabularnewline
33 & 0.000483 & 0.0045 & 0.498227 \tabularnewline
34 & -0.073611 & -0.6787 & 0.2496 \tabularnewline
35 & 0.026794 & 0.247 & 0.40274 \tabularnewline
36 & 0.006626 & 0.0611 & 0.475715 \tabularnewline
37 & 0.029914 & 0.2758 & 0.391688 \tabularnewline
38 & -0.032855 & -0.3029 & 0.381349 \tabularnewline
39 & 0.001236 & 0.0114 & 0.495467 \tabularnewline
40 & -0.138617 & -1.278 & 0.102367 \tabularnewline
41 & -0.009001 & -0.083 & 0.467028 \tabularnewline
42 & -0.04564 & -0.4208 & 0.337488 \tabularnewline
43 & 0.017977 & 0.1657 & 0.434377 \tabularnewline
44 & 0.086006 & 0.7929 & 0.215012 \tabularnewline
45 & -0.028271 & -0.2606 & 0.3975 \tabularnewline
46 & 0.214873 & 1.981 & 0.02541 \tabularnewline
47 & -0.017905 & -0.1651 & 0.434636 \tabularnewline
48 & -0.149073 & -1.3744 & 0.086468 \tabularnewline
\hline
\end{tabular}
%Source: https://freestatistics.org/blog/index.php?pk=119788&T=2

[TABLE]
[ROW][C]Partial Autocorrelation Function[/C][/ROW]
[ROW][C]Time lag k[/C][C]PACF(k)[/C][C]T-STAT[/C][C]P-value[/C][/ROW]
[ROW][C]1[/C][C]-0.125989[/C][C]-1.1616[/C][C]0.124333[/C][/ROW]
[ROW][C]2[/C][C]-0.143929[/C][C]-1.327[/C][C]0.094039[/C][/ROW]
[ROW][C]3[/C][C]0.099665[/C][C]0.9189[/C][C]0.180382[/C][/ROW]
[ROW][C]4[/C][C]0.264692[/C][C]2.4403[/C][C]0.008375[/C][/ROW]
[ROW][C]5[/C][C]0.052961[/C][C]0.4883[/C][C]0.313305[/C][/ROW]
[ROW][C]6[/C][C]0.101792[/C][C]0.9385[/C][C]0.175329[/C][/ROW]
[ROW][C]7[/C][C]-0.130259[/C][C]-1.2009[/C][C]0.116557[/C][/ROW]
[ROW][C]8[/C][C]0.118701[/C][C]1.0944[/C][C]0.138442[/C][/ROW]
[ROW][C]9[/C][C]0.135166[/C][C]1.2462[/C][C]0.108063[/C][/ROW]
[ROW][C]10[/C][C]-0.059724[/C][C]-0.5506[/C][C]0.291666[/C][/ROW]
[ROW][C]11[/C][C]-0.187472[/C][C]-1.7284[/C][C]0.043773[/C][/ROW]
[ROW][C]12[/C][C]0.625237[/C][C]5.7644[/C][C]0[/C][/ROW]
[ROW][C]13[/C][C]-0.199923[/C][C]-1.8432[/C][C]0.034393[/C][/ROW]
[ROW][C]14[/C][C]-0.0836[/C][C]-0.7708[/C][C]0.221496[/C][/ROW]
[ROW][C]15[/C][C]-0.187477[/C][C]-1.7285[/C][C]0.043769[/C][/ROW]
[ROW][C]16[/C][C]-0.110774[/C][C]-1.0213[/C][C]0.155009[/C][/ROW]
[ROW][C]17[/C][C]-0.049699[/C][C]-0.4582[/C][C]0.323989[/C][/ROW]
[ROW][C]18[/C][C]-0.09476[/C][C]-0.8736[/C][C]0.192387[/C][/ROW]
[ROW][C]19[/C][C]0.042599[/C][C]0.3927[/C][C]0.347748[/C][/ROW]
[ROW][C]20[/C][C]0.012503[/C][C]0.1153[/C][C]0.454249[/C][/ROW]
[ROW][C]21[/C][C]-0.102363[/C][C]-0.9437[/C][C]0.173989[/C][/ROW]
[ROW][C]22[/C][C]-0.071758[/C][C]-0.6616[/C][C]0.255017[/C][/ROW]
[ROW][C]23[/C][C]-0.055485[/C][C]-0.5115[/C][C]0.305147[/C][/ROW]
[ROW][C]24[/C][C]0.204923[/C][C]1.8893[/C][C]0.031131[/C][/ROW]
[ROW][C]25[/C][C]0.058857[/C][C]0.5426[/C][C]0.2944[/C][/ROW]
[ROW][C]26[/C][C]0.065067[/C][C]0.5999[/C][C]0.275089[/C][/ROW]
[ROW][C]27[/C][C]0.131681[/C][C]1.214[/C][C]0.114048[/C][/ROW]
[ROW][C]28[/C][C]0.011696[/C][C]0.1078[/C][C]0.457192[/C][/ROW]
[ROW][C]29[/C][C]0.020138[/C][C]0.1857[/C][C]0.426575[/C][/ROW]
[ROW][C]30[/C][C]0.08026[/C][C]0.74[/C][C]0.23068[/C][/ROW]
[ROW][C]31[/C][C]-0.030457[/C][C]-0.2808[/C][C]0.389772[/C][/ROW]
[ROW][C]32[/C][C]-0.149296[/C][C]-1.3764[/C][C]0.08615[/C][/ROW]
[ROW][C]33[/C][C]0.000483[/C][C]0.0045[/C][C]0.498227[/C][/ROW]
[ROW][C]34[/C][C]-0.073611[/C][C]-0.6787[/C][C]0.2496[/C][/ROW]
[ROW][C]35[/C][C]0.026794[/C][C]0.247[/C][C]0.40274[/C][/ROW]
[ROW][C]36[/C][C]0.006626[/C][C]0.0611[/C][C]0.475715[/C][/ROW]
[ROW][C]37[/C][C]0.029914[/C][C]0.2758[/C][C]0.391688[/C][/ROW]
[ROW][C]38[/C][C]-0.032855[/C][C]-0.3029[/C][C]0.381349[/C][/ROW]
[ROW][C]39[/C][C]0.001236[/C][C]0.0114[/C][C]0.495467[/C][/ROW]
[ROW][C]40[/C][C]-0.138617[/C][C]-1.278[/C][C]0.102367[/C][/ROW]
[ROW][C]41[/C][C]-0.009001[/C][C]-0.083[/C][C]0.467028[/C][/ROW]
[ROW][C]42[/C][C]-0.04564[/C][C]-0.4208[/C][C]0.337488[/C][/ROW]
[ROW][C]43[/C][C]0.017977[/C][C]0.1657[/C][C]0.434377[/C][/ROW]
[ROW][C]44[/C][C]0.086006[/C][C]0.7929[/C][C]0.215012[/C][/ROW]
[ROW][C]45[/C][C]-0.028271[/C][C]-0.2606[/C][C]0.3975[/C][/ROW]
[ROW][C]46[/C][C]0.214873[/C][C]1.981[/C][C]0.02541[/C][/ROW]
[ROW][C]47[/C][C]-0.017905[/C][C]-0.1651[/C][C]0.434636[/C][/ROW]
[ROW][C]48[/C][C]-0.149073[/C][C]-1.3744[/C][C]0.086468[/C][/ROW]
[/TABLE]
Source: https://freestatistics.org/blog/index.php?pk=119788&T=2

Globally Unique Identifier (entire table): ba.freestatistics.org/blog/index.php?pk=119788&T=2

As an alternative you can also use a QR Code:  

The GUIDs for individual cells are displayed in the table below:

Partial Autocorrelation Function
Time lag kPACF(k)T-STATP-value
1-0.125989-1.16160.124333
2-0.143929-1.3270.094039
30.0996650.91890.180382
40.2646922.44030.008375
50.0529610.48830.313305
60.1017920.93850.175329
7-0.130259-1.20090.116557
80.1187011.09440.138442
90.1351661.24620.108063
10-0.059724-0.55060.291666
11-0.187472-1.72840.043773
120.6252375.76440
13-0.199923-1.84320.034393
14-0.0836-0.77080.221496
15-0.187477-1.72850.043769
16-0.110774-1.02130.155009
17-0.049699-0.45820.323989
18-0.09476-0.87360.192387
190.0425990.39270.347748
200.0125030.11530.454249
21-0.102363-0.94370.173989
22-0.071758-0.66160.255017
23-0.055485-0.51150.305147
240.2049231.88930.031131
250.0588570.54260.2944
260.0650670.59990.275089
270.1316811.2140.114048
280.0116960.10780.457192
290.0201380.18570.426575
300.080260.740.23068
31-0.030457-0.28080.389772
32-0.149296-1.37640.08615
330.0004830.00450.498227
34-0.073611-0.67870.2496
350.0267940.2470.40274
360.0066260.06110.475715
370.0299140.27580.391688
38-0.032855-0.30290.381349
390.0012360.01140.495467
40-0.138617-1.2780.102367
41-0.009001-0.0830.467028
42-0.04564-0.42080.337488
430.0179770.16570.434377
440.0860060.79290.215012
45-0.028271-0.26060.3975
460.2148731.9810.02541
47-0.017905-0.16510.434636
48-0.149073-1.37440.086468


Parameters (Session):
par1 = 48 ; par2 = 1 ; par3 = 0 ; par4 = 0 ; par5 = 12 ; par6 = White Noise ; par7 = 0.95 ;
Parameters (R input):
par1 = 48 ; par2 = 1 ; par3 = 0 ; par4 = 0 ; par5 = 12 ; par6 = White Noise ; par7 = 0.95 ; par8 = ;
R code (references can be found in the software module):
if (par1 == 'Default') {
par1 = 10*log10(length(x))
} else {
par1 <- as.numeric(par1)
}
par2 <- as.numeric(par2)
par3 <- as.numeric(par3)
par4 <- as.numeric(par4)
par5 <- as.numeric(par5)
if (par6 == 'White Noise') par6 <- 'white' else par6 <- 'ma'
par7 <- as.numeric(par7)
if (par8 != '') par8 <- as.numeric(par8)
ox <- x
if (par8 == '') {
if (par2 == 0) {
x <- log(x)
} else {
x <- (x ^ par2 - 1) / par2
}
} else {
x <- log(x,base=par8)
}
if (par3 > 0) x <- diff(x,lag=1,difference=par3)
if (par4 > 0) x <- diff(x,lag=par5,difference=par4)
bitmap(file='picts.png')
op <- par(mfrow=c(2,1))
plot(ox,type='l',main='Original Time Series',xlab='time',ylab='value')
if (par8=='') {
mytitle <- paste('Working Time Series (lambda=',par2,', d=',par3,', D=',par4,')',sep='')
mysub <- paste('(lambda=',par2,', d=',par3,', D=',par4,', CI=', par7, ', CI type=',par6,')',sep='')
} else {
mytitle <- paste('Working Time Series (base=',par8,', d=',par3,', D=',par4,')',sep='')
mysub <- paste('(base=',par8,', d=',par3,', D=',par4,', CI=', par7, ', CI type=',par6,')',sep='')
}
plot(x,type='l', main=mytitle,xlab='time',ylab='value')
par(op)
dev.off()
bitmap(file='pic1.png')
racf <- acf(x, par1, main='Autocorrelation', xlab='time lag', ylab='ACF', ci.type=par6, ci=par7, sub=mysub)
dev.off()
bitmap(file='pic2.png')
rpacf <- pacf(x,par1,main='Partial Autocorrelation',xlab='lags',ylab='PACF',sub=mysub)
dev.off()
(myacf <- c(racf$acf))
(mypacf <- c(rpacf$acf))
lengthx <- length(x)
sqrtn <- sqrt(lengthx)
load(file='createtable')
a<-table.start()
a<-table.row.start(a)
a<-table.element(a,'Autocorrelation Function',4,TRUE)
a<-table.row.end(a)
a<-table.row.start(a)
a<-table.element(a,'Time lag k',header=TRUE)
a<-table.element(a,hyperlink('basics.htm','ACF(k)','click here for more information about the Autocorrelation Function'),header=TRUE)
a<-table.element(a,'T-STAT',header=TRUE)
a<-table.element(a,'P-value',header=TRUE)
a<-table.row.end(a)
for (i in 2:(par1+1)) {
a<-table.row.start(a)
a<-table.element(a,i-1,header=TRUE)
a<-table.element(a,round(myacf[i],6))
mytstat <- myacf[i]*sqrtn
a<-table.element(a,round(mytstat,4))
a<-table.element(a,round(1-pt(abs(mytstat),lengthx),6))
a<-table.row.end(a)
}
a<-table.end(a)
table.save(a,file='mytable.tab')
a<-table.start()
a<-table.row.start(a)
a<-table.element(a,'Partial Autocorrelation Function',4,TRUE)
a<-table.row.end(a)
a<-table.row.start(a)
a<-table.element(a,'Time lag k',header=TRUE)
a<-table.element(a,hyperlink('basics.htm','PACF(k)','click here for more information about the Partial Autocorrelation Function'),header=TRUE)
a<-table.element(a,'T-STAT',header=TRUE)
a<-table.element(a,'P-value',header=TRUE)
a<-table.row.end(a)
for (i in 1:par1) {
a<-table.row.start(a)
a<-table.element(a,i,header=TRUE)
a<-table.element(a,round(mypacf[i],6))
mytstat <- mypacf[i]*sqrtn
a<-table.element(a,round(mytstat,4))
a<-table.element(a,round(1-pt(abs(mytstat),lengthx),6))
a<-table.row.end(a)
}
a<-table.end(a)
table.save(a,file='mytable1.tab')