Free Statistics

of Irreproducible Research!

Author's title

Author*Unverified author*
R Software Modulerwasp_smp.wasp
Title produced by softwareStandard Deviation-Mean Plot
Date of computationSun, 16 Jan 2011 23:53:14 +0000
Cite this page as followsStatistical Computations at FreeStatistics.org, Office for Research Development and Education, URL https://freestatistics.org/blog/index.php?v=date/2011/Jan/17/t1295221896hbcjeurf87ogxk1.htm/, Retrieved Sun, 19 May 2024 03:22:07 +0000
Statistical Computations at FreeStatistics.org, Office for Research Development and Education, URL https://freestatistics.org/blog/index.php?pk=117496, Retrieved Sun, 19 May 2024 03:22:07 +0000
QR Codes:

Original text written by user:
IsPrivate?No (this computation is public)
User-defined keywordsKDGP2W83
Estimated Impact183
Family? (F = Feedback message, R = changed R code, M = changed R Module, P = changed Parameters, D = changed Data)
-     [Standard Deviation Plot] [] [2010-12-12 16:16:55] [cdbe0c453eb9effe5ed0ab336cdc30fc]
- RM D    [Standard Deviation-Mean Plot] [] [2011-01-16 23:53:14] [49c40d716750d950b45a50638ed38982] [Current]
Feedback Forum

Post a new message
Dataseries X:
1590
1798
1935
1887
2027
2080
1556
1682
1785
1869
1781
2082
2571
1862
1938
1505
1767
1607
1578
1495
1615
1700
1337
1531
1623
1543
1640
1524
1429
1827
1603
1351
1267
1742
1384
1392
1649
1665
1526
1717
1391
1790
1472
1350
1704
1391
1190
1351
1160
1236
1444
1257
1193
1701
1428
1611
1431
1472
1240
1276


Summary of computational transaction
Raw Inputview raw input (R code)
Raw Outputview raw output of R engine
Computing time0 seconds
R Server'Gwilym Jenkins' @ www.wessa.org

\begin{tabular}{lllllllll}
\hline
Summary of computational transaction \tabularnewline
Raw Input & view raw input (R code)  \tabularnewline
Raw Output & view raw output of R engine  \tabularnewline
Computing time & 0 seconds \tabularnewline
R Server & 'Gwilym Jenkins' @ www.wessa.org \tabularnewline
\hline
\end{tabular}
%Source: https://freestatistics.org/blog/index.php?pk=117496&T=0

[TABLE]
[ROW][C]Summary of computational transaction[/C][/ROW]
[ROW][C]Raw Input[/C][C]view raw input (R code) [/C][/ROW]
[ROW][C]Raw Output[/C][C]view raw output of R engine [/C][/ROW]
[ROW][C]Computing time[/C][C]0 seconds[/C][/ROW]
[ROW][C]R Server[/C][C]'Gwilym Jenkins' @ www.wessa.org[/C][/ROW]
[/TABLE]
Source: https://freestatistics.org/blog/index.php?pk=117496&T=0

Globally Unique Identifier (entire table): ba.freestatistics.org/blog/index.php?pk=117496&T=0

As an alternative you can also use a QR Code:  

The GUIDs for individual cells are displayed in the table below:

Summary of computational transaction
Raw Inputview raw input (R code)
Raw Outputview raw output of R engine
Computing time0 seconds
R Server'Gwilym Jenkins' @ www.wessa.org


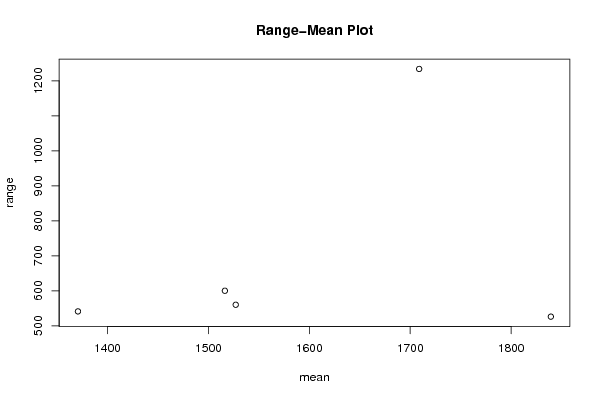
Standard Deviation-Mean Plot
SectionMeanStandard DeviationRange
11839.33333333333175.704469510769526
21708.83333333333318.5506477022381234
31527.08333333333168.173318786052560
41516.33333333333187.09566504542600
51370.75171.222940795168541

\begin{tabular}{lllllllll}
\hline
Standard Deviation-Mean Plot \tabularnewline
Section & Mean & Standard Deviation & Range \tabularnewline
1 & 1839.33333333333 & 175.704469510769 & 526 \tabularnewline
2 & 1708.83333333333 & 318.550647702238 & 1234 \tabularnewline
3 & 1527.08333333333 & 168.173318786052 & 560 \tabularnewline
4 & 1516.33333333333 & 187.09566504542 & 600 \tabularnewline
5 & 1370.75 & 171.222940795168 & 541 \tabularnewline
\hline
\end{tabular}
%Source: https://freestatistics.org/blog/index.php?pk=117496&T=1

[TABLE]
[ROW][C]Standard Deviation-Mean Plot[/C][/ROW]
[ROW][C]Section[/C][C]Mean[/C][C]Standard Deviation[/C][C]Range[/C][/ROW]
[ROW][C]1[/C][C]1839.33333333333[/C][C]175.704469510769[/C][C]526[/C][/ROW]
[ROW][C]2[/C][C]1708.83333333333[/C][C]318.550647702238[/C][C]1234[/C][/ROW]
[ROW][C]3[/C][C]1527.08333333333[/C][C]168.173318786052[/C][C]560[/C][/ROW]
[ROW][C]4[/C][C]1516.33333333333[/C][C]187.09566504542[/C][C]600[/C][/ROW]
[ROW][C]5[/C][C]1370.75[/C][C]171.222940795168[/C][C]541[/C][/ROW]
[/TABLE]
Source: https://freestatistics.org/blog/index.php?pk=117496&T=1

Globally Unique Identifier (entire table): ba.freestatistics.org/blog/index.php?pk=117496&T=1

As an alternative you can also use a QR Code:  

The GUIDs for individual cells are displayed in the table below:

Standard Deviation-Mean Plot
SectionMeanStandard DeviationRange
11839.33333333333175.704469510769526
21708.83333333333318.5506477022381234
31527.08333333333168.173318786052560
41516.33333333333187.09566504542600
51370.75171.222940795168541


Regression: S.E.(k) = alpha + beta * Mean(k)
alpha-1.18628477588365
beta0.128941909706417
S.D.0.189090380311578
T-STAT0.681906237080653
p-value0.544226340705528

\begin{tabular}{lllllllll}
\hline
Regression: S.E.(k) = alpha + beta * Mean(k) \tabularnewline
alpha & -1.18628477588365 \tabularnewline
beta & 0.128941909706417 \tabularnewline
S.D. & 0.189090380311578 \tabularnewline
T-STAT & 0.681906237080653 \tabularnewline
p-value & 0.544226340705528 \tabularnewline
\hline
\end{tabular}
%Source: https://freestatistics.org/blog/index.php?pk=117496&T=2

[TABLE]
[ROW][C]Regression: S.E.(k) = alpha + beta * Mean(k)[/C][/ROW]
[ROW][C]alpha[/C][C]-1.18628477588365[/C][/ROW]
[ROW][C]beta[/C][C]0.128941909706417[/C][/ROW]
[ROW][C]S.D.[/C][C]0.189090380311578[/C][/ROW]
[ROW][C]T-STAT[/C][C]0.681906237080653[/C][/ROW]
[ROW][C]p-value[/C][C]0.544226340705528[/C][/ROW]
[/TABLE]
Source: https://freestatistics.org/blog/index.php?pk=117496&T=2

Globally Unique Identifier (entire table): ba.freestatistics.org/blog/index.php?pk=117496&T=2

As an alternative you can also use a QR Code:  

The GUIDs for individual cells are displayed in the table below:

Regression: S.E.(k) = alpha + beta * Mean(k)
alpha-1.18628477588365
beta0.128941909706417
S.D.0.189090380311578
T-STAT0.681906237080653
p-value0.544226340705528


Regression: ln S.E.(k) = alpha + beta * ln Mean(k)
alpha-1.43734712333817
beta0.912589896796034
S.D.1.25751184971254
T-STAT0.725710773226228
p-value0.520505794399302
Lambda0.087410103203966

\begin{tabular}{lllllllll}
\hline
Regression: ln S.E.(k) = alpha + beta * ln Mean(k) \tabularnewline
alpha & -1.43734712333817 \tabularnewline
beta & 0.912589896796034 \tabularnewline
S.D. & 1.25751184971254 \tabularnewline
T-STAT & 0.725710773226228 \tabularnewline
p-value & 0.520505794399302 \tabularnewline
Lambda & 0.087410103203966 \tabularnewline
\hline
\end{tabular}
%Source: https://freestatistics.org/blog/index.php?pk=117496&T=3

[TABLE]
[ROW][C]Regression: ln S.E.(k) = alpha + beta * ln Mean(k)[/C][/ROW]
[ROW][C]alpha[/C][C]-1.43734712333817[/C][/ROW]
[ROW][C]beta[/C][C]0.912589896796034[/C][/ROW]
[ROW][C]S.D.[/C][C]1.25751184971254[/C][/ROW]
[ROW][C]T-STAT[/C][C]0.725710773226228[/C][/ROW]
[ROW][C]p-value[/C][C]0.520505794399302[/C][/ROW]
[ROW][C]Lambda[/C][C]0.087410103203966[/C][/ROW]
[/TABLE]
Source: https://freestatistics.org/blog/index.php?pk=117496&T=3

Globally Unique Identifier (entire table): ba.freestatistics.org/blog/index.php?pk=117496&T=3

As an alternative you can also use a QR Code:  

The GUIDs for individual cells are displayed in the table below:

Regression: ln S.E.(k) = alpha + beta * ln Mean(k)
alpha-1.43734712333817
beta0.912589896796034
S.D.1.25751184971254
T-STAT0.725710773226228
p-value0.520505794399302
Lambda0.087410103203966


Parameters (Session):
par1 = 12 ;
Parameters (R input):
par1 = 12 ;
R code (references can be found in the software module):
par1 <- as.numeric(par1)
(n <- length(x))
(np <- floor(n / par1))
arr <- array(NA,dim=c(par1,np))
j <- 0
k <- 1
for (i in 1:(np*par1))
{
j = j + 1
arr[j,k] <- x[i]
if (j == par1) {
j = 0
k=k+1
}
}
arr
arr.mean <- array(NA,dim=np)
arr.sd <- array(NA,dim=np)
arr.range <- array(NA,dim=np)
for (j in 1:np)
{
arr.mean[j] <- mean(arr[,j],na.rm=TRUE)
arr.sd[j] <- sd(arr[,j],na.rm=TRUE)
arr.range[j] <- max(arr[,j],na.rm=TRUE) - min(arr[,j],na.rm=TRUE)
}
arr.mean
arr.sd
arr.range
(lm1 <- lm(arr.sd~arr.mean))
(lnlm1 <- lm(log(arr.sd)~log(arr.mean)))
(lm2 <- lm(arr.range~arr.mean))
bitmap(file='test1.png')
plot(arr.mean,arr.sd,main='Standard Deviation-Mean Plot',xlab='mean',ylab='standard deviation')
dev.off()
bitmap(file='test2.png')
plot(arr.mean,arr.range,main='Range-Mean Plot',xlab='mean',ylab='range')
dev.off()
load(file='createtable')
a<-table.start()
a<-table.row.start(a)
a<-table.element(a,'Standard Deviation-Mean Plot',4,TRUE)
a<-table.row.end(a)
a<-table.row.start(a)
a<-table.element(a,'Section',header=TRUE)
a<-table.element(a,'Mean',header=TRUE)
a<-table.element(a,'Standard Deviation',header=TRUE)
a<-table.element(a,'Range',header=TRUE)
a<-table.row.end(a)
for (j in 1:np) {
a<-table.row.start(a)
a<-table.element(a,j,header=TRUE)
a<-table.element(a,arr.mean[j])
a<-table.element(a,arr.sd[j] )
a<-table.element(a,arr.range[j] )
a<-table.row.end(a)
}
a<-table.end(a)
table.save(a,file='mytable.tab')
a<-table.start()
a<-table.row.start(a)
a<-table.element(a,'Regression: S.E.(k) = alpha + beta * Mean(k)',2,TRUE)
a<-table.row.end(a)
a<-table.row.start(a)
a<-table.element(a,'alpha',header=TRUE)
a<-table.element(a,lm1$coefficients[[1]])
a<-table.row.end(a)
a<-table.row.start(a)
a<-table.element(a,'beta',header=TRUE)
a<-table.element(a,lm1$coefficients[[2]])
a<-table.row.end(a)
a<-table.row.start(a)
a<-table.element(a,'S.D.',header=TRUE)
a<-table.element(a,summary(lm1)$coefficients[2,2])
a<-table.row.end(a)
a<-table.row.start(a)
a<-table.element(a,'T-STAT',header=TRUE)
a<-table.element(a,summary(lm1)$coefficients[2,3])
a<-table.row.end(a)
a<-table.row.start(a)
a<-table.element(a,'p-value',header=TRUE)
a<-table.element(a,summary(lm1)$coefficients[2,4])
a<-table.row.end(a)
a<-table.end(a)
table.save(a,file='mytable1.tab')
a<-table.start()
a<-table.row.start(a)
a<-table.element(a,'Regression: ln S.E.(k) = alpha + beta * ln Mean(k)',2,TRUE)
a<-table.row.end(a)
a<-table.row.start(a)
a<-table.element(a,'alpha',header=TRUE)
a<-table.element(a,lnlm1$coefficients[[1]])
a<-table.row.end(a)
a<-table.row.start(a)
a<-table.element(a,'beta',header=TRUE)
a<-table.element(a,lnlm1$coefficients[[2]])
a<-table.row.end(a)
a<-table.row.start(a)
a<-table.element(a,'S.D.',header=TRUE)
a<-table.element(a,summary(lnlm1)$coefficients[2,2])
a<-table.row.end(a)
a<-table.row.start(a)
a<-table.element(a,'T-STAT',header=TRUE)
a<-table.element(a,summary(lnlm1)$coefficients[2,3])
a<-table.row.end(a)
a<-table.row.start(a)
a<-table.element(a,'p-value',header=TRUE)
a<-table.element(a,summary(lnlm1)$coefficients[2,4])
a<-table.row.end(a)
a<-table.row.start(a)
a<-table.element(a,'Lambda',header=TRUE)
a<-table.element(a,1-lnlm1$coefficients[[2]])
a<-table.row.end(a)
a<-table.end(a)
table.save(a,file='mytable2.tab')