Free Statistics
of Irreproducible Research!
Description of Statistical Computation | |||||||||||||||||||||||||||||||||||||||||
|---|---|---|---|---|---|---|---|---|---|---|---|---|---|---|---|---|---|---|---|---|---|---|---|---|---|---|---|---|---|---|---|---|---|---|---|---|---|---|---|---|---|
| Author's title | |||||||||||||||||||||||||||||||||||||||||
| Author | *Unverified author* | ||||||||||||||||||||||||||||||||||||||||
| R Software Module | rwasp_univariatedataseries.wasp | ||||||||||||||||||||||||||||||||||||||||
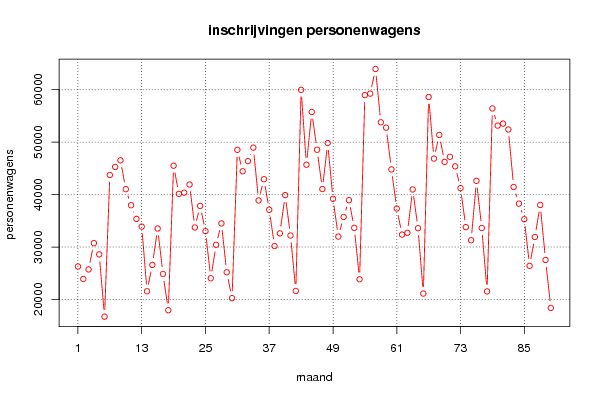
| Title produced by software | Univariate Data Series | ||||||||||||||||||||||||||||||||||||||||
| Date of computation | Tue, 22 Feb 2011 12:36:53 +0000 | ||||||||||||||||||||||||||||||||||||||||
| Cite this page as follows | Statistical Computations at FreeStatistics.org, Office for Research Development and Education, URL https://freestatistics.org/blog/index.php?v=date/2011/Feb/22/t1298378355sevluwt9hnm3xrc.htm/, Retrieved Sun, 19 May 2024 14:14:11 +0000 | ||||||||||||||||||||||||||||||||||||||||
| Statistical Computations at FreeStatistics.org, Office for Research Development and Education, URL https://freestatistics.org/blog/index.php?pk=118736, Retrieved Sun, 19 May 2024 14:14:11 +0000 | |||||||||||||||||||||||||||||||||||||||||
| QR Codes: | |||||||||||||||||||||||||||||||||||||||||
|
| |||||||||||||||||||||||||||||||||||||||||
| Original text written by user: | maandelijkse inschrijvingen van nieuwe personenwagens van 1995 tot 2002 | ||||||||||||||||||||||||||||||||||||||||
| IsPrivate? | No (this computation is public) | ||||||||||||||||||||||||||||||||||||||||
| User-defined keywords | KDGP1W22 | ||||||||||||||||||||||||||||||||||||||||
| Estimated Impact | 154 | ||||||||||||||||||||||||||||||||||||||||
Tree of Dependent Computations | |||||||||||||||||||||||||||||||||||||||||
| Family? (F = Feedback message, R = changed R code, M = changed R Module, P = changed Parameters, D = changed Data) | |||||||||||||||||||||||||||||||||||||||||
| - [Univariate Data Series] [datareeks-inschri...] [2011-02-22 12:36:53] [ebb64913e7d7e5b0e5266ebfea2a3acd] [Current] | |||||||||||||||||||||||||||||||||||||||||
| Feedback Forum | |||||||||||||||||||||||||||||||||||||||||
Post a new message | |||||||||||||||||||||||||||||||||||||||||
Dataset | |||||||||||||||||||||||||||||||||||||||||
| Dataseries X: | |||||||||||||||||||||||||||||||||||||||||
26281 23899 25727 30733 28599 16723 43738 45272 46532 41032 37967 35366 33892 21560 26588 33527 24859 17952 45504 40129 40357 41913 33730 37842 33025 24050 30429 34507 25189 20253 48527 44446 46380 48950 38883 42928 37107 30186 32602 39892 32194 21629 59968 45694 55756 48554 41052 49822 39191 31994 35735 38930 33658 23849 58972 59249 63955 53785 52760 44795 37348 32370 32717 40974 33591 21124 58608 46865 51378 46235 47206 45382 41227 33795 31295 42625 33625 21538 56421 53152 53536 52408 41454 38271 35306 26414 31917 38030 27534 18387 | |||||||||||||||||||||||||||||||||||||||||
Tables (Output of Computation) | |||||||||||||||||||||||||||||||||||||||||
| |||||||||||||||||||||||||||||||||||||||||
Figures (Output of Computation) | |||||||||||||||||||||||||||||||||||||||||
Input Parameters & R Code | |||||||||||||||||||||||||||||||||||||||||
| Parameters (Session): | |||||||||||||||||||||||||||||||||||||||||
| par1 = Maandelijkse inschrijvingen van nieuwe personenwagens ; par2 = http://www.nbb.be/belgostat/SeriesLinker ; par3 = Maandelijkse inschrijvingen van nieuwe personenwagens ; par4 = 12 ; | |||||||||||||||||||||||||||||||||||||||||
| Parameters (R input): | |||||||||||||||||||||||||||||||||||||||||
| par1 = Maandelijkse inschrijvingen van nieuwe personenwagens ; par2 = http://www.nbb.be/belgostat/SeriesLinker ; par3 = Maandelijkse inschrijvingen van nieuwe personenwagens ; par4 = 12 ; | |||||||||||||||||||||||||||||||||||||||||
| R code (references can be found in the software module): | |||||||||||||||||||||||||||||||||||||||||
if (par4 != 'No season') { | |||||||||||||||||||||||||||||||||||||||||