Free Statistics
of Irreproducible Research!
Description of Statistical Computation | |||||||||||||||||||||||||||||||||||||||||
|---|---|---|---|---|---|---|---|---|---|---|---|---|---|---|---|---|---|---|---|---|---|---|---|---|---|---|---|---|---|---|---|---|---|---|---|---|---|---|---|---|---|
| Author's title | |||||||||||||||||||||||||||||||||||||||||
| Author | *Unverified author* | ||||||||||||||||||||||||||||||||||||||||
| R Software Module | rwasp_univariatedataseries.wasp | ||||||||||||||||||||||||||||||||||||||||
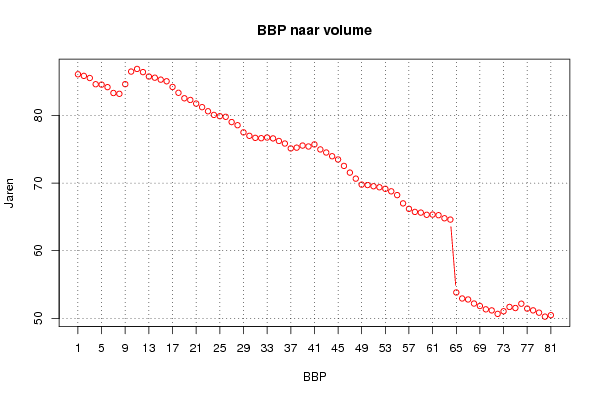
| Title produced by software | Univariate Data Series | ||||||||||||||||||||||||||||||||||||||||
| Date of computation | Sun, 20 Feb 2011 21:06:25 +0000 | ||||||||||||||||||||||||||||||||||||||||
| Cite this page as follows | Statistical Computations at FreeStatistics.org, Office for Research Development and Education, URL https://freestatistics.org/blog/index.php?v=date/2011/Feb/20/t12982358451m25ykz4uap130j.htm/, Retrieved Sun, 19 May 2024 15:26:57 +0000 | ||||||||||||||||||||||||||||||||||||||||
| Statistical Computations at FreeStatistics.org, Office for Research Development and Education, URL https://freestatistics.org/blog/index.php?pk=118519, Retrieved Sun, 19 May 2024 15:26:57 +0000 | |||||||||||||||||||||||||||||||||||||||||
| QR Codes: | |||||||||||||||||||||||||||||||||||||||||
|
| |||||||||||||||||||||||||||||||||||||||||
| Original text written by user: | |||||||||||||||||||||||||||||||||||||||||
| IsPrivate? | No (this computation is public) | ||||||||||||||||||||||||||||||||||||||||
| User-defined keywords | KDGP1W1 | ||||||||||||||||||||||||||||||||||||||||
| Estimated Impact | 121 | ||||||||||||||||||||||||||||||||||||||||
Tree of Dependent Computations | |||||||||||||||||||||||||||||||||||||||||
| Family? (F = Feedback message, R = changed R code, M = changed R Module, P = changed Parameters, D = changed Data) | |||||||||||||||||||||||||||||||||||||||||
| - [Univariate Data Series] [] [2011-02-20 21:02:34] [fa681f9c2d0d4b68475526f59b9a55ed] - PD [Univariate Data Series] [] [2011-02-20 21:06:25] [27d67796c93aa2f19be3a7f001ce610e] [Current] | |||||||||||||||||||||||||||||||||||||||||
| Feedback Forum | |||||||||||||||||||||||||||||||||||||||||
Post a new message | |||||||||||||||||||||||||||||||||||||||||
Dataset | |||||||||||||||||||||||||||||||||||||||||
| Dataseries X: | |||||||||||||||||||||||||||||||||||||||||
86.065 85.826 85.514 84.594 84.531 84.163 83.298 83.178 84.603 86.464 86.851 86.385 85.730 85.557 85.268 85.032 84.190 83.329 82.521 82.268 81.736 81.206 80.602 80.060 79.873 79.779 79.004 78.540 77.488 76.973 76.672 76.621 76.720 76.592 76.212 75.836 75.110 75.223 75.532 75.397 75.705 74.962 74.507 73.957 73.478 72.526 71.539 70.647 69.763 69.705 69.525 69.375 69.144 68.776 68.216 66.995 66.184 65.732 65.630 65.307 65.338 65.246 64.795 64.597 53.837 52.947 52.799 52.199 51.834 51.345 51.183 50.671 51.059 51.696 51.537 52.171 51.450 51.191 50.848 50.261 50.479 | |||||||||||||||||||||||||||||||||||||||||
Tables (Output of Computation) | |||||||||||||||||||||||||||||||||||||||||
| |||||||||||||||||||||||||||||||||||||||||
Figures (Output of Computation) | |||||||||||||||||||||||||||||||||||||||||
Input Parameters & R Code | |||||||||||||||||||||||||||||||||||||||||
| Parameters (Session): | |||||||||||||||||||||||||||||||||||||||||
| par1 = BBP ; par2 = http://www.nbb.be/belgostat/PublicatieSelectieLinker?LinkID=656000098|910000082&Lang=N ; par4 = 4 ; | |||||||||||||||||||||||||||||||||||||||||
| Parameters (R input): | |||||||||||||||||||||||||||||||||||||||||
| par1 = BBP ; par2 = http://www.nbb.be/belgostat/PublicatieSelectieLinker?LinkID=656000098|910000082&Lang=N ; par3 = ; par4 = 4 ; | |||||||||||||||||||||||||||||||||||||||||
| R code (references can be found in the software module): | |||||||||||||||||||||||||||||||||||||||||
if (par4 != 'No season') { | |||||||||||||||||||||||||||||||||||||||||