Free Statistics

of Irreproducible Research!

Author's title

Author*The author of this computation has been verified*
R Software Modulerwasp_arimaforecasting.wasp
Title produced by softwareARIMA Forecasting
Date of computationThu, 03 Feb 2011 14:20:25 +0000
Cite this page as followsStatistical Computations at FreeStatistics.org, Office for Research Development and Education, URL https://freestatistics.org/blog/index.php?v=date/2011/Feb/03/t1296744099gpxrs5b2vbu32zo.htm/, Retrieved Sun, 19 May 2024 15:41:04 +0000
Statistical Computations at FreeStatistics.org, Office for Research Development and Education, URL https://freestatistics.org/blog/index.php?pk=118077, Retrieved Sun, 19 May 2024 15:41:04 +0000
QR Codes:

Original text written by user:
IsPrivate?No (this computation is public)
User-defined keywords
Estimated Impact161
Family? (F = Feedback message, R = changed R code, M = changed R Module, P = changed Parameters, D = changed Data)
-       [ARIMA Forecasting] [] [2011-02-03 14:20:25] [ff423994c38282a6d306f7d0147a5924] [Current]
Feedback Forum

Post a new message
Dataseries X:
5393
5147
4846
3995
4491
4676
5461
4758
5302
5066
3491
4944
5148
5351
5178
4025
4449
4594
4603
4911
5236
4652
3479
4556
4815
4949
4499
3865
3657
4814
4614
4539
4492
4779
3193
3894
4531
4008
3764
3290
3644
3438
3833
3922
3524
3493
2814
3899
3653
3969
3427
3067
3301
3211
3382
3613
3783
3971
2842
4161


Summary of computational transaction
Raw Inputview raw input (R code)
Raw Outputview raw output of R engine
Computing time2 seconds
R Server'Herman Ole Andreas Wold' @ www.yougetit.org

\begin{tabular}{lllllllll}
\hline
Summary of computational transaction \tabularnewline
Raw Input & view raw input (R code)  \tabularnewline
Raw Output & view raw output of R engine  \tabularnewline
Computing time & 2 seconds \tabularnewline
R Server & 'Herman Ole Andreas Wold' @ www.yougetit.org \tabularnewline
\hline
\end{tabular}
%Source: https://freestatistics.org/blog/index.php?pk=118077&T=0

[TABLE]
[ROW][C]Summary of computational transaction[/C][/ROW]
[ROW][C]Raw Input[/C][C]view raw input (R code) [/C][/ROW]
[ROW][C]Raw Output[/C][C]view raw output of R engine [/C][/ROW]
[ROW][C]Computing time[/C][C]2 seconds[/C][/ROW]
[ROW][C]R Server[/C][C]'Herman Ole Andreas Wold' @ www.yougetit.org[/C][/ROW]
[/TABLE]
Source: https://freestatistics.org/blog/index.php?pk=118077&T=0

Globally Unique Identifier (entire table): ba.freestatistics.org/blog/index.php?pk=118077&T=0

As an alternative you can also use a QR Code:  

The GUIDs for individual cells are displayed in the table below:

Summary of computational transaction
Raw Inputview raw input (R code)
Raw Outputview raw output of R engine
Computing time2 seconds
R Server'Herman Ole Andreas Wold' @ www.yougetit.org


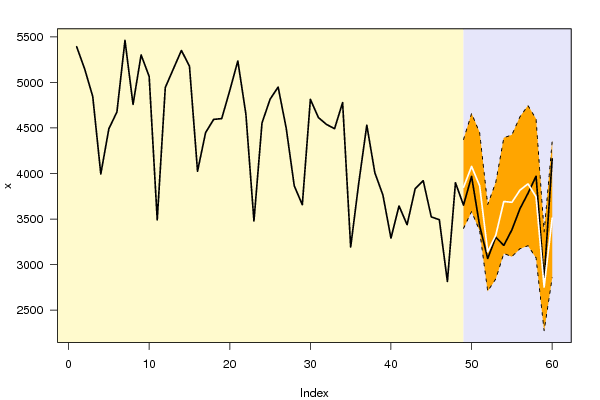
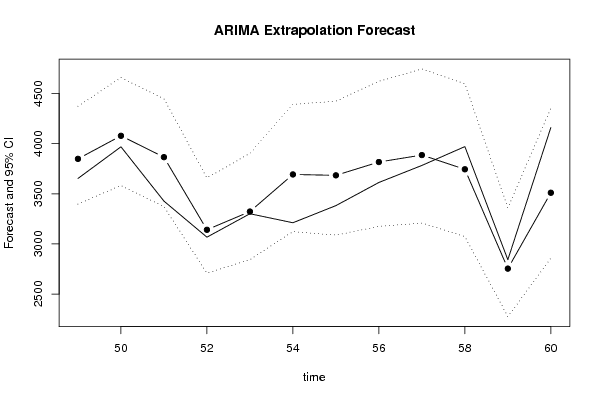
Univariate ARIMA Extrapolation Forecast
timeY[t]F[t]95% LB95% UBp-value(H0: Y[t] = F[t])P(F[t]>Y[t-1])P(F[t]>Y[t-s])P(F[t]>Y[48])
363894-------
374531-------
384008-------
393764-------
403290-------
413644-------
423438-------
433833-------
443922-------
453524-------
463493-------
472814-------
483899-------
4936533848.5423397.65834373.16620.23250.42520.00540.4252
5039694078.64883582.45484659.6410.35570.92450.59420.7278
5134273865.71693371.84974448.97920.07020.36430.63380.4555
5230673140.89812708.49493658.8410.38990.13950.28630.0021
5333013322.73512842.93493903.05980.47070.80610.1390.0258
5432113693.13613123.15974392.60450.08830.86410.76270.282
5533823684.07783087.70074424.15760.21190.89490.34660.2846
5636133817.14693174.40134622.55780.30970.85520.39930.4211
5737833886.69243207.5064745.97490.40650.73380.7960.4888
5839713744.73343074.18994598.66760.30180.4650.71830.3616
5928422753.26172273.91073359.12840.38700.42211e-04
6041613510.48442855.97044353.49830.06520.93990.18320.1832

\begin{tabular}{lllllllll}
\hline
Univariate ARIMA Extrapolation Forecast \tabularnewline
time & Y[t] & F[t] & 95% LB & 95% UB & p-value(H0: Y[t] = F[t]) & P(F[t]>Y[t-1]) & P(F[t]>Y[t-s]) & P(F[t]>Y[48]) \tabularnewline
36 & 3894 & - & - & - & - & - & - & - \tabularnewline
37 & 4531 & - & - & - & - & - & - & - \tabularnewline
38 & 4008 & - & - & - & - & - & - & - \tabularnewline
39 & 3764 & - & - & - & - & - & - & - \tabularnewline
40 & 3290 & - & - & - & - & - & - & - \tabularnewline
41 & 3644 & - & - & - & - & - & - & - \tabularnewline
42 & 3438 & - & - & - & - & - & - & - \tabularnewline
43 & 3833 & - & - & - & - & - & - & - \tabularnewline
44 & 3922 & - & - & - & - & - & - & - \tabularnewline
45 & 3524 & - & - & - & - & - & - & - \tabularnewline
46 & 3493 & - & - & - & - & - & - & - \tabularnewline
47 & 2814 & - & - & - & - & - & - & - \tabularnewline
48 & 3899 & - & - & - & - & - & - & - \tabularnewline
49 & 3653 & 3848.542 & 3397.6583 & 4373.1662 & 0.2325 & 0.4252 & 0.0054 & 0.4252 \tabularnewline
50 & 3969 & 4078.6488 & 3582.4548 & 4659.641 & 0.3557 & 0.9245 & 0.5942 & 0.7278 \tabularnewline
51 & 3427 & 3865.7169 & 3371.8497 & 4448.9792 & 0.0702 & 0.3643 & 0.6338 & 0.4555 \tabularnewline
52 & 3067 & 3140.8981 & 2708.4949 & 3658.841 & 0.3899 & 0.1395 & 0.2863 & 0.0021 \tabularnewline
53 & 3301 & 3322.7351 & 2842.9349 & 3903.0598 & 0.4707 & 0.8061 & 0.139 & 0.0258 \tabularnewline
54 & 3211 & 3693.1361 & 3123.1597 & 4392.6045 & 0.0883 & 0.8641 & 0.7627 & 0.282 \tabularnewline
55 & 3382 & 3684.0778 & 3087.7007 & 4424.1576 & 0.2119 & 0.8949 & 0.3466 & 0.2846 \tabularnewline
56 & 3613 & 3817.1469 & 3174.4013 & 4622.5578 & 0.3097 & 0.8552 & 0.3993 & 0.4211 \tabularnewline
57 & 3783 & 3886.6924 & 3207.506 & 4745.9749 & 0.4065 & 0.7338 & 0.796 & 0.4888 \tabularnewline
58 & 3971 & 3744.7334 & 3074.1899 & 4598.6676 & 0.3018 & 0.465 & 0.7183 & 0.3616 \tabularnewline
59 & 2842 & 2753.2617 & 2273.9107 & 3359.1284 & 0.387 & 0 & 0.4221 & 1e-04 \tabularnewline
60 & 4161 & 3510.4844 & 2855.9704 & 4353.4983 & 0.0652 & 0.9399 & 0.1832 & 0.1832 \tabularnewline
\hline
\end{tabular}
%Source: https://freestatistics.org/blog/index.php?pk=118077&T=1

[TABLE]
[ROW][C]Univariate ARIMA Extrapolation Forecast[/C][/ROW]
[ROW][C]time[/C][C]Y[t][/C][C]F[t][/C][C]95% LB[/C][C]95% UB[/C][C]p-value(H0: Y[t] = F[t])[/C][C]P(F[t]>Y[t-1])[/C][C]P(F[t]>Y[t-s])[/C][C]P(F[t]>Y[48])[/C][/ROW]
[ROW][C]36[/C][C]3894[/C][C]-[/C][C]-[/C][C]-[/C][C]-[/C][C]-[/C][C]-[/C][C]-[/C][/ROW]
[ROW][C]37[/C][C]4531[/C][C]-[/C][C]-[/C][C]-[/C][C]-[/C][C]-[/C][C]-[/C][C]-[/C][/ROW]
[ROW][C]38[/C][C]4008[/C][C]-[/C][C]-[/C][C]-[/C][C]-[/C][C]-[/C][C]-[/C][C]-[/C][/ROW]
[ROW][C]39[/C][C]3764[/C][C]-[/C][C]-[/C][C]-[/C][C]-[/C][C]-[/C][C]-[/C][C]-[/C][/ROW]
[ROW][C]40[/C][C]3290[/C][C]-[/C][C]-[/C][C]-[/C][C]-[/C][C]-[/C][C]-[/C][C]-[/C][/ROW]
[ROW][C]41[/C][C]3644[/C][C]-[/C][C]-[/C][C]-[/C][C]-[/C][C]-[/C][C]-[/C][C]-[/C][/ROW]
[ROW][C]42[/C][C]3438[/C][C]-[/C][C]-[/C][C]-[/C][C]-[/C][C]-[/C][C]-[/C][C]-[/C][/ROW]
[ROW][C]43[/C][C]3833[/C][C]-[/C][C]-[/C][C]-[/C][C]-[/C][C]-[/C][C]-[/C][C]-[/C][/ROW]
[ROW][C]44[/C][C]3922[/C][C]-[/C][C]-[/C][C]-[/C][C]-[/C][C]-[/C][C]-[/C][C]-[/C][/ROW]
[ROW][C]45[/C][C]3524[/C][C]-[/C][C]-[/C][C]-[/C][C]-[/C][C]-[/C][C]-[/C][C]-[/C][/ROW]
[ROW][C]46[/C][C]3493[/C][C]-[/C][C]-[/C][C]-[/C][C]-[/C][C]-[/C][C]-[/C][C]-[/C][/ROW]
[ROW][C]47[/C][C]2814[/C][C]-[/C][C]-[/C][C]-[/C][C]-[/C][C]-[/C][C]-[/C][C]-[/C][/ROW]
[ROW][C]48[/C][C]3899[/C][C]-[/C][C]-[/C][C]-[/C][C]-[/C][C]-[/C][C]-[/C][C]-[/C][/ROW]
[ROW][C]49[/C][C]3653[/C][C]3848.542[/C][C]3397.6583[/C][C]4373.1662[/C][C]0.2325[/C][C]0.4252[/C][C]0.0054[/C][C]0.4252[/C][/ROW]
[ROW][C]50[/C][C]3969[/C][C]4078.6488[/C][C]3582.4548[/C][C]4659.641[/C][C]0.3557[/C][C]0.9245[/C][C]0.5942[/C][C]0.7278[/C][/ROW]
[ROW][C]51[/C][C]3427[/C][C]3865.7169[/C][C]3371.8497[/C][C]4448.9792[/C][C]0.0702[/C][C]0.3643[/C][C]0.6338[/C][C]0.4555[/C][/ROW]
[ROW][C]52[/C][C]3067[/C][C]3140.8981[/C][C]2708.4949[/C][C]3658.841[/C][C]0.3899[/C][C]0.1395[/C][C]0.2863[/C][C]0.0021[/C][/ROW]
[ROW][C]53[/C][C]3301[/C][C]3322.7351[/C][C]2842.9349[/C][C]3903.0598[/C][C]0.4707[/C][C]0.8061[/C][C]0.139[/C][C]0.0258[/C][/ROW]
[ROW][C]54[/C][C]3211[/C][C]3693.1361[/C][C]3123.1597[/C][C]4392.6045[/C][C]0.0883[/C][C]0.8641[/C][C]0.7627[/C][C]0.282[/C][/ROW]
[ROW][C]55[/C][C]3382[/C][C]3684.0778[/C][C]3087.7007[/C][C]4424.1576[/C][C]0.2119[/C][C]0.8949[/C][C]0.3466[/C][C]0.2846[/C][/ROW]
[ROW][C]56[/C][C]3613[/C][C]3817.1469[/C][C]3174.4013[/C][C]4622.5578[/C][C]0.3097[/C][C]0.8552[/C][C]0.3993[/C][C]0.4211[/C][/ROW]
[ROW][C]57[/C][C]3783[/C][C]3886.6924[/C][C]3207.506[/C][C]4745.9749[/C][C]0.4065[/C][C]0.7338[/C][C]0.796[/C][C]0.4888[/C][/ROW]
[ROW][C]58[/C][C]3971[/C][C]3744.7334[/C][C]3074.1899[/C][C]4598.6676[/C][C]0.3018[/C][C]0.465[/C][C]0.7183[/C][C]0.3616[/C][/ROW]
[ROW][C]59[/C][C]2842[/C][C]2753.2617[/C][C]2273.9107[/C][C]3359.1284[/C][C]0.387[/C][C]0[/C][C]0.4221[/C][C]1e-04[/C][/ROW]
[ROW][C]60[/C][C]4161[/C][C]3510.4844[/C][C]2855.9704[/C][C]4353.4983[/C][C]0.0652[/C][C]0.9399[/C][C]0.1832[/C][C]0.1832[/C][/ROW]
[/TABLE]
Source: https://freestatistics.org/blog/index.php?pk=118077&T=1

Globally Unique Identifier (entire table): ba.freestatistics.org/blog/index.php?pk=118077&T=1

As an alternative you can also use a QR Code:  

The GUIDs for individual cells are displayed in the table below:

Univariate ARIMA Extrapolation Forecast
timeY[t]F[t]95% LB95% UBp-value(H0: Y[t] = F[t])P(F[t]>Y[t-1])P(F[t]>Y[t-s])P(F[t]>Y[48])
363894-------
374531-------
384008-------
393764-------
403290-------
413644-------
423438-------
433833-------
443922-------
453524-------
463493-------
472814-------
483899-------
4936533848.5423397.65834373.16620.23250.42520.00540.4252
5039694078.64883582.45484659.6410.35570.92450.59420.7278
5134273865.71693371.84974448.97920.07020.36430.63380.4555
5230673140.89812708.49493658.8410.38990.13950.28630.0021
5333013322.73512842.93493903.05980.47070.80610.1390.0258
5432113693.13613123.15974392.60450.08830.86410.76270.282
5533823684.07783087.70074424.15760.21190.89490.34660.2846
5636133817.14693174.40134622.55780.30970.85520.39930.4211
5737833886.69243207.5064745.97490.40650.73380.7960.4888
5839713744.73343074.18994598.66760.30180.4650.71830.3616
5928422753.26172273.91073359.12840.38700.42211e-04
6041613510.48442855.97044353.49830.06520.93990.18320.1832


Univariate ARIMA Extrapolation Forecast Performance
time% S.E.PEMAPESq.EMSERMSE
490.0695-0.0508038236.674300
500.0727-0.02690.038812022.855925129.7651158.5237
510.077-0.11350.0637192472.486880910.6723284.448
520.0841-0.02350.05375460.926862048.2359249.0948
530.0891-0.00650.0443472.415849733.0719223.0091
540.0966-0.13050.0586232455.243980186.7673283.1727
550.1025-0.0820.06291251.004181767.3725285.9499
560.1077-0.05350.060941675.967176755.9468277.0486
570.1128-0.02670.057110752.118469422.1881263.4809
580.11630.06040.057451196.580367599.6273259.9993
590.11230.03220.05517874.490162170.0694249.3393
600.12250.18530.066423170.583192253.4456303.7325

\begin{tabular}{lllllllll}
\hline
Univariate ARIMA Extrapolation Forecast Performance \tabularnewline
time & % S.E. & PE & MAPE & Sq.E & MSE & RMSE \tabularnewline
49 & 0.0695 & -0.0508 & 0 & 38236.6743 & 0 & 0 \tabularnewline
50 & 0.0727 & -0.0269 & 0.0388 & 12022.8559 & 25129.7651 & 158.5237 \tabularnewline
51 & 0.077 & -0.1135 & 0.0637 & 192472.4868 & 80910.6723 & 284.448 \tabularnewline
52 & 0.0841 & -0.0235 & 0.0537 & 5460.9268 & 62048.2359 & 249.0948 \tabularnewline
53 & 0.0891 & -0.0065 & 0.0443 & 472.4158 & 49733.0719 & 223.0091 \tabularnewline
54 & 0.0966 & -0.1305 & 0.0586 & 232455.2439 & 80186.7673 & 283.1727 \tabularnewline
55 & 0.1025 & -0.082 & 0.062 & 91251.0041 & 81767.3725 & 285.9499 \tabularnewline
56 & 0.1077 & -0.0535 & 0.0609 & 41675.9671 & 76755.9468 & 277.0486 \tabularnewline
57 & 0.1128 & -0.0267 & 0.0571 & 10752.1184 & 69422.1881 & 263.4809 \tabularnewline
58 & 0.1163 & 0.0604 & 0.0574 & 51196.5803 & 67599.6273 & 259.9993 \tabularnewline
59 & 0.1123 & 0.0322 & 0.0551 & 7874.4901 & 62170.0694 & 249.3393 \tabularnewline
60 & 0.1225 & 0.1853 & 0.066 & 423170.5831 & 92253.4456 & 303.7325 \tabularnewline
\hline
\end{tabular}
%Source: https://freestatistics.org/blog/index.php?pk=118077&T=2

[TABLE]
[ROW][C]Univariate ARIMA Extrapolation Forecast Performance[/C][/ROW]
[ROW][C]time[/C][C]% S.E.[/C][C]PE[/C][C]MAPE[/C][C]Sq.E[/C][C]MSE[/C][C]RMSE[/C][/ROW]
[ROW][C]49[/C][C]0.0695[/C][C]-0.0508[/C][C]0[/C][C]38236.6743[/C][C]0[/C][C]0[/C][/ROW]
[ROW][C]50[/C][C]0.0727[/C][C]-0.0269[/C][C]0.0388[/C][C]12022.8559[/C][C]25129.7651[/C][C]158.5237[/C][/ROW]
[ROW][C]51[/C][C]0.077[/C][C]-0.1135[/C][C]0.0637[/C][C]192472.4868[/C][C]80910.6723[/C][C]284.448[/C][/ROW]
[ROW][C]52[/C][C]0.0841[/C][C]-0.0235[/C][C]0.0537[/C][C]5460.9268[/C][C]62048.2359[/C][C]249.0948[/C][/ROW]
[ROW][C]53[/C][C]0.0891[/C][C]-0.0065[/C][C]0.0443[/C][C]472.4158[/C][C]49733.0719[/C][C]223.0091[/C][/ROW]
[ROW][C]54[/C][C]0.0966[/C][C]-0.1305[/C][C]0.0586[/C][C]232455.2439[/C][C]80186.7673[/C][C]283.1727[/C][/ROW]
[ROW][C]55[/C][C]0.1025[/C][C]-0.082[/C][C]0.062[/C][C]91251.0041[/C][C]81767.3725[/C][C]285.9499[/C][/ROW]
[ROW][C]56[/C][C]0.1077[/C][C]-0.0535[/C][C]0.0609[/C][C]41675.9671[/C][C]76755.9468[/C][C]277.0486[/C][/ROW]
[ROW][C]57[/C][C]0.1128[/C][C]-0.0267[/C][C]0.0571[/C][C]10752.1184[/C][C]69422.1881[/C][C]263.4809[/C][/ROW]
[ROW][C]58[/C][C]0.1163[/C][C]0.0604[/C][C]0.0574[/C][C]51196.5803[/C][C]67599.6273[/C][C]259.9993[/C][/ROW]
[ROW][C]59[/C][C]0.1123[/C][C]0.0322[/C][C]0.0551[/C][C]7874.4901[/C][C]62170.0694[/C][C]249.3393[/C][/ROW]
[ROW][C]60[/C][C]0.1225[/C][C]0.1853[/C][C]0.066[/C][C]423170.5831[/C][C]92253.4456[/C][C]303.7325[/C][/ROW]
[/TABLE]
Source: https://freestatistics.org/blog/index.php?pk=118077&T=2

Globally Unique Identifier (entire table): ba.freestatistics.org/blog/index.php?pk=118077&T=2

As an alternative you can also use a QR Code:  

The GUIDs for individual cells are displayed in the table below:

Univariate ARIMA Extrapolation Forecast Performance
time% S.E.PEMAPESq.EMSERMSE
490.0695-0.0508038236.674300
500.0727-0.02690.038812022.855925129.7651158.5237
510.077-0.11350.0637192472.486880910.6723284.448
520.0841-0.02350.05375460.926862048.2359249.0948
530.0891-0.00650.0443472.415849733.0719223.0091
540.0966-0.13050.0586232455.243980186.7673283.1727
550.1025-0.0820.06291251.004181767.3725285.9499
560.1077-0.05350.060941675.967176755.9468277.0486
570.1128-0.02670.057110752.118469422.1881263.4809
580.11630.06040.057451196.580367599.6273259.9993
590.11230.03220.05517874.490162170.0694249.3393
600.12250.18530.066423170.583192253.4456303.7325


Parameters (Session):
par1 = 12 ; par2 = -0.2 ; par3 = 0 ; par4 = 1 ; par5 = 12 ; par6 = 3 ; par7 = 0 ; par8 = 2 ; par9 = 0 ; par10 = FALSE ;
Parameters (R input):
par1 = 12 ; par2 = -0.2 ; par3 = 0 ; par4 = 1 ; par5 = 12 ; par6 = 3 ; par7 = 0 ; par8 = 2 ; par9 = 0 ; par10 = FALSE ;
R code (references can be found in the software module):
par1 <- as.numeric(par1) #cut off periods
par2 <- as.numeric(par2) #lambda
par3 <- as.numeric(par3) #degree of non-seasonal differencing
par4 <- as.numeric(par4) #degree of seasonal differencing
par5 <- as.numeric(par5) #seasonal period
par6 <- as.numeric(par6) #p
par7 <- as.numeric(par7) #q
par8 <- as.numeric(par8) #P
par9 <- as.numeric(par9) #Q
if (par10 == 'TRUE') par10 <- TRUE
if (par10 == 'FALSE') par10 <- FALSE
if (par2 == 0) x <- log(x)
if (par2 != 0) x <- x^par2
lx <- length(x)
first <- lx - 2*par1
nx <- lx - par1
nx1 <- nx + 1
fx <- lx - nx
if (fx < 1) {
fx <- par5
nx1 <- lx + fx - 1
first <- lx - 2*fx
}
first <- 1
if (fx < 3) fx <- round(lx/10,0)
(arima.out <- arima(x[1:nx], order=c(par6,par3,par7), seasonal=list(order=c(par8,par4,par9), period=par5), include.mean=par10, method='ML'))
(forecast <- predict(arima.out,par1))
(lb <- forecast$pred - 1.96 * forecast$se)
(ub <- forecast$pred + 1.96 * forecast$se)
if (par2 == 0) {
x <- exp(x)
forecast$pred <- exp(forecast$pred)
lb <- exp(lb)
ub <- exp(ub)
}
if (par2 != 0) {
x <- x^(1/par2)
forecast$pred <- forecast$pred^(1/par2)
lb <- lb^(1/par2)
ub <- ub^(1/par2)
}
if (par2 < 0) {
olb <- lb
lb <- ub
ub <- olb
}
(actandfor <- c(x[1:nx], forecast$pred))
(perc.se <- (ub-forecast$pred)/1.96/forecast$pred)
bitmap(file='test1.png')
opar <- par(mar=c(4,4,2,2),las=1)
ylim <- c( min(x[first:nx],lb), max(x[first:nx],ub))
plot(x,ylim=ylim,type='n',xlim=c(first,lx))
usr <- par('usr')
rect(usr[1],usr[3],nx+1,usr[4],border=NA,col='lemonchiffon')
rect(nx1,usr[3],usr[2],usr[4],border=NA,col='lavender')
abline(h= (-3:3)*2 , col ='gray', lty =3)
polygon( c(nx1:lx,lx:nx1), c(lb,rev(ub)), col = 'orange', lty=2,border=NA)
lines(nx1:lx, lb , lty=2)
lines(nx1:lx, ub , lty=2)
lines(x, lwd=2)
lines(nx1:lx, forecast$pred , lwd=2 , col ='white')
box()
par(opar)
dev.off()
prob.dec <- array(NA, dim=fx)
prob.sdec <- array(NA, dim=fx)
prob.ldec <- array(NA, dim=fx)
prob.pval <- array(NA, dim=fx)
perf.pe <- array(0, dim=fx)
perf.mape <- array(0, dim=fx)
perf.mape1 <- array(0, dim=fx)
perf.se <- array(0, dim=fx)
perf.mse <- array(0, dim=fx)
perf.mse1 <- array(0, dim=fx)
perf.rmse <- array(0, dim=fx)
for (i in 1:fx) {
locSD <- (ub[i] - forecast$pred[i]) / 1.96
perf.pe[i] = (x[nx+i] - forecast$pred[i]) / forecast$pred[i]
perf.se[i] = (x[nx+i] - forecast$pred[i])^2
prob.dec[i] = pnorm((x[nx+i-1] - forecast$pred[i]) / locSD)
prob.sdec[i] = pnorm((x[nx+i-par5] - forecast$pred[i]) / locSD)
prob.ldec[i] = pnorm((x[nx] - forecast$pred[i]) / locSD)
prob.pval[i] = pnorm(abs(x[nx+i] - forecast$pred[i]) / locSD)
}
perf.mape[1] = abs(perf.pe[1])
perf.mse[1] = abs(perf.se[1])
for (i in 2:fx) {
perf.mape[i] = perf.mape[i-1] + abs(perf.pe[i])
perf.mape1[i] = perf.mape[i] / i
perf.mse[i] = perf.mse[i-1] + perf.se[i]
perf.mse1[i] = perf.mse[i] / i
}
perf.rmse = sqrt(perf.mse1)
bitmap(file='test2.png')
plot(forecast$pred, pch=19, type='b',main='ARIMA Extrapolation Forecast', ylab='Forecast and 95% CI', xlab='time',ylim=c(min(lb),max(ub)))
dum <- forecast$pred
dum[1:par1] <- x[(nx+1):lx]
lines(dum, lty=1)
lines(ub,lty=3)
lines(lb,lty=3)
dev.off()
load(file='createtable')
a<-table.start()
a<-table.row.start(a)
a<-table.element(a,'Univariate ARIMA Extrapolation Forecast',9,TRUE)
a<-table.row.end(a)
a<-table.row.start(a)
a<-table.element(a,'time',1,header=TRUE)
a<-table.element(a,'Y[t]',1,header=TRUE)
a<-table.element(a,'F[t]',1,header=TRUE)
a<-table.element(a,'95% LB',1,header=TRUE)
a<-table.element(a,'95% UB',1,header=TRUE)
a<-table.element(a,'p-value
(H0: Y[t] = F[t])',1,header=TRUE)
a<-table.element(a,'P(F[t]>Y[t-1])',1,header=TRUE)
a<-table.element(a,'P(F[t]>Y[t-s])',1,header=TRUE)
mylab <- paste('P(F[t]>Y[',nx,sep='')
mylab <- paste(mylab,'])',sep='')
a<-table.element(a,mylab,1,header=TRUE)
a<-table.row.end(a)
for (i in (nx-par5):nx) {
a<-table.row.start(a)
a<-table.element(a,i,header=TRUE)
a<-table.element(a,x[i])
a<-table.element(a,'-')
a<-table.row.end(a)
}
for (i in 1:fx) {
a<-table.row.start(a)
a<-table.element(a,nx+i,header=TRUE)
a<-table.element(a,round(x[nx+i],4))
a<-table.element(a,round(forecast$pred[i],4))
a<-table.element(a,round(lb[i],4))
a<-table.element(a,round(ub[i],4))
a<-table.element(a,round((1-prob.pval[i]),4))
a<-table.element(a,round((1-prob.dec[i]),4))
a<-table.element(a,round((1-prob.sdec[i]),4))
a<-table.element(a,round((1-prob.ldec[i]),4))
a<-table.row.end(a)
}
a<-table.end(a)
table.save(a,file='mytable.tab')
a<-table.start()
a<-table.row.start(a)
a<-table.element(a,'Univariate ARIMA Extrapolation Forecast Performance',7,TRUE)
a<-table.row.end(a)
a<-table.row.start(a)
a<-table.element(a,'time',1,header=TRUE)
a<-table.element(a,'% S.E.',1,header=TRUE)
a<-table.element(a,'PE',1,header=TRUE)
a<-table.element(a,'MAPE',1,header=TRUE)
a<-table.element(a,'Sq.E',1,header=TRUE)
a<-table.element(a,'MSE',1,header=TRUE)
a<-table.element(a,'RMSE',1,header=TRUE)
a<-table.row.end(a)
for (i in 1:fx) {
a<-table.row.start(a)
a<-table.element(a,nx+i,header=TRUE)
a<-table.element(a,round(perc.se[i],4))
a<-table.element(a,round(perf.pe[i],4))
a<-table.element(a,round(perf.mape1[i],4))
a<-table.element(a,round(perf.se[i],4))
a<-table.element(a,round(perf.mse1[i],4))
a<-table.element(a,round(perf.rmse[i],4))
a<-table.row.end(a)
}
a<-table.end(a)
table.save(a,file='mytable1.tab')