Free Statistics

of Irreproducible Research!

Author's title

Author*The author of this computation has been verified*
R Software Modulerwasp_autocorrelation.wasp
Title produced by software(Partial) Autocorrelation Function
Date of computationWed, 02 Feb 2011 18:09:13 +0000
Cite this page as followsStatistical Computations at FreeStatistics.org, Office for Research Development and Education, URL https://freestatistics.org/blog/index.php?v=date/2011/Feb/02/t1296670100eu04tihzyhifoyd.htm/, Retrieved Sun, 19 May 2024 18:19:50 +0000
Statistical Computations at FreeStatistics.org, Office for Research Development and Education, URL https://freestatistics.org/blog/index.php?pk=118032, Retrieved Sun, 19 May 2024 18:19:50 +0000
QR Codes:

Original text written by user:
IsPrivate?No (this computation is public)
User-defined keywords
Estimated Impact251
Family? (F = Feedback message, R = changed R code, M = changed R Module, P = changed Parameters, D = changed Data)
-       [(Partial) Autocorrelation Function] [] [2011-02-02 18:09:13] [ff423994c38282a6d306f7d0147a5924] [Current]
Feedback Forum

Post a new message
Dataseries X:
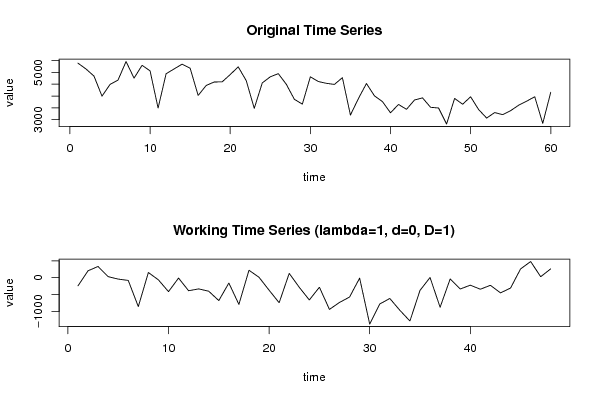
5393
5147
4846
3995
4491
4676
5461
4758
5302
5066
3491
4944
5148
5351
5178
4025
4449
4594
4603
4911
5236
4652
3479
4556
4815
4949
4499
3865
3657
4814
4614
4539
4492
4779
3193
3894
4531
4008
3764
3290
3644
3438
3833
3922
3524
3493
2814
3899
3653
3969
3427
3067
3301
3211
3382
3613
3783
3971
2842
4161


Summary of computational transaction
Raw Inputview raw input (R code)
Raw Outputview raw output of R engine
Computing time1 seconds
R Server'Gwilym Jenkins' @ www.wessa.org

\begin{tabular}{lllllllll}
\hline
Summary of computational transaction \tabularnewline
Raw Input & view raw input (R code)  \tabularnewline
Raw Output & view raw output of R engine  \tabularnewline
Computing time & 1 seconds \tabularnewline
R Server & 'Gwilym Jenkins' @ www.wessa.org \tabularnewline
\hline
\end{tabular}
%Source: https://freestatistics.org/blog/index.php?pk=118032&T=0

[TABLE]
[ROW][C]Summary of computational transaction[/C][/ROW]
[ROW][C]Raw Input[/C][C]view raw input (R code) [/C][/ROW]
[ROW][C]Raw Output[/C][C]view raw output of R engine [/C][/ROW]
[ROW][C]Computing time[/C][C]1 seconds[/C][/ROW]
[ROW][C]R Server[/C][C]'Gwilym Jenkins' @ www.wessa.org[/C][/ROW]
[/TABLE]
Source: https://freestatistics.org/blog/index.php?pk=118032&T=0

Globally Unique Identifier (entire table): ba.freestatistics.org/blog/index.php?pk=118032&T=0

As an alternative you can also use a QR Code:  

The GUIDs for individual cells are displayed in the table below:

Summary of computational transaction
Raw Inputview raw input (R code)
Raw Outputview raw output of R engine
Computing time1 seconds
R Server'Gwilym Jenkins' @ www.wessa.org


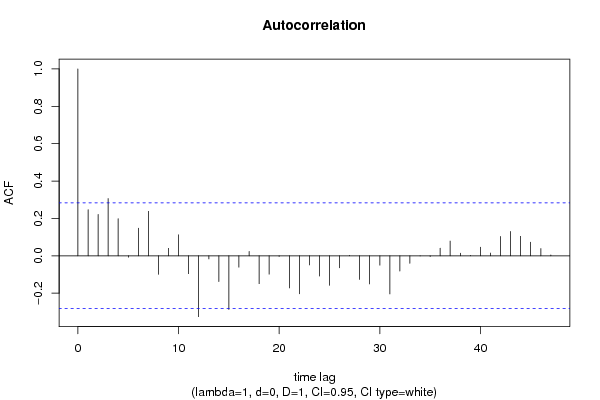
Autocorrelation Function
Time lag kACF(k)T-STATP-value
10.2470041.71130.046741
20.2212941.53320.065899
30.3067192.1250.01938
40.198471.3750.087752
5-0.007509-0.0520.479362
60.1477371.02360.155589
70.2384981.65240.052494
8-0.099156-0.6870.247703
90.0400990.27780.391174
100.1123620.77850.220057
11-0.095413-0.6610.255873
12-0.325459-2.25480.014371
13-0.016533-0.11450.454642
14-0.137812-0.95480.172234
15-0.287086-1.9890.026209
16-0.060612-0.41990.338204
170.0232210.16090.436432
18-0.148824-1.03110.153835
19-0.098355-0.68140.24944
20-0.003429-0.02380.490573
21-0.171582-1.18880.120192
22-0.203363-1.40890.082649
23-0.049046-0.33980.367744
24-0.108297-0.75030.228367
25-0.15748-1.09110.140348
26-0.06383-0.44220.330156
270.0022930.01590.493696
28-0.126518-0.87650.192551
29-0.150334-1.04150.151421
30-0.050124-0.34730.364952
31-0.203868-1.41240.082136
32-0.081445-0.56430.287599
33-0.039982-0.2770.391483
34-0.000449-0.00310.498765
35-0.004204-0.02910.488443
360.0409540.28370.388915
370.0788250.54610.293757
380.0139440.09660.461721
390.0020970.01450.494235
400.0464050.32150.374612
410.0150370.10420.458731
420.1040620.7210.237215
430.1303470.90310.185499
440.1047230.72550.235822
450.0728630.50480.308001
460.0388280.2690.394538
470.0049280.03410.486452
48NANANA
49NANANA
50NANANA
51NANANA
52NANANA
53NANANA
54NANANA
55NANANA
56NANANA
57NANANA
58NANANA
59NANANA
60NANANA

\begin{tabular}{lllllllll}
\hline
Autocorrelation Function \tabularnewline
Time lag k & ACF(k) & T-STAT & P-value \tabularnewline
1 & 0.247004 & 1.7113 & 0.046741 \tabularnewline
2 & 0.221294 & 1.5332 & 0.065899 \tabularnewline
3 & 0.306719 & 2.125 & 0.01938 \tabularnewline
4 & 0.19847 & 1.375 & 0.087752 \tabularnewline
5 & -0.007509 & -0.052 & 0.479362 \tabularnewline
6 & 0.147737 & 1.0236 & 0.155589 \tabularnewline
7 & 0.238498 & 1.6524 & 0.052494 \tabularnewline
8 & -0.099156 & -0.687 & 0.247703 \tabularnewline
9 & 0.040099 & 0.2778 & 0.391174 \tabularnewline
10 & 0.112362 & 0.7785 & 0.220057 \tabularnewline
11 & -0.095413 & -0.661 & 0.255873 \tabularnewline
12 & -0.325459 & -2.2548 & 0.014371 \tabularnewline
13 & -0.016533 & -0.1145 & 0.454642 \tabularnewline
14 & -0.137812 & -0.9548 & 0.172234 \tabularnewline
15 & -0.287086 & -1.989 & 0.026209 \tabularnewline
16 & -0.060612 & -0.4199 & 0.338204 \tabularnewline
17 & 0.023221 & 0.1609 & 0.436432 \tabularnewline
18 & -0.148824 & -1.0311 & 0.153835 \tabularnewline
19 & -0.098355 & -0.6814 & 0.24944 \tabularnewline
20 & -0.003429 & -0.0238 & 0.490573 \tabularnewline
21 & -0.171582 & -1.1888 & 0.120192 \tabularnewline
22 & -0.203363 & -1.4089 & 0.082649 \tabularnewline
23 & -0.049046 & -0.3398 & 0.367744 \tabularnewline
24 & -0.108297 & -0.7503 & 0.228367 \tabularnewline
25 & -0.15748 & -1.0911 & 0.140348 \tabularnewline
26 & -0.06383 & -0.4422 & 0.330156 \tabularnewline
27 & 0.002293 & 0.0159 & 0.493696 \tabularnewline
28 & -0.126518 & -0.8765 & 0.192551 \tabularnewline
29 & -0.150334 & -1.0415 & 0.151421 \tabularnewline
30 & -0.050124 & -0.3473 & 0.364952 \tabularnewline
31 & -0.203868 & -1.4124 & 0.082136 \tabularnewline
32 & -0.081445 & -0.5643 & 0.287599 \tabularnewline
33 & -0.039982 & -0.277 & 0.391483 \tabularnewline
34 & -0.000449 & -0.0031 & 0.498765 \tabularnewline
35 & -0.004204 & -0.0291 & 0.488443 \tabularnewline
36 & 0.040954 & 0.2837 & 0.388915 \tabularnewline
37 & 0.078825 & 0.5461 & 0.293757 \tabularnewline
38 & 0.013944 & 0.0966 & 0.461721 \tabularnewline
39 & 0.002097 & 0.0145 & 0.494235 \tabularnewline
40 & 0.046405 & 0.3215 & 0.374612 \tabularnewline
41 & 0.015037 & 0.1042 & 0.458731 \tabularnewline
42 & 0.104062 & 0.721 & 0.237215 \tabularnewline
43 & 0.130347 & 0.9031 & 0.185499 \tabularnewline
44 & 0.104723 & 0.7255 & 0.235822 \tabularnewline
45 & 0.072863 & 0.5048 & 0.308001 \tabularnewline
46 & 0.038828 & 0.269 & 0.394538 \tabularnewline
47 & 0.004928 & 0.0341 & 0.486452 \tabularnewline
48 & NA & NA & NA \tabularnewline
49 & NA & NA & NA \tabularnewline
50 & NA & NA & NA \tabularnewline
51 & NA & NA & NA \tabularnewline
52 & NA & NA & NA \tabularnewline
53 & NA & NA & NA \tabularnewline
54 & NA & NA & NA \tabularnewline
55 & NA & NA & NA \tabularnewline
56 & NA & NA & NA \tabularnewline
57 & NA & NA & NA \tabularnewline
58 & NA & NA & NA \tabularnewline
59 & NA & NA & NA \tabularnewline
60 & NA & NA & NA \tabularnewline
\hline
\end{tabular}
%Source: https://freestatistics.org/blog/index.php?pk=118032&T=1

[TABLE]
[ROW][C]Autocorrelation Function[/C][/ROW]
[ROW][C]Time lag k[/C][C]ACF(k)[/C][C]T-STAT[/C][C]P-value[/C][/ROW]
[ROW][C]1[/C][C]0.247004[/C][C]1.7113[/C][C]0.046741[/C][/ROW]
[ROW][C]2[/C][C]0.221294[/C][C]1.5332[/C][C]0.065899[/C][/ROW]
[ROW][C]3[/C][C]0.306719[/C][C]2.125[/C][C]0.01938[/C][/ROW]
[ROW][C]4[/C][C]0.19847[/C][C]1.375[/C][C]0.087752[/C][/ROW]
[ROW][C]5[/C][C]-0.007509[/C][C]-0.052[/C][C]0.479362[/C][/ROW]
[ROW][C]6[/C][C]0.147737[/C][C]1.0236[/C][C]0.155589[/C][/ROW]
[ROW][C]7[/C][C]0.238498[/C][C]1.6524[/C][C]0.052494[/C][/ROW]
[ROW][C]8[/C][C]-0.099156[/C][C]-0.687[/C][C]0.247703[/C][/ROW]
[ROW][C]9[/C][C]0.040099[/C][C]0.2778[/C][C]0.391174[/C][/ROW]
[ROW][C]10[/C][C]0.112362[/C][C]0.7785[/C][C]0.220057[/C][/ROW]
[ROW][C]11[/C][C]-0.095413[/C][C]-0.661[/C][C]0.255873[/C][/ROW]
[ROW][C]12[/C][C]-0.325459[/C][C]-2.2548[/C][C]0.014371[/C][/ROW]
[ROW][C]13[/C][C]-0.016533[/C][C]-0.1145[/C][C]0.454642[/C][/ROW]
[ROW][C]14[/C][C]-0.137812[/C][C]-0.9548[/C][C]0.172234[/C][/ROW]
[ROW][C]15[/C][C]-0.287086[/C][C]-1.989[/C][C]0.026209[/C][/ROW]
[ROW][C]16[/C][C]-0.060612[/C][C]-0.4199[/C][C]0.338204[/C][/ROW]
[ROW][C]17[/C][C]0.023221[/C][C]0.1609[/C][C]0.436432[/C][/ROW]
[ROW][C]18[/C][C]-0.148824[/C][C]-1.0311[/C][C]0.153835[/C][/ROW]
[ROW][C]19[/C][C]-0.098355[/C][C]-0.6814[/C][C]0.24944[/C][/ROW]
[ROW][C]20[/C][C]-0.003429[/C][C]-0.0238[/C][C]0.490573[/C][/ROW]
[ROW][C]21[/C][C]-0.171582[/C][C]-1.1888[/C][C]0.120192[/C][/ROW]
[ROW][C]22[/C][C]-0.203363[/C][C]-1.4089[/C][C]0.082649[/C][/ROW]
[ROW][C]23[/C][C]-0.049046[/C][C]-0.3398[/C][C]0.367744[/C][/ROW]
[ROW][C]24[/C][C]-0.108297[/C][C]-0.7503[/C][C]0.228367[/C][/ROW]
[ROW][C]25[/C][C]-0.15748[/C][C]-1.0911[/C][C]0.140348[/C][/ROW]
[ROW][C]26[/C][C]-0.06383[/C][C]-0.4422[/C][C]0.330156[/C][/ROW]
[ROW][C]27[/C][C]0.002293[/C][C]0.0159[/C][C]0.493696[/C][/ROW]
[ROW][C]28[/C][C]-0.126518[/C][C]-0.8765[/C][C]0.192551[/C][/ROW]
[ROW][C]29[/C][C]-0.150334[/C][C]-1.0415[/C][C]0.151421[/C][/ROW]
[ROW][C]30[/C][C]-0.050124[/C][C]-0.3473[/C][C]0.364952[/C][/ROW]
[ROW][C]31[/C][C]-0.203868[/C][C]-1.4124[/C][C]0.082136[/C][/ROW]
[ROW][C]32[/C][C]-0.081445[/C][C]-0.5643[/C][C]0.287599[/C][/ROW]
[ROW][C]33[/C][C]-0.039982[/C][C]-0.277[/C][C]0.391483[/C][/ROW]
[ROW][C]34[/C][C]-0.000449[/C][C]-0.0031[/C][C]0.498765[/C][/ROW]
[ROW][C]35[/C][C]-0.004204[/C][C]-0.0291[/C][C]0.488443[/C][/ROW]
[ROW][C]36[/C][C]0.040954[/C][C]0.2837[/C][C]0.388915[/C][/ROW]
[ROW][C]37[/C][C]0.078825[/C][C]0.5461[/C][C]0.293757[/C][/ROW]
[ROW][C]38[/C][C]0.013944[/C][C]0.0966[/C][C]0.461721[/C][/ROW]
[ROW][C]39[/C][C]0.002097[/C][C]0.0145[/C][C]0.494235[/C][/ROW]
[ROW][C]40[/C][C]0.046405[/C][C]0.3215[/C][C]0.374612[/C][/ROW]
[ROW][C]41[/C][C]0.015037[/C][C]0.1042[/C][C]0.458731[/C][/ROW]
[ROW][C]42[/C][C]0.104062[/C][C]0.721[/C][C]0.237215[/C][/ROW]
[ROW][C]43[/C][C]0.130347[/C][C]0.9031[/C][C]0.185499[/C][/ROW]
[ROW][C]44[/C][C]0.104723[/C][C]0.7255[/C][C]0.235822[/C][/ROW]
[ROW][C]45[/C][C]0.072863[/C][C]0.5048[/C][C]0.308001[/C][/ROW]
[ROW][C]46[/C][C]0.038828[/C][C]0.269[/C][C]0.394538[/C][/ROW]
[ROW][C]47[/C][C]0.004928[/C][C]0.0341[/C][C]0.486452[/C][/ROW]
[ROW][C]48[/C][C]NA[/C][C]NA[/C][C]NA[/C][/ROW]
[ROW][C]49[/C][C]NA[/C][C]NA[/C][C]NA[/C][/ROW]
[ROW][C]50[/C][C]NA[/C][C]NA[/C][C]NA[/C][/ROW]
[ROW][C]51[/C][C]NA[/C][C]NA[/C][C]NA[/C][/ROW]
[ROW][C]52[/C][C]NA[/C][C]NA[/C][C]NA[/C][/ROW]
[ROW][C]53[/C][C]NA[/C][C]NA[/C][C]NA[/C][/ROW]
[ROW][C]54[/C][C]NA[/C][C]NA[/C][C]NA[/C][/ROW]
[ROW][C]55[/C][C]NA[/C][C]NA[/C][C]NA[/C][/ROW]
[ROW][C]56[/C][C]NA[/C][C]NA[/C][C]NA[/C][/ROW]
[ROW][C]57[/C][C]NA[/C][C]NA[/C][C]NA[/C][/ROW]
[ROW][C]58[/C][C]NA[/C][C]NA[/C][C]NA[/C][/ROW]
[ROW][C]59[/C][C]NA[/C][C]NA[/C][C]NA[/C][/ROW]
[ROW][C]60[/C][C]NA[/C][C]NA[/C][C]NA[/C][/ROW]
[/TABLE]
Source: https://freestatistics.org/blog/index.php?pk=118032&T=1

Globally Unique Identifier (entire table): ba.freestatistics.org/blog/index.php?pk=118032&T=1

As an alternative you can also use a QR Code:  

The GUIDs for individual cells are displayed in the table below:

Autocorrelation Function
Time lag kACF(k)T-STATP-value
10.2470041.71130.046741
20.2212941.53320.065899
30.3067192.1250.01938
40.198471.3750.087752
5-0.007509-0.0520.479362
60.1477371.02360.155589
70.2384981.65240.052494
8-0.099156-0.6870.247703
90.0400990.27780.391174
100.1123620.77850.220057
11-0.095413-0.6610.255873
12-0.325459-2.25480.014371
13-0.016533-0.11450.454642
14-0.137812-0.95480.172234
15-0.287086-1.9890.026209
16-0.060612-0.41990.338204
170.0232210.16090.436432
18-0.148824-1.03110.153835
19-0.098355-0.68140.24944
20-0.003429-0.02380.490573
21-0.171582-1.18880.120192
22-0.203363-1.40890.082649
23-0.049046-0.33980.367744
24-0.108297-0.75030.228367
25-0.15748-1.09110.140348
26-0.06383-0.44220.330156
270.0022930.01590.493696
28-0.126518-0.87650.192551
29-0.150334-1.04150.151421
30-0.050124-0.34730.364952
31-0.203868-1.41240.082136
32-0.081445-0.56430.287599
33-0.039982-0.2770.391483
34-0.000449-0.00310.498765
35-0.004204-0.02910.488443
360.0409540.28370.388915
370.0788250.54610.293757
380.0139440.09660.461721
390.0020970.01450.494235
400.0464050.32150.374612
410.0150370.10420.458731
420.1040620.7210.237215
430.1303470.90310.185499
440.1047230.72550.235822
450.0728630.50480.308001
460.0388280.2690.394538
470.0049280.03410.486452
48NANANA
49NANANA
50NANANA
51NANANA
52NANANA
53NANANA
54NANANA
55NANANA
56NANANA
57NANANA
58NANANA
59NANANA
60NANANA


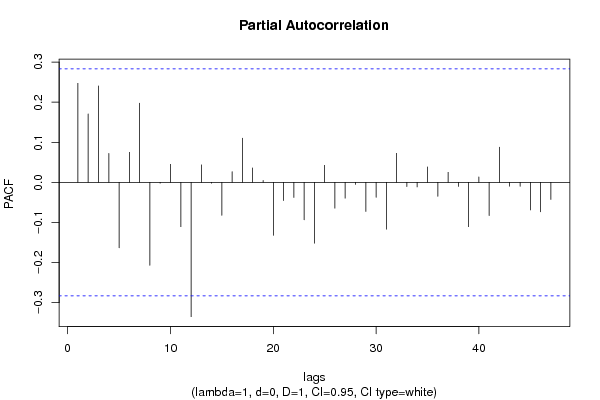
Partial Autocorrelation Function
Time lag kPACF(k)T-STATP-value
10.2470041.71130.046741
20.1706981.18260.121391
30.2404771.66610.051106
40.0721370.49980.309757
5-0.163328-1.13160.131719
60.07510.52030.302621
70.1974071.36770.088892
8-0.206761-1.43250.079243
9-0.001978-0.01370.494563
100.0450850.31240.378062
11-0.110506-0.76560.22383
12-0.334957-2.32070.012301
130.0436350.30230.381861
14-0.00219-0.01520.493979
15-0.082133-0.5690.285993
160.0265830.18420.427328
170.1102320.76370.224389
180.0361310.25030.401703
190.0047310.03280.486995
20-0.132173-0.91570.182195
21-0.045486-0.31510.377013
22-0.037501-0.25980.39806
23-0.093444-0.64740.260228
24-0.151631-1.05050.149367
250.0426050.29520.384567
26-0.064351-0.44580.328859
27-0.039339-0.27250.393185
28-0.005171-0.03580.485784
29-0.072523-0.50250.308824
30-0.037192-0.25770.398881
31-0.116859-0.80960.211077
320.0725230.50250.308822
33-0.010336-0.07160.471604
34-0.011465-0.07940.468511
350.0386080.26750.395122
36-0.034913-0.24190.40495
370.0252090.17470.431043
38-0.010285-0.07130.471745
39-0.110666-0.76670.223502
400.0135170.09360.46289
41-0.082783-0.57350.28448
420.0876070.6070.27337
43-0.009684-0.06710.473394
44-0.009999-0.06930.47253
45-0.068793-0.47660.3179
46-0.073568-0.50970.3063
47-0.042584-0.2950.384621
48NANANA
49NANANA
50NANANA
51NANANA
52NANANA
53NANANA
54NANANA
55NANANA
56NANANA
57NANANA
58NANANA
59NANANA
60NANANA

\begin{tabular}{lllllllll}
\hline
Partial Autocorrelation Function \tabularnewline
Time lag k & PACF(k) & T-STAT & P-value \tabularnewline
1 & 0.247004 & 1.7113 & 0.046741 \tabularnewline
2 & 0.170698 & 1.1826 & 0.121391 \tabularnewline
3 & 0.240477 & 1.6661 & 0.051106 \tabularnewline
4 & 0.072137 & 0.4998 & 0.309757 \tabularnewline
5 & -0.163328 & -1.1316 & 0.131719 \tabularnewline
6 & 0.0751 & 0.5203 & 0.302621 \tabularnewline
7 & 0.197407 & 1.3677 & 0.088892 \tabularnewline
8 & -0.206761 & -1.4325 & 0.079243 \tabularnewline
9 & -0.001978 & -0.0137 & 0.494563 \tabularnewline
10 & 0.045085 & 0.3124 & 0.378062 \tabularnewline
11 & -0.110506 & -0.7656 & 0.22383 \tabularnewline
12 & -0.334957 & -2.3207 & 0.012301 \tabularnewline
13 & 0.043635 & 0.3023 & 0.381861 \tabularnewline
14 & -0.00219 & -0.0152 & 0.493979 \tabularnewline
15 & -0.082133 & -0.569 & 0.285993 \tabularnewline
16 & 0.026583 & 0.1842 & 0.427328 \tabularnewline
17 & 0.110232 & 0.7637 & 0.224389 \tabularnewline
18 & 0.036131 & 0.2503 & 0.401703 \tabularnewline
19 & 0.004731 & 0.0328 & 0.486995 \tabularnewline
20 & -0.132173 & -0.9157 & 0.182195 \tabularnewline
21 & -0.045486 & -0.3151 & 0.377013 \tabularnewline
22 & -0.037501 & -0.2598 & 0.39806 \tabularnewline
23 & -0.093444 & -0.6474 & 0.260228 \tabularnewline
24 & -0.151631 & -1.0505 & 0.149367 \tabularnewline
25 & 0.042605 & 0.2952 & 0.384567 \tabularnewline
26 & -0.064351 & -0.4458 & 0.328859 \tabularnewline
27 & -0.039339 & -0.2725 & 0.393185 \tabularnewline
28 & -0.005171 & -0.0358 & 0.485784 \tabularnewline
29 & -0.072523 & -0.5025 & 0.308824 \tabularnewline
30 & -0.037192 & -0.2577 & 0.398881 \tabularnewline
31 & -0.116859 & -0.8096 & 0.211077 \tabularnewline
32 & 0.072523 & 0.5025 & 0.308822 \tabularnewline
33 & -0.010336 & -0.0716 & 0.471604 \tabularnewline
34 & -0.011465 & -0.0794 & 0.468511 \tabularnewline
35 & 0.038608 & 0.2675 & 0.395122 \tabularnewline
36 & -0.034913 & -0.2419 & 0.40495 \tabularnewline
37 & 0.025209 & 0.1747 & 0.431043 \tabularnewline
38 & -0.010285 & -0.0713 & 0.471745 \tabularnewline
39 & -0.110666 & -0.7667 & 0.223502 \tabularnewline
40 & 0.013517 & 0.0936 & 0.46289 \tabularnewline
41 & -0.082783 & -0.5735 & 0.28448 \tabularnewline
42 & 0.087607 & 0.607 & 0.27337 \tabularnewline
43 & -0.009684 & -0.0671 & 0.473394 \tabularnewline
44 & -0.009999 & -0.0693 & 0.47253 \tabularnewline
45 & -0.068793 & -0.4766 & 0.3179 \tabularnewline
46 & -0.073568 & -0.5097 & 0.3063 \tabularnewline
47 & -0.042584 & -0.295 & 0.384621 \tabularnewline
48 & NA & NA & NA \tabularnewline
49 & NA & NA & NA \tabularnewline
50 & NA & NA & NA \tabularnewline
51 & NA & NA & NA \tabularnewline
52 & NA & NA & NA \tabularnewline
53 & NA & NA & NA \tabularnewline
54 & NA & NA & NA \tabularnewline
55 & NA & NA & NA \tabularnewline
56 & NA & NA & NA \tabularnewline
57 & NA & NA & NA \tabularnewline
58 & NA & NA & NA \tabularnewline
59 & NA & NA & NA \tabularnewline
60 & NA & NA & NA \tabularnewline
\hline
\end{tabular}
%Source: https://freestatistics.org/blog/index.php?pk=118032&T=2

[TABLE]
[ROW][C]Partial Autocorrelation Function[/C][/ROW]
[ROW][C]Time lag k[/C][C]PACF(k)[/C][C]T-STAT[/C][C]P-value[/C][/ROW]
[ROW][C]1[/C][C]0.247004[/C][C]1.7113[/C][C]0.046741[/C][/ROW]
[ROW][C]2[/C][C]0.170698[/C][C]1.1826[/C][C]0.121391[/C][/ROW]
[ROW][C]3[/C][C]0.240477[/C][C]1.6661[/C][C]0.051106[/C][/ROW]
[ROW][C]4[/C][C]0.072137[/C][C]0.4998[/C][C]0.309757[/C][/ROW]
[ROW][C]5[/C][C]-0.163328[/C][C]-1.1316[/C][C]0.131719[/C][/ROW]
[ROW][C]6[/C][C]0.0751[/C][C]0.5203[/C][C]0.302621[/C][/ROW]
[ROW][C]7[/C][C]0.197407[/C][C]1.3677[/C][C]0.088892[/C][/ROW]
[ROW][C]8[/C][C]-0.206761[/C][C]-1.4325[/C][C]0.079243[/C][/ROW]
[ROW][C]9[/C][C]-0.001978[/C][C]-0.0137[/C][C]0.494563[/C][/ROW]
[ROW][C]10[/C][C]0.045085[/C][C]0.3124[/C][C]0.378062[/C][/ROW]
[ROW][C]11[/C][C]-0.110506[/C][C]-0.7656[/C][C]0.22383[/C][/ROW]
[ROW][C]12[/C][C]-0.334957[/C][C]-2.3207[/C][C]0.012301[/C][/ROW]
[ROW][C]13[/C][C]0.043635[/C][C]0.3023[/C][C]0.381861[/C][/ROW]
[ROW][C]14[/C][C]-0.00219[/C][C]-0.0152[/C][C]0.493979[/C][/ROW]
[ROW][C]15[/C][C]-0.082133[/C][C]-0.569[/C][C]0.285993[/C][/ROW]
[ROW][C]16[/C][C]0.026583[/C][C]0.1842[/C][C]0.427328[/C][/ROW]
[ROW][C]17[/C][C]0.110232[/C][C]0.7637[/C][C]0.224389[/C][/ROW]
[ROW][C]18[/C][C]0.036131[/C][C]0.2503[/C][C]0.401703[/C][/ROW]
[ROW][C]19[/C][C]0.004731[/C][C]0.0328[/C][C]0.486995[/C][/ROW]
[ROW][C]20[/C][C]-0.132173[/C][C]-0.9157[/C][C]0.182195[/C][/ROW]
[ROW][C]21[/C][C]-0.045486[/C][C]-0.3151[/C][C]0.377013[/C][/ROW]
[ROW][C]22[/C][C]-0.037501[/C][C]-0.2598[/C][C]0.39806[/C][/ROW]
[ROW][C]23[/C][C]-0.093444[/C][C]-0.6474[/C][C]0.260228[/C][/ROW]
[ROW][C]24[/C][C]-0.151631[/C][C]-1.0505[/C][C]0.149367[/C][/ROW]
[ROW][C]25[/C][C]0.042605[/C][C]0.2952[/C][C]0.384567[/C][/ROW]
[ROW][C]26[/C][C]-0.064351[/C][C]-0.4458[/C][C]0.328859[/C][/ROW]
[ROW][C]27[/C][C]-0.039339[/C][C]-0.2725[/C][C]0.393185[/C][/ROW]
[ROW][C]28[/C][C]-0.005171[/C][C]-0.0358[/C][C]0.485784[/C][/ROW]
[ROW][C]29[/C][C]-0.072523[/C][C]-0.5025[/C][C]0.308824[/C][/ROW]
[ROW][C]30[/C][C]-0.037192[/C][C]-0.2577[/C][C]0.398881[/C][/ROW]
[ROW][C]31[/C][C]-0.116859[/C][C]-0.8096[/C][C]0.211077[/C][/ROW]
[ROW][C]32[/C][C]0.072523[/C][C]0.5025[/C][C]0.308822[/C][/ROW]
[ROW][C]33[/C][C]-0.010336[/C][C]-0.0716[/C][C]0.471604[/C][/ROW]
[ROW][C]34[/C][C]-0.011465[/C][C]-0.0794[/C][C]0.468511[/C][/ROW]
[ROW][C]35[/C][C]0.038608[/C][C]0.2675[/C][C]0.395122[/C][/ROW]
[ROW][C]36[/C][C]-0.034913[/C][C]-0.2419[/C][C]0.40495[/C][/ROW]
[ROW][C]37[/C][C]0.025209[/C][C]0.1747[/C][C]0.431043[/C][/ROW]
[ROW][C]38[/C][C]-0.010285[/C][C]-0.0713[/C][C]0.471745[/C][/ROW]
[ROW][C]39[/C][C]-0.110666[/C][C]-0.7667[/C][C]0.223502[/C][/ROW]
[ROW][C]40[/C][C]0.013517[/C][C]0.0936[/C][C]0.46289[/C][/ROW]
[ROW][C]41[/C][C]-0.082783[/C][C]-0.5735[/C][C]0.28448[/C][/ROW]
[ROW][C]42[/C][C]0.087607[/C][C]0.607[/C][C]0.27337[/C][/ROW]
[ROW][C]43[/C][C]-0.009684[/C][C]-0.0671[/C][C]0.473394[/C][/ROW]
[ROW][C]44[/C][C]-0.009999[/C][C]-0.0693[/C][C]0.47253[/C][/ROW]
[ROW][C]45[/C][C]-0.068793[/C][C]-0.4766[/C][C]0.3179[/C][/ROW]
[ROW][C]46[/C][C]-0.073568[/C][C]-0.5097[/C][C]0.3063[/C][/ROW]
[ROW][C]47[/C][C]-0.042584[/C][C]-0.295[/C][C]0.384621[/C][/ROW]
[ROW][C]48[/C][C]NA[/C][C]NA[/C][C]NA[/C][/ROW]
[ROW][C]49[/C][C]NA[/C][C]NA[/C][C]NA[/C][/ROW]
[ROW][C]50[/C][C]NA[/C][C]NA[/C][C]NA[/C][/ROW]
[ROW][C]51[/C][C]NA[/C][C]NA[/C][C]NA[/C][/ROW]
[ROW][C]52[/C][C]NA[/C][C]NA[/C][C]NA[/C][/ROW]
[ROW][C]53[/C][C]NA[/C][C]NA[/C][C]NA[/C][/ROW]
[ROW][C]54[/C][C]NA[/C][C]NA[/C][C]NA[/C][/ROW]
[ROW][C]55[/C][C]NA[/C][C]NA[/C][C]NA[/C][/ROW]
[ROW][C]56[/C][C]NA[/C][C]NA[/C][C]NA[/C][/ROW]
[ROW][C]57[/C][C]NA[/C][C]NA[/C][C]NA[/C][/ROW]
[ROW][C]58[/C][C]NA[/C][C]NA[/C][C]NA[/C][/ROW]
[ROW][C]59[/C][C]NA[/C][C]NA[/C][C]NA[/C][/ROW]
[ROW][C]60[/C][C]NA[/C][C]NA[/C][C]NA[/C][/ROW]
[/TABLE]
Source: https://freestatistics.org/blog/index.php?pk=118032&T=2

Globally Unique Identifier (entire table): ba.freestatistics.org/blog/index.php?pk=118032&T=2

As an alternative you can also use a QR Code:  

The GUIDs for individual cells are displayed in the table below:

Partial Autocorrelation Function
Time lag kPACF(k)T-STATP-value
10.2470041.71130.046741
20.1706981.18260.121391
30.2404771.66610.051106
40.0721370.49980.309757
5-0.163328-1.13160.131719
60.07510.52030.302621
70.1974071.36770.088892
8-0.206761-1.43250.079243
9-0.001978-0.01370.494563
100.0450850.31240.378062
11-0.110506-0.76560.22383
12-0.334957-2.32070.012301
130.0436350.30230.381861
14-0.00219-0.01520.493979
15-0.082133-0.5690.285993
160.0265830.18420.427328
170.1102320.76370.224389
180.0361310.25030.401703
190.0047310.03280.486995
20-0.132173-0.91570.182195
21-0.045486-0.31510.377013
22-0.037501-0.25980.39806
23-0.093444-0.64740.260228
24-0.151631-1.05050.149367
250.0426050.29520.384567
26-0.064351-0.44580.328859
27-0.039339-0.27250.393185
28-0.005171-0.03580.485784
29-0.072523-0.50250.308824
30-0.037192-0.25770.398881
31-0.116859-0.80960.211077
320.0725230.50250.308822
33-0.010336-0.07160.471604
34-0.011465-0.07940.468511
350.0386080.26750.395122
36-0.034913-0.24190.40495
370.0252090.17470.431043
38-0.010285-0.07130.471745
39-0.110666-0.76670.223502
400.0135170.09360.46289
41-0.082783-0.57350.28448
420.0876070.6070.27337
43-0.009684-0.06710.473394
44-0.009999-0.06930.47253
45-0.068793-0.47660.3179
46-0.073568-0.50970.3063
47-0.042584-0.2950.384621
48NANANA
49NANANA
50NANANA
51NANANA
52NANANA
53NANANA
54NANANA
55NANANA
56NANANA
57NANANA
58NANANA
59NANANA
60NANANA


Parameters (Session):
par4 = 12 ;
Parameters (R input):
par1 = 60 ; par2 = 1 ; par3 = 0 ; par4 = 1 ; par5 = 12 ; par6 = White Noise ; par7 = 0.95 ; par8 = ;
R code (references can be found in the software module):
if (par1 == 'Default') {
par1 = 10*log10(length(x))
} else {
par1 <- as.numeric(par1)
}
par2 <- as.numeric(par2)
par3 <- as.numeric(par3)
par4 <- as.numeric(par4)
par5 <- as.numeric(par5)
if (par6 == 'White Noise') par6 <- 'white' else par6 <- 'ma'
par7 <- as.numeric(par7)
if (par8 != '') par8 <- as.numeric(par8)
ox <- x
if (par8 == '') {
if (par2 == 0) {
x <- log(x)
} else {
x <- (x ^ par2 - 1) / par2
}
} else {
x <- log(x,base=par8)
}
if (par3 > 0) x <- diff(x,lag=1,difference=par3)
if (par4 > 0) x <- diff(x,lag=par5,difference=par4)
bitmap(file='picts.png')
op <- par(mfrow=c(2,1))
plot(ox,type='l',main='Original Time Series',xlab='time',ylab='value')
if (par8=='') {
mytitle <- paste('Working Time Series (lambda=',par2,', d=',par3,', D=',par4,')',sep='')
mysub <- paste('(lambda=',par2,', d=',par3,', D=',par4,', CI=', par7, ', CI type=',par6,')',sep='')
} else {
mytitle <- paste('Working Time Series (base=',par8,', d=',par3,', D=',par4,')',sep='')
mysub <- paste('(base=',par8,', d=',par3,', D=',par4,', CI=', par7, ', CI type=',par6,')',sep='')
}
plot(x,type='l', main=mytitle,xlab='time',ylab='value')
par(op)
dev.off()
bitmap(file='pic1.png')
racf <- acf(x, par1, main='Autocorrelation', xlab='time lag', ylab='ACF', ci.type=par6, ci=par7, sub=mysub)
dev.off()
bitmap(file='pic2.png')
rpacf <- pacf(x,par1,main='Partial Autocorrelation',xlab='lags',ylab='PACF',sub=mysub)
dev.off()
(myacf <- c(racf$acf))
(mypacf <- c(rpacf$acf))
lengthx <- length(x)
sqrtn <- sqrt(lengthx)
load(file='createtable')
a<-table.start()
a<-table.row.start(a)
a<-table.element(a,'Autocorrelation Function',4,TRUE)
a<-table.row.end(a)
a<-table.row.start(a)
a<-table.element(a,'Time lag k',header=TRUE)
a<-table.element(a,hyperlink('basics.htm','ACF(k)','click here for more information about the Autocorrelation Function'),header=TRUE)
a<-table.element(a,'T-STAT',header=TRUE)
a<-table.element(a,'P-value',header=TRUE)
a<-table.row.end(a)
for (i in 2:(par1+1)) {
a<-table.row.start(a)
a<-table.element(a,i-1,header=TRUE)
a<-table.element(a,round(myacf[i],6))
mytstat <- myacf[i]*sqrtn
a<-table.element(a,round(mytstat,4))
a<-table.element(a,round(1-pt(abs(mytstat),lengthx),6))
a<-table.row.end(a)
}
a<-table.end(a)
table.save(a,file='mytable.tab')
a<-table.start()
a<-table.row.start(a)
a<-table.element(a,'Partial Autocorrelation Function',4,TRUE)
a<-table.row.end(a)
a<-table.row.start(a)
a<-table.element(a,'Time lag k',header=TRUE)
a<-table.element(a,hyperlink('basics.htm','PACF(k)','click here for more information about the Partial Autocorrelation Function'),header=TRUE)
a<-table.element(a,'T-STAT',header=TRUE)
a<-table.element(a,'P-value',header=TRUE)
a<-table.row.end(a)
for (i in 1:par1) {
a<-table.row.start(a)
a<-table.element(a,i,header=TRUE)
a<-table.element(a,round(mypacf[i],6))
mytstat <- mypacf[i]*sqrtn
a<-table.element(a,round(mytstat,4))
a<-table.element(a,round(1-pt(abs(mytstat),lengthx),6))
a<-table.row.end(a)
}
a<-table.end(a)
table.save(a,file='mytable1.tab')