Free Statistics

of Irreproducible Research!

Author's title

Author*The author of this computation has been verified*
R Software Modulerwasp_autocorrelation.wasp
Title produced by software(Partial) Autocorrelation Function
Date of computationWed, 02 Feb 2011 17:44:43 +0000
Cite this page as followsStatistical Computations at FreeStatistics.org, Office for Research Development and Education, URL https://freestatistics.org/blog/index.php?v=date/2011/Feb/02/t1296669884fthvoiym05cn4wz.htm/, Retrieved Sun, 19 May 2024 17:43:47 +0000
Statistical Computations at FreeStatistics.org, Office for Research Development and Education, URL https://freestatistics.org/blog/index.php?pk=118031, Retrieved Sun, 19 May 2024 17:43:47 +0000
QR Codes:

Original text written by user:
IsPrivate?No (this computation is public)
User-defined keywords
Estimated Impact240
Family? (F = Feedback message, R = changed R code, M = changed R Module, P = changed Parameters, D = changed Data)
-       [(Partial) Autocorrelation Function] [] [2011-02-02 17:44:43] [ff423994c38282a6d306f7d0147a5924] [Current]
Feedback Forum

Post a new message
Dataseries X:
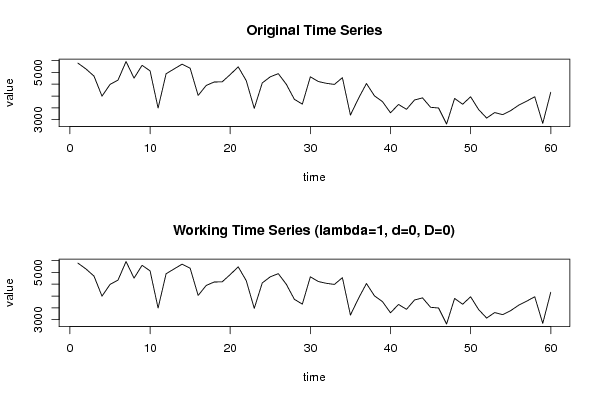
5393
5147
4846
3995
4491
4676
5461
4758
5302
5066
3491
4944
5148
5351
5178
4025
4449
4594
4603
4911
5236
4652
3479
4556
4815
4949
4499
3865
3657
4814
4614
4539
4492
4779
3193
3894
4531
4008
3764
3290
3644
3438
3833
3922
3524
3493
2814
3899
3653
3969
3427
3067
3301
3211
3382
3613
3783
3971
2842
4161


Summary of computational transaction
Raw Inputview raw input (R code)
Raw Outputview raw output of R engine
Computing time1 seconds
R Server'Gwilym Jenkins' @ www.wessa.org

\begin{tabular}{lllllllll}
\hline
Summary of computational transaction \tabularnewline
Raw Input & view raw input (R code)  \tabularnewline
Raw Output & view raw output of R engine  \tabularnewline
Computing time & 1 seconds \tabularnewline
R Server & 'Gwilym Jenkins' @ www.wessa.org \tabularnewline
\hline
\end{tabular}
%Source: https://freestatistics.org/blog/index.php?pk=118031&T=0

[TABLE]
[ROW][C]Summary of computational transaction[/C][/ROW]
[ROW][C]Raw Input[/C][C]view raw input (R code) [/C][/ROW]
[ROW][C]Raw Output[/C][C]view raw output of R engine [/C][/ROW]
[ROW][C]Computing time[/C][C]1 seconds[/C][/ROW]
[ROW][C]R Server[/C][C]'Gwilym Jenkins' @ www.wessa.org[/C][/ROW]
[/TABLE]
Source: https://freestatistics.org/blog/index.php?pk=118031&T=0

Globally Unique Identifier (entire table): ba.freestatistics.org/blog/index.php?pk=118031&T=0

As an alternative you can also use a QR Code:  

The GUIDs for individual cells are displayed in the table below:

Summary of computational transaction
Raw Inputview raw input (R code)
Raw Outputview raw output of R engine
Computing time1 seconds
R Server'Gwilym Jenkins' @ www.wessa.org


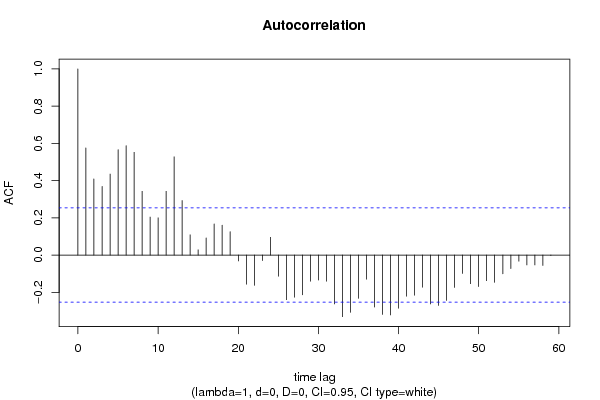
Autocorrelation Function
Time lag kACF(k)T-STATP-value
10.5758294.46041.8e-05
20.4093.16810.001207
30.3689522.85790.002927
40.4355423.37370.000652
50.5663974.38732.4e-05
60.5878424.55341.3e-05
70.5521114.27663.5e-05
80.3427382.65480.005073
90.2046591.58530.05908
100.2002911.55140.063027
110.3429342.65640.005052
120.527874.08896.5e-05
130.2929672.26930.013429
140.1090020.84430.20092
150.0286250.22170.412639
160.0921880.71410.238971
170.1670881.29430.100267
180.16071.24480.109027
190.125750.97410.16697
20-0.031128-0.24110.405143
21-0.156435-1.21170.115181
22-0.162078-1.25550.107091
23-0.029699-0.23010.409417
240.0956160.74060.230901
25-0.113536-0.87940.191334
26-0.23944-1.85470.034278
27-0.2265-1.75450.042229
28-0.213575-1.65430.05164
29-0.139979-1.08430.14129
30-0.134475-1.04160.150879
31-0.140502-1.08830.140403
32-0.262659-2.03450.023161
33-0.330706-2.56160.006474
34-0.307486-2.38180.010209
35-0.231893-1.79620.038746
36-0.129545-1.00350.159836
37-0.27944-2.16450.017206
38-0.318962-2.47070.008172
39-0.321584-2.4910.007762
40-0.285339-2.21020.015457
41-0.220527-1.70820.046385
42-0.215159-1.66660.050402
43-0.172485-1.33610.093286
44-0.262097-2.03020.023388
45-0.270442-2.09480.020208
46-0.243602-1.88690.032005
47-0.174015-1.34790.091376
48-0.098262-0.76110.224779
49-0.153295-1.18740.119871
50-0.169124-1.310.09759
51-0.13772-1.06680.145173
52-0.146019-1.13110.131266
53-0.100384-0.77760.219938
54-0.072239-0.55960.288932
55-0.032585-0.25240.400796
56-0.052905-0.40980.341705
57-0.053072-0.41110.341233
58-0.055401-0.42910.334681
59-0.001807-0.0140.494439
60NANANA

\begin{tabular}{lllllllll}
\hline
Autocorrelation Function \tabularnewline
Time lag k & ACF(k) & T-STAT & P-value \tabularnewline
1 & 0.575829 & 4.4604 & 1.8e-05 \tabularnewline
2 & 0.409 & 3.1681 & 0.001207 \tabularnewline
3 & 0.368952 & 2.8579 & 0.002927 \tabularnewline
4 & 0.435542 & 3.3737 & 0.000652 \tabularnewline
5 & 0.566397 & 4.3873 & 2.4e-05 \tabularnewline
6 & 0.587842 & 4.5534 & 1.3e-05 \tabularnewline
7 & 0.552111 & 4.2766 & 3.5e-05 \tabularnewline
8 & 0.342738 & 2.6548 & 0.005073 \tabularnewline
9 & 0.204659 & 1.5853 & 0.05908 \tabularnewline
10 & 0.200291 & 1.5514 & 0.063027 \tabularnewline
11 & 0.342934 & 2.6564 & 0.005052 \tabularnewline
12 & 0.52787 & 4.0889 & 6.5e-05 \tabularnewline
13 & 0.292967 & 2.2693 & 0.013429 \tabularnewline
14 & 0.109002 & 0.8443 & 0.20092 \tabularnewline
15 & 0.028625 & 0.2217 & 0.412639 \tabularnewline
16 & 0.092188 & 0.7141 & 0.238971 \tabularnewline
17 & 0.167088 & 1.2943 & 0.100267 \tabularnewline
18 & 0.1607 & 1.2448 & 0.109027 \tabularnewline
19 & 0.12575 & 0.9741 & 0.16697 \tabularnewline
20 & -0.031128 & -0.2411 & 0.405143 \tabularnewline
21 & -0.156435 & -1.2117 & 0.115181 \tabularnewline
22 & -0.162078 & -1.2555 & 0.107091 \tabularnewline
23 & -0.029699 & -0.2301 & 0.409417 \tabularnewline
24 & 0.095616 & 0.7406 & 0.230901 \tabularnewline
25 & -0.113536 & -0.8794 & 0.191334 \tabularnewline
26 & -0.23944 & -1.8547 & 0.034278 \tabularnewline
27 & -0.2265 & -1.7545 & 0.042229 \tabularnewline
28 & -0.213575 & -1.6543 & 0.05164 \tabularnewline
29 & -0.139979 & -1.0843 & 0.14129 \tabularnewline
30 & -0.134475 & -1.0416 & 0.150879 \tabularnewline
31 & -0.140502 & -1.0883 & 0.140403 \tabularnewline
32 & -0.262659 & -2.0345 & 0.023161 \tabularnewline
33 & -0.330706 & -2.5616 & 0.006474 \tabularnewline
34 & -0.307486 & -2.3818 & 0.010209 \tabularnewline
35 & -0.231893 & -1.7962 & 0.038746 \tabularnewline
36 & -0.129545 & -1.0035 & 0.159836 \tabularnewline
37 & -0.27944 & -2.1645 & 0.017206 \tabularnewline
38 & -0.318962 & -2.4707 & 0.008172 \tabularnewline
39 & -0.321584 & -2.491 & 0.007762 \tabularnewline
40 & -0.285339 & -2.2102 & 0.015457 \tabularnewline
41 & -0.220527 & -1.7082 & 0.046385 \tabularnewline
42 & -0.215159 & -1.6666 & 0.050402 \tabularnewline
43 & -0.172485 & -1.3361 & 0.093286 \tabularnewline
44 & -0.262097 & -2.0302 & 0.023388 \tabularnewline
45 & -0.270442 & -2.0948 & 0.020208 \tabularnewline
46 & -0.243602 & -1.8869 & 0.032005 \tabularnewline
47 & -0.174015 & -1.3479 & 0.091376 \tabularnewline
48 & -0.098262 & -0.7611 & 0.224779 \tabularnewline
49 & -0.153295 & -1.1874 & 0.119871 \tabularnewline
50 & -0.169124 & -1.31 & 0.09759 \tabularnewline
51 & -0.13772 & -1.0668 & 0.145173 \tabularnewline
52 & -0.146019 & -1.1311 & 0.131266 \tabularnewline
53 & -0.100384 & -0.7776 & 0.219938 \tabularnewline
54 & -0.072239 & -0.5596 & 0.288932 \tabularnewline
55 & -0.032585 & -0.2524 & 0.400796 \tabularnewline
56 & -0.052905 & -0.4098 & 0.341705 \tabularnewline
57 & -0.053072 & -0.4111 & 0.341233 \tabularnewline
58 & -0.055401 & -0.4291 & 0.334681 \tabularnewline
59 & -0.001807 & -0.014 & 0.494439 \tabularnewline
60 & NA & NA & NA \tabularnewline
\hline
\end{tabular}
%Source: https://freestatistics.org/blog/index.php?pk=118031&T=1

[TABLE]
[ROW][C]Autocorrelation Function[/C][/ROW]
[ROW][C]Time lag k[/C][C]ACF(k)[/C][C]T-STAT[/C][C]P-value[/C][/ROW]
[ROW][C]1[/C][C]0.575829[/C][C]4.4604[/C][C]1.8e-05[/C][/ROW]
[ROW][C]2[/C][C]0.409[/C][C]3.1681[/C][C]0.001207[/C][/ROW]
[ROW][C]3[/C][C]0.368952[/C][C]2.8579[/C][C]0.002927[/C][/ROW]
[ROW][C]4[/C][C]0.435542[/C][C]3.3737[/C][C]0.000652[/C][/ROW]
[ROW][C]5[/C][C]0.566397[/C][C]4.3873[/C][C]2.4e-05[/C][/ROW]
[ROW][C]6[/C][C]0.587842[/C][C]4.5534[/C][C]1.3e-05[/C][/ROW]
[ROW][C]7[/C][C]0.552111[/C][C]4.2766[/C][C]3.5e-05[/C][/ROW]
[ROW][C]8[/C][C]0.342738[/C][C]2.6548[/C][C]0.005073[/C][/ROW]
[ROW][C]9[/C][C]0.204659[/C][C]1.5853[/C][C]0.05908[/C][/ROW]
[ROW][C]10[/C][C]0.200291[/C][C]1.5514[/C][C]0.063027[/C][/ROW]
[ROW][C]11[/C][C]0.342934[/C][C]2.6564[/C][C]0.005052[/C][/ROW]
[ROW][C]12[/C][C]0.52787[/C][C]4.0889[/C][C]6.5e-05[/C][/ROW]
[ROW][C]13[/C][C]0.292967[/C][C]2.2693[/C][C]0.013429[/C][/ROW]
[ROW][C]14[/C][C]0.109002[/C][C]0.8443[/C][C]0.20092[/C][/ROW]
[ROW][C]15[/C][C]0.028625[/C][C]0.2217[/C][C]0.412639[/C][/ROW]
[ROW][C]16[/C][C]0.092188[/C][C]0.7141[/C][C]0.238971[/C][/ROW]
[ROW][C]17[/C][C]0.167088[/C][C]1.2943[/C][C]0.100267[/C][/ROW]
[ROW][C]18[/C][C]0.1607[/C][C]1.2448[/C][C]0.109027[/C][/ROW]
[ROW][C]19[/C][C]0.12575[/C][C]0.9741[/C][C]0.16697[/C][/ROW]
[ROW][C]20[/C][C]-0.031128[/C][C]-0.2411[/C][C]0.405143[/C][/ROW]
[ROW][C]21[/C][C]-0.156435[/C][C]-1.2117[/C][C]0.115181[/C][/ROW]
[ROW][C]22[/C][C]-0.162078[/C][C]-1.2555[/C][C]0.107091[/C][/ROW]
[ROW][C]23[/C][C]-0.029699[/C][C]-0.2301[/C][C]0.409417[/C][/ROW]
[ROW][C]24[/C][C]0.095616[/C][C]0.7406[/C][C]0.230901[/C][/ROW]
[ROW][C]25[/C][C]-0.113536[/C][C]-0.8794[/C][C]0.191334[/C][/ROW]
[ROW][C]26[/C][C]-0.23944[/C][C]-1.8547[/C][C]0.034278[/C][/ROW]
[ROW][C]27[/C][C]-0.2265[/C][C]-1.7545[/C][C]0.042229[/C][/ROW]
[ROW][C]28[/C][C]-0.213575[/C][C]-1.6543[/C][C]0.05164[/C][/ROW]
[ROW][C]29[/C][C]-0.139979[/C][C]-1.0843[/C][C]0.14129[/C][/ROW]
[ROW][C]30[/C][C]-0.134475[/C][C]-1.0416[/C][C]0.150879[/C][/ROW]
[ROW][C]31[/C][C]-0.140502[/C][C]-1.0883[/C][C]0.140403[/C][/ROW]
[ROW][C]32[/C][C]-0.262659[/C][C]-2.0345[/C][C]0.023161[/C][/ROW]
[ROW][C]33[/C][C]-0.330706[/C][C]-2.5616[/C][C]0.006474[/C][/ROW]
[ROW][C]34[/C][C]-0.307486[/C][C]-2.3818[/C][C]0.010209[/C][/ROW]
[ROW][C]35[/C][C]-0.231893[/C][C]-1.7962[/C][C]0.038746[/C][/ROW]
[ROW][C]36[/C][C]-0.129545[/C][C]-1.0035[/C][C]0.159836[/C][/ROW]
[ROW][C]37[/C][C]-0.27944[/C][C]-2.1645[/C][C]0.017206[/C][/ROW]
[ROW][C]38[/C][C]-0.318962[/C][C]-2.4707[/C][C]0.008172[/C][/ROW]
[ROW][C]39[/C][C]-0.321584[/C][C]-2.491[/C][C]0.007762[/C][/ROW]
[ROW][C]40[/C][C]-0.285339[/C][C]-2.2102[/C][C]0.015457[/C][/ROW]
[ROW][C]41[/C][C]-0.220527[/C][C]-1.7082[/C][C]0.046385[/C][/ROW]
[ROW][C]42[/C][C]-0.215159[/C][C]-1.6666[/C][C]0.050402[/C][/ROW]
[ROW][C]43[/C][C]-0.172485[/C][C]-1.3361[/C][C]0.093286[/C][/ROW]
[ROW][C]44[/C][C]-0.262097[/C][C]-2.0302[/C][C]0.023388[/C][/ROW]
[ROW][C]45[/C][C]-0.270442[/C][C]-2.0948[/C][C]0.020208[/C][/ROW]
[ROW][C]46[/C][C]-0.243602[/C][C]-1.8869[/C][C]0.032005[/C][/ROW]
[ROW][C]47[/C][C]-0.174015[/C][C]-1.3479[/C][C]0.091376[/C][/ROW]
[ROW][C]48[/C][C]-0.098262[/C][C]-0.7611[/C][C]0.224779[/C][/ROW]
[ROW][C]49[/C][C]-0.153295[/C][C]-1.1874[/C][C]0.119871[/C][/ROW]
[ROW][C]50[/C][C]-0.169124[/C][C]-1.31[/C][C]0.09759[/C][/ROW]
[ROW][C]51[/C][C]-0.13772[/C][C]-1.0668[/C][C]0.145173[/C][/ROW]
[ROW][C]52[/C][C]-0.146019[/C][C]-1.1311[/C][C]0.131266[/C][/ROW]
[ROW][C]53[/C][C]-0.100384[/C][C]-0.7776[/C][C]0.219938[/C][/ROW]
[ROW][C]54[/C][C]-0.072239[/C][C]-0.5596[/C][C]0.288932[/C][/ROW]
[ROW][C]55[/C][C]-0.032585[/C][C]-0.2524[/C][C]0.400796[/C][/ROW]
[ROW][C]56[/C][C]-0.052905[/C][C]-0.4098[/C][C]0.341705[/C][/ROW]
[ROW][C]57[/C][C]-0.053072[/C][C]-0.4111[/C][C]0.341233[/C][/ROW]
[ROW][C]58[/C][C]-0.055401[/C][C]-0.4291[/C][C]0.334681[/C][/ROW]
[ROW][C]59[/C][C]-0.001807[/C][C]-0.014[/C][C]0.494439[/C][/ROW]
[ROW][C]60[/C][C]NA[/C][C]NA[/C][C]NA[/C][/ROW]
[/TABLE]
Source: https://freestatistics.org/blog/index.php?pk=118031&T=1

Globally Unique Identifier (entire table): ba.freestatistics.org/blog/index.php?pk=118031&T=1

As an alternative you can also use a QR Code:  

The GUIDs for individual cells are displayed in the table below:

Autocorrelation Function
Time lag kACF(k)T-STATP-value
10.5758294.46041.8e-05
20.4093.16810.001207
30.3689522.85790.002927
40.4355423.37370.000652
50.5663974.38732.4e-05
60.5878424.55341.3e-05
70.5521114.27663.5e-05
80.3427382.65480.005073
90.2046591.58530.05908
100.2002911.55140.063027
110.3429342.65640.005052
120.527874.08896.5e-05
130.2929672.26930.013429
140.1090020.84430.20092
150.0286250.22170.412639
160.0921880.71410.238971
170.1670881.29430.100267
180.16071.24480.109027
190.125750.97410.16697
20-0.031128-0.24110.405143
21-0.156435-1.21170.115181
22-0.162078-1.25550.107091
23-0.029699-0.23010.409417
240.0956160.74060.230901
25-0.113536-0.87940.191334
26-0.23944-1.85470.034278
27-0.2265-1.75450.042229
28-0.213575-1.65430.05164
29-0.139979-1.08430.14129
30-0.134475-1.04160.150879
31-0.140502-1.08830.140403
32-0.262659-2.03450.023161
33-0.330706-2.56160.006474
34-0.307486-2.38180.010209
35-0.231893-1.79620.038746
36-0.129545-1.00350.159836
37-0.27944-2.16450.017206
38-0.318962-2.47070.008172
39-0.321584-2.4910.007762
40-0.285339-2.21020.015457
41-0.220527-1.70820.046385
42-0.215159-1.66660.050402
43-0.172485-1.33610.093286
44-0.262097-2.03020.023388
45-0.270442-2.09480.020208
46-0.243602-1.88690.032005
47-0.174015-1.34790.091376
48-0.098262-0.76110.224779
49-0.153295-1.18740.119871
50-0.169124-1.310.09759
51-0.13772-1.06680.145173
52-0.146019-1.13110.131266
53-0.100384-0.77760.219938
54-0.072239-0.55960.288932
55-0.032585-0.25240.400796
56-0.052905-0.40980.341705
57-0.053072-0.41110.341233
58-0.055401-0.42910.334681
59-0.001807-0.0140.494439
60NANANA


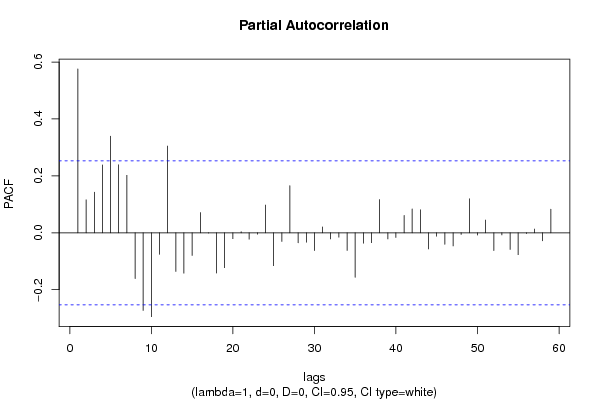
Partial Autocorrelation Function
Time lag kPACF(k)T-STATP-value
10.5758294.46041.8e-05
20.1158270.89720.186601
30.1425731.10440.136922
40.2383841.84650.034876
50.339622.63070.005407
60.2389391.85080.034561
70.2019041.56390.061546
8-0.160776-1.24540.10892
9-0.272578-2.11140.019457
10-0.294584-2.28180.01303
11-0.075521-0.5850.280377
120.3049342.3620.010719
13-0.135609-1.05040.148868
14-0.141976-1.09970.137919
15-0.079408-0.61510.270409
160.0710260.55020.292124
17-0.000709-0.00550.497817
18-0.141592-1.09680.138562
19-0.12256-0.94930.173127
20-0.020714-0.16040.436533
210.0041650.03230.487185
22-0.022528-0.17450.43103
23-0.004671-0.03620.485628
240.0974140.75460.226731
25-0.115505-0.89470.187262
26-0.030073-0.23290.408298
270.1658341.28450.101945
28-0.03495-0.27070.393766
29-0.033041-0.25590.399438
30-0.06216-0.48150.315959
310.0206290.15980.43679
32-0.021343-0.16530.434623
33-0.015349-0.11890.45288
34-0.061737-0.47820.317117
35-0.156404-1.21150.115227
36-0.036626-0.28370.388808
37-0.034662-0.26850.394622
380.1167460.90430.184724
39-0.021308-0.16510.434729
40-0.016353-0.12670.449813
410.0608790.47160.319472
420.0837670.64890.259454
430.0809840.62730.266422
44-0.056653-0.43880.33118
45-0.01184-0.09170.463615
46-0.040378-0.31280.377771
47-0.046203-0.35790.360843
48-0.005551-0.0430.482922
490.1192910.9240.179587
50-0.007912-0.06130.475668
510.0446390.34580.365363
52-0.062259-0.48230.31569
53-0.007522-0.05830.476864
54-0.058322-0.45180.326537
55-0.076828-0.59510.277006
56-0.002828-0.02190.491297
570.0133870.10370.45888
58-0.028227-0.21860.413834
590.0832570.64490.260724
60NANANA

\begin{tabular}{lllllllll}
\hline
Partial Autocorrelation Function \tabularnewline
Time lag k & PACF(k) & T-STAT & P-value \tabularnewline
1 & 0.575829 & 4.4604 & 1.8e-05 \tabularnewline
2 & 0.115827 & 0.8972 & 0.186601 \tabularnewline
3 & 0.142573 & 1.1044 & 0.136922 \tabularnewline
4 & 0.238384 & 1.8465 & 0.034876 \tabularnewline
5 & 0.33962 & 2.6307 & 0.005407 \tabularnewline
6 & 0.238939 & 1.8508 & 0.034561 \tabularnewline
7 & 0.201904 & 1.5639 & 0.061546 \tabularnewline
8 & -0.160776 & -1.2454 & 0.10892 \tabularnewline
9 & -0.272578 & -2.1114 & 0.019457 \tabularnewline
10 & -0.294584 & -2.2818 & 0.01303 \tabularnewline
11 & -0.075521 & -0.585 & 0.280377 \tabularnewline
12 & 0.304934 & 2.362 & 0.010719 \tabularnewline
13 & -0.135609 & -1.0504 & 0.148868 \tabularnewline
14 & -0.141976 & -1.0997 & 0.137919 \tabularnewline
15 & -0.079408 & -0.6151 & 0.270409 \tabularnewline
16 & 0.071026 & 0.5502 & 0.292124 \tabularnewline
17 & -0.000709 & -0.0055 & 0.497817 \tabularnewline
18 & -0.141592 & -1.0968 & 0.138562 \tabularnewline
19 & -0.12256 & -0.9493 & 0.173127 \tabularnewline
20 & -0.020714 & -0.1604 & 0.436533 \tabularnewline
21 & 0.004165 & 0.0323 & 0.487185 \tabularnewline
22 & -0.022528 & -0.1745 & 0.43103 \tabularnewline
23 & -0.004671 & -0.0362 & 0.485628 \tabularnewline
24 & 0.097414 & 0.7546 & 0.226731 \tabularnewline
25 & -0.115505 & -0.8947 & 0.187262 \tabularnewline
26 & -0.030073 & -0.2329 & 0.408298 \tabularnewline
27 & 0.165834 & 1.2845 & 0.101945 \tabularnewline
28 & -0.03495 & -0.2707 & 0.393766 \tabularnewline
29 & -0.033041 & -0.2559 & 0.399438 \tabularnewline
30 & -0.06216 & -0.4815 & 0.315959 \tabularnewline
31 & 0.020629 & 0.1598 & 0.43679 \tabularnewline
32 & -0.021343 & -0.1653 & 0.434623 \tabularnewline
33 & -0.015349 & -0.1189 & 0.45288 \tabularnewline
34 & -0.061737 & -0.4782 & 0.317117 \tabularnewline
35 & -0.156404 & -1.2115 & 0.115227 \tabularnewline
36 & -0.036626 & -0.2837 & 0.388808 \tabularnewline
37 & -0.034662 & -0.2685 & 0.394622 \tabularnewline
38 & 0.116746 & 0.9043 & 0.184724 \tabularnewline
39 & -0.021308 & -0.1651 & 0.434729 \tabularnewline
40 & -0.016353 & -0.1267 & 0.449813 \tabularnewline
41 & 0.060879 & 0.4716 & 0.319472 \tabularnewline
42 & 0.083767 & 0.6489 & 0.259454 \tabularnewline
43 & 0.080984 & 0.6273 & 0.266422 \tabularnewline
44 & -0.056653 & -0.4388 & 0.33118 \tabularnewline
45 & -0.01184 & -0.0917 & 0.463615 \tabularnewline
46 & -0.040378 & -0.3128 & 0.377771 \tabularnewline
47 & -0.046203 & -0.3579 & 0.360843 \tabularnewline
48 & -0.005551 & -0.043 & 0.482922 \tabularnewline
49 & 0.119291 & 0.924 & 0.179587 \tabularnewline
50 & -0.007912 & -0.0613 & 0.475668 \tabularnewline
51 & 0.044639 & 0.3458 & 0.365363 \tabularnewline
52 & -0.062259 & -0.4823 & 0.31569 \tabularnewline
53 & -0.007522 & -0.0583 & 0.476864 \tabularnewline
54 & -0.058322 & -0.4518 & 0.326537 \tabularnewline
55 & -0.076828 & -0.5951 & 0.277006 \tabularnewline
56 & -0.002828 & -0.0219 & 0.491297 \tabularnewline
57 & 0.013387 & 0.1037 & 0.45888 \tabularnewline
58 & -0.028227 & -0.2186 & 0.413834 \tabularnewline
59 & 0.083257 & 0.6449 & 0.260724 \tabularnewline
60 & NA & NA & NA \tabularnewline
\hline
\end{tabular}
%Source: https://freestatistics.org/blog/index.php?pk=118031&T=2

[TABLE]
[ROW][C]Partial Autocorrelation Function[/C][/ROW]
[ROW][C]Time lag k[/C][C]PACF(k)[/C][C]T-STAT[/C][C]P-value[/C][/ROW]
[ROW][C]1[/C][C]0.575829[/C][C]4.4604[/C][C]1.8e-05[/C][/ROW]
[ROW][C]2[/C][C]0.115827[/C][C]0.8972[/C][C]0.186601[/C][/ROW]
[ROW][C]3[/C][C]0.142573[/C][C]1.1044[/C][C]0.136922[/C][/ROW]
[ROW][C]4[/C][C]0.238384[/C][C]1.8465[/C][C]0.034876[/C][/ROW]
[ROW][C]5[/C][C]0.33962[/C][C]2.6307[/C][C]0.005407[/C][/ROW]
[ROW][C]6[/C][C]0.238939[/C][C]1.8508[/C][C]0.034561[/C][/ROW]
[ROW][C]7[/C][C]0.201904[/C][C]1.5639[/C][C]0.061546[/C][/ROW]
[ROW][C]8[/C][C]-0.160776[/C][C]-1.2454[/C][C]0.10892[/C][/ROW]
[ROW][C]9[/C][C]-0.272578[/C][C]-2.1114[/C][C]0.019457[/C][/ROW]
[ROW][C]10[/C][C]-0.294584[/C][C]-2.2818[/C][C]0.01303[/C][/ROW]
[ROW][C]11[/C][C]-0.075521[/C][C]-0.585[/C][C]0.280377[/C][/ROW]
[ROW][C]12[/C][C]0.304934[/C][C]2.362[/C][C]0.010719[/C][/ROW]
[ROW][C]13[/C][C]-0.135609[/C][C]-1.0504[/C][C]0.148868[/C][/ROW]
[ROW][C]14[/C][C]-0.141976[/C][C]-1.0997[/C][C]0.137919[/C][/ROW]
[ROW][C]15[/C][C]-0.079408[/C][C]-0.6151[/C][C]0.270409[/C][/ROW]
[ROW][C]16[/C][C]0.071026[/C][C]0.5502[/C][C]0.292124[/C][/ROW]
[ROW][C]17[/C][C]-0.000709[/C][C]-0.0055[/C][C]0.497817[/C][/ROW]
[ROW][C]18[/C][C]-0.141592[/C][C]-1.0968[/C][C]0.138562[/C][/ROW]
[ROW][C]19[/C][C]-0.12256[/C][C]-0.9493[/C][C]0.173127[/C][/ROW]
[ROW][C]20[/C][C]-0.020714[/C][C]-0.1604[/C][C]0.436533[/C][/ROW]
[ROW][C]21[/C][C]0.004165[/C][C]0.0323[/C][C]0.487185[/C][/ROW]
[ROW][C]22[/C][C]-0.022528[/C][C]-0.1745[/C][C]0.43103[/C][/ROW]
[ROW][C]23[/C][C]-0.004671[/C][C]-0.0362[/C][C]0.485628[/C][/ROW]
[ROW][C]24[/C][C]0.097414[/C][C]0.7546[/C][C]0.226731[/C][/ROW]
[ROW][C]25[/C][C]-0.115505[/C][C]-0.8947[/C][C]0.187262[/C][/ROW]
[ROW][C]26[/C][C]-0.030073[/C][C]-0.2329[/C][C]0.408298[/C][/ROW]
[ROW][C]27[/C][C]0.165834[/C][C]1.2845[/C][C]0.101945[/C][/ROW]
[ROW][C]28[/C][C]-0.03495[/C][C]-0.2707[/C][C]0.393766[/C][/ROW]
[ROW][C]29[/C][C]-0.033041[/C][C]-0.2559[/C][C]0.399438[/C][/ROW]
[ROW][C]30[/C][C]-0.06216[/C][C]-0.4815[/C][C]0.315959[/C][/ROW]
[ROW][C]31[/C][C]0.020629[/C][C]0.1598[/C][C]0.43679[/C][/ROW]
[ROW][C]32[/C][C]-0.021343[/C][C]-0.1653[/C][C]0.434623[/C][/ROW]
[ROW][C]33[/C][C]-0.015349[/C][C]-0.1189[/C][C]0.45288[/C][/ROW]
[ROW][C]34[/C][C]-0.061737[/C][C]-0.4782[/C][C]0.317117[/C][/ROW]
[ROW][C]35[/C][C]-0.156404[/C][C]-1.2115[/C][C]0.115227[/C][/ROW]
[ROW][C]36[/C][C]-0.036626[/C][C]-0.2837[/C][C]0.388808[/C][/ROW]
[ROW][C]37[/C][C]-0.034662[/C][C]-0.2685[/C][C]0.394622[/C][/ROW]
[ROW][C]38[/C][C]0.116746[/C][C]0.9043[/C][C]0.184724[/C][/ROW]
[ROW][C]39[/C][C]-0.021308[/C][C]-0.1651[/C][C]0.434729[/C][/ROW]
[ROW][C]40[/C][C]-0.016353[/C][C]-0.1267[/C][C]0.449813[/C][/ROW]
[ROW][C]41[/C][C]0.060879[/C][C]0.4716[/C][C]0.319472[/C][/ROW]
[ROW][C]42[/C][C]0.083767[/C][C]0.6489[/C][C]0.259454[/C][/ROW]
[ROW][C]43[/C][C]0.080984[/C][C]0.6273[/C][C]0.266422[/C][/ROW]
[ROW][C]44[/C][C]-0.056653[/C][C]-0.4388[/C][C]0.33118[/C][/ROW]
[ROW][C]45[/C][C]-0.01184[/C][C]-0.0917[/C][C]0.463615[/C][/ROW]
[ROW][C]46[/C][C]-0.040378[/C][C]-0.3128[/C][C]0.377771[/C][/ROW]
[ROW][C]47[/C][C]-0.046203[/C][C]-0.3579[/C][C]0.360843[/C][/ROW]
[ROW][C]48[/C][C]-0.005551[/C][C]-0.043[/C][C]0.482922[/C][/ROW]
[ROW][C]49[/C][C]0.119291[/C][C]0.924[/C][C]0.179587[/C][/ROW]
[ROW][C]50[/C][C]-0.007912[/C][C]-0.0613[/C][C]0.475668[/C][/ROW]
[ROW][C]51[/C][C]0.044639[/C][C]0.3458[/C][C]0.365363[/C][/ROW]
[ROW][C]52[/C][C]-0.062259[/C][C]-0.4823[/C][C]0.31569[/C][/ROW]
[ROW][C]53[/C][C]-0.007522[/C][C]-0.0583[/C][C]0.476864[/C][/ROW]
[ROW][C]54[/C][C]-0.058322[/C][C]-0.4518[/C][C]0.326537[/C][/ROW]
[ROW][C]55[/C][C]-0.076828[/C][C]-0.5951[/C][C]0.277006[/C][/ROW]
[ROW][C]56[/C][C]-0.002828[/C][C]-0.0219[/C][C]0.491297[/C][/ROW]
[ROW][C]57[/C][C]0.013387[/C][C]0.1037[/C][C]0.45888[/C][/ROW]
[ROW][C]58[/C][C]-0.028227[/C][C]-0.2186[/C][C]0.413834[/C][/ROW]
[ROW][C]59[/C][C]0.083257[/C][C]0.6449[/C][C]0.260724[/C][/ROW]
[ROW][C]60[/C][C]NA[/C][C]NA[/C][C]NA[/C][/ROW]
[/TABLE]
Source: https://freestatistics.org/blog/index.php?pk=118031&T=2

Globally Unique Identifier (entire table): ba.freestatistics.org/blog/index.php?pk=118031&T=2

As an alternative you can also use a QR Code:  

The GUIDs for individual cells are displayed in the table below:

Partial Autocorrelation Function
Time lag kPACF(k)T-STATP-value
10.5758294.46041.8e-05
20.1158270.89720.186601
30.1425731.10440.136922
40.2383841.84650.034876
50.339622.63070.005407
60.2389391.85080.034561
70.2019041.56390.061546
8-0.160776-1.24540.10892
9-0.272578-2.11140.019457
10-0.294584-2.28180.01303
11-0.075521-0.5850.280377
120.3049342.3620.010719
13-0.135609-1.05040.148868
14-0.141976-1.09970.137919
15-0.079408-0.61510.270409
160.0710260.55020.292124
17-0.000709-0.00550.497817
18-0.141592-1.09680.138562
19-0.12256-0.94930.173127
20-0.020714-0.16040.436533
210.0041650.03230.487185
22-0.022528-0.17450.43103
23-0.004671-0.03620.485628
240.0974140.75460.226731
25-0.115505-0.89470.187262
26-0.030073-0.23290.408298
270.1658341.28450.101945
28-0.03495-0.27070.393766
29-0.033041-0.25590.399438
30-0.06216-0.48150.315959
310.0206290.15980.43679
32-0.021343-0.16530.434623
33-0.015349-0.11890.45288
34-0.061737-0.47820.317117
35-0.156404-1.21150.115227
36-0.036626-0.28370.388808
37-0.034662-0.26850.394622
380.1167460.90430.184724
39-0.021308-0.16510.434729
40-0.016353-0.12670.449813
410.0608790.47160.319472
420.0837670.64890.259454
430.0809840.62730.266422
44-0.056653-0.43880.33118
45-0.01184-0.09170.463615
46-0.040378-0.31280.377771
47-0.046203-0.35790.360843
48-0.005551-0.0430.482922
490.1192910.9240.179587
50-0.007912-0.06130.475668
510.0446390.34580.365363
52-0.062259-0.48230.31569
53-0.007522-0.05830.476864
54-0.058322-0.45180.326537
55-0.076828-0.59510.277006
56-0.002828-0.02190.491297
570.0133870.10370.45888
58-0.028227-0.21860.413834
590.0832570.64490.260724
60NANANA


Parameters (Session):
par4 = 12 ;
Parameters (R input):
par1 = 60 ; par2 = 1 ; par3 = 0 ; par4 = 0 ; par5 = 12 ; par6 = White Noise ; par7 = 0.95 ; par8 = ;
R code (references can be found in the software module):
if (par1 == 'Default') {
par1 = 10*log10(length(x))
} else {
par1 <- as.numeric(par1)
}
par2 <- as.numeric(par2)
par3 <- as.numeric(par3)
par4 <- as.numeric(par4)
par5 <- as.numeric(par5)
if (par6 == 'White Noise') par6 <- 'white' else par6 <- 'ma'
par7 <- as.numeric(par7)
if (par8 != '') par8 <- as.numeric(par8)
ox <- x
if (par8 == '') {
if (par2 == 0) {
x <- log(x)
} else {
x <- (x ^ par2 - 1) / par2
}
} else {
x <- log(x,base=par8)
}
if (par3 > 0) x <- diff(x,lag=1,difference=par3)
if (par4 > 0) x <- diff(x,lag=par5,difference=par4)
bitmap(file='picts.png')
op <- par(mfrow=c(2,1))
plot(ox,type='l',main='Original Time Series',xlab='time',ylab='value')
if (par8=='') {
mytitle <- paste('Working Time Series (lambda=',par2,', d=',par3,', D=',par4,')',sep='')
mysub <- paste('(lambda=',par2,', d=',par3,', D=',par4,', CI=', par7, ', CI type=',par6,')',sep='')
} else {
mytitle <- paste('Working Time Series (base=',par8,', d=',par3,', D=',par4,')',sep='')
mysub <- paste('(base=',par8,', d=',par3,', D=',par4,', CI=', par7, ', CI type=',par6,')',sep='')
}
plot(x,type='l', main=mytitle,xlab='time',ylab='value')
par(op)
dev.off()
bitmap(file='pic1.png')
racf <- acf(x, par1, main='Autocorrelation', xlab='time lag', ylab='ACF', ci.type=par6, ci=par7, sub=mysub)
dev.off()
bitmap(file='pic2.png')
rpacf <- pacf(x,par1,main='Partial Autocorrelation',xlab='lags',ylab='PACF',sub=mysub)
dev.off()
(myacf <- c(racf$acf))
(mypacf <- c(rpacf$acf))
lengthx <- length(x)
sqrtn <- sqrt(lengthx)
load(file='createtable')
a<-table.start()
a<-table.row.start(a)
a<-table.element(a,'Autocorrelation Function',4,TRUE)
a<-table.row.end(a)
a<-table.row.start(a)
a<-table.element(a,'Time lag k',header=TRUE)
a<-table.element(a,hyperlink('basics.htm','ACF(k)','click here for more information about the Autocorrelation Function'),header=TRUE)
a<-table.element(a,'T-STAT',header=TRUE)
a<-table.element(a,'P-value',header=TRUE)
a<-table.row.end(a)
for (i in 2:(par1+1)) {
a<-table.row.start(a)
a<-table.element(a,i-1,header=TRUE)
a<-table.element(a,round(myacf[i],6))
mytstat <- myacf[i]*sqrtn
a<-table.element(a,round(mytstat,4))
a<-table.element(a,round(1-pt(abs(mytstat),lengthx),6))
a<-table.row.end(a)
}
a<-table.end(a)
table.save(a,file='mytable.tab')
a<-table.start()
a<-table.row.start(a)
a<-table.element(a,'Partial Autocorrelation Function',4,TRUE)
a<-table.row.end(a)
a<-table.row.start(a)
a<-table.element(a,'Time lag k',header=TRUE)
a<-table.element(a,hyperlink('basics.htm','PACF(k)','click here for more information about the Partial Autocorrelation Function'),header=TRUE)
a<-table.element(a,'T-STAT',header=TRUE)
a<-table.element(a,'P-value',header=TRUE)
a<-table.row.end(a)
for (i in 1:par1) {
a<-table.row.start(a)
a<-table.element(a,i,header=TRUE)
a<-table.element(a,round(mypacf[i],6))
mytstat <- mypacf[i]*sqrtn
a<-table.element(a,round(mytstat,4))
a<-table.element(a,round(1-pt(abs(mytstat),lengthx),6))
a<-table.row.end(a)
}
a<-table.end(a)
table.save(a,file='mytable1.tab')