Free Statistics

of Irreproducible Research!

Author's title

Author*Unverified author*
R Software Modulerwasp_exponentialsmoothing.wasp
Title produced by softwareExponential Smoothing
Date of computationTue, 27 Dec 2011 06:04:42 -0500
Cite this page as followsStatistical Computations at FreeStatistics.org, Office for Research Development and Education, URL https://freestatistics.org/blog/index.php?v=date/2011/Dec/27/t1324984034yhrpm0iox1d8qg0.htm/, Retrieved Wed, 15 May 2024 20:03:19 +0000
Statistical Computations at FreeStatistics.org, Office for Research Development and Education, URL https://freestatistics.org/blog/index.php?pk=160840, Retrieved Wed, 15 May 2024 20:03:19 +0000
QR Codes:

Original text written by user:
IsPrivate?No (this computation is public)
User-defined keywordsKDGP2W102
Estimated Impact120
Family? (F = Feedback message, R = changed R code, M = changed R Module, P = changed Parameters, D = changed Data)
-       [Exponential Smoothing] [Triple exponentia...] [2011-12-27 11:04:42] [a207ad521877ea2910ca3b39cbf26b1e] [Current]
Feedback Forum

Post a new message
Dataseries X:
104,77
111,04
104,5
102,42
103,05
105,84
107,92
108,22
104,26
105,19
103,25
108,16
105,27
113,99
109,84
104,33
105,48
109,68
111,54
110,63
107,8
108,02
105,59
111,64
107
116,14
117,18
102,28
109,43
114,28
117,39
116,66
114,29
114,18
114,12
122,62
115,7
127,91
119,55
115,08
116,63
121,38
123,41
120,7
119,4
116,83
116,4
121,67
116,54
129,61
119,93
117,64
121,01
124,2
125,23
123,24
121,58
120,89
117,77
110,91


Summary of computational transaction
Raw Inputview raw input (R code)
Raw Outputview raw output of R engine
Computing time1 seconds
R Server'Gertrude Mary Cox' @ cox.wessa.net

\begin{tabular}{lllllllll}
\hline
Summary of computational transaction \tabularnewline
Raw Input & view raw input (R code)  \tabularnewline
Raw Output & view raw output of R engine  \tabularnewline
Computing time & 1 seconds \tabularnewline
R Server & 'Gertrude Mary Cox' @ cox.wessa.net \tabularnewline
\hline
\end{tabular}
%Source: https://freestatistics.org/blog/index.php?pk=160840&T=0

[TABLE]
[ROW][C]Summary of computational transaction[/C][/ROW]
[ROW][C]Raw Input[/C][C]view raw input (R code) [/C][/ROW]
[ROW][C]Raw Output[/C][C]view raw output of R engine [/C][/ROW]
[ROW][C]Computing time[/C][C]1 seconds[/C][/ROW]
[ROW][C]R Server[/C][C]'Gertrude Mary Cox' @ cox.wessa.net[/C][/ROW]
[/TABLE]
Source: https://freestatistics.org/blog/index.php?pk=160840&T=0

Globally Unique Identifier (entire table): ba.freestatistics.org/blog/index.php?pk=160840&T=0

As an alternative you can also use a QR Code:  

The GUIDs for individual cells are displayed in the table below:

Summary of computational transaction
Raw Inputview raw input (R code)
Raw Outputview raw output of R engine
Computing time1 seconds
R Server'Gertrude Mary Cox' @ cox.wessa.net


Estimated Parameters of Exponential Smoothing
ParameterValue
alpha0.377786007890681
beta0.110327882039191
gamma0

\begin{tabular}{lllllllll}
\hline
Estimated Parameters of Exponential Smoothing \tabularnewline
Parameter & Value \tabularnewline
alpha & 0.377786007890681 \tabularnewline
beta & 0.110327882039191 \tabularnewline
gamma & 0 \tabularnewline
\hline
\end{tabular}
%Source: https://freestatistics.org/blog/index.php?pk=160840&T=1

[TABLE]
[ROW][C]Estimated Parameters of Exponential Smoothing[/C][/ROW]
[ROW][C]Parameter[/C][C]Value[/C][/ROW]
[ROW][C]alpha[/C][C]0.377786007890681[/C][/ROW]
[ROW][C]beta[/C][C]0.110327882039191[/C][/ROW]
[ROW][C]gamma[/C][C]0[/C][/ROW]
[/TABLE]
Source: https://freestatistics.org/blog/index.php?pk=160840&T=1

Globally Unique Identifier (entire table): ba.freestatistics.org/blog/index.php?pk=160840&T=1

As an alternative you can also use a QR Code:  

The GUIDs for individual cells are displayed in the table below:

Estimated Parameters of Exponential Smoothing
ParameterValue
alpha0.377786007890681
beta0.110327882039191
gamma0


Interpolation Forecasts of Exponential Smoothing
tObservedFittedResiduals
13105.27103.6851148504271.58488514957266
14113.99113.0761373121190.913862687880936
15109.84109.3850803086470.454919691353055
16104.33104.1621022655780.167897734421587
17105.48105.54768937622-0.0676893762199313
18109.68109.864370323942-0.184370323942261
19111.54111.1784528929290.361547107070891
20110.63111.863428164924-1.23342816492436
21107.8107.4327677364750.367232263525224
22108.02108.555454116584-0.535454116583566
23105.59106.566050308433-0.976050308433329
24111.64111.1390966581420.500903341858304
25107108.441409914544-1.44140991454412
26116.14116.619449292002-0.479449292001789
27117.18112.2742536613674.90574633863274
28102.28108.790482716593-6.51048271659329
29109.43107.4324611030471.99753889695329
30114.28112.3948257572381.88517424276199
31117.39114.4424819687232.94751803127706
32116.66116.1639136569740.496086343025837
33114.29112.518239129981.77176087001975
34114.18114.361677501187-0.181677501187139
35114.12112.7108118102511.40918818974856
36122.62118.489271680064.13072831993976
37115.7117.618478117624-1.91847811762382
38127.91126.0519995363071.85800046369324
39119.55123.122997128123-3.57299712812332
40115.08116.615816121065-1.53581612106484
41116.63117.524240271092-0.894240271092357
42121.38121.660687237206-0.280687237205782
43123.41123.0663934845810.343606515418585
44120.7123.871854142838-3.17185414283759
45119.4118.7553523586990.644647641301134
46116.83120.040874007528-3.21087400752796
47116.4116.98725323572-0.587253235719601
48121.67121.6699061061199.38938805603584e-05
49116.54118.724871084052-2.18487108405155
50129.61126.5329040508823.07709594911806
51119.93123.590422245113-3.66042224511281
52117.64116.5725327301191.06746726988084
53121.01118.0952661089382.91473389106166
54124.2123.4602747075260.739725292474475
55125.23125.0835941515760.146405848424308
56123.24125.638451388881-2.39845138888057
57121.58120.6702622575330.909737742466731
58120.89121.923112194222-1.03311219422207
59117.77119.650170152098-1.88017015209796
60110.91123.748438686338-12.8384386863381

\begin{tabular}{lllllllll}
\hline
Interpolation Forecasts of Exponential Smoothing \tabularnewline
t & Observed & Fitted & Residuals \tabularnewline
13 & 105.27 & 103.685114850427 & 1.58488514957266 \tabularnewline
14 & 113.99 & 113.076137312119 & 0.913862687880936 \tabularnewline
15 & 109.84 & 109.385080308647 & 0.454919691353055 \tabularnewline
16 & 104.33 & 104.162102265578 & 0.167897734421587 \tabularnewline
17 & 105.48 & 105.54768937622 & -0.0676893762199313 \tabularnewline
18 & 109.68 & 109.864370323942 & -0.184370323942261 \tabularnewline
19 & 111.54 & 111.178452892929 & 0.361547107070891 \tabularnewline
20 & 110.63 & 111.863428164924 & -1.23342816492436 \tabularnewline
21 & 107.8 & 107.432767736475 & 0.367232263525224 \tabularnewline
22 & 108.02 & 108.555454116584 & -0.535454116583566 \tabularnewline
23 & 105.59 & 106.566050308433 & -0.976050308433329 \tabularnewline
24 & 111.64 & 111.139096658142 & 0.500903341858304 \tabularnewline
25 & 107 & 108.441409914544 & -1.44140991454412 \tabularnewline
26 & 116.14 & 116.619449292002 & -0.479449292001789 \tabularnewline
27 & 117.18 & 112.274253661367 & 4.90574633863274 \tabularnewline
28 & 102.28 & 108.790482716593 & -6.51048271659329 \tabularnewline
29 & 109.43 & 107.432461103047 & 1.99753889695329 \tabularnewline
30 & 114.28 & 112.394825757238 & 1.88517424276199 \tabularnewline
31 & 117.39 & 114.442481968723 & 2.94751803127706 \tabularnewline
32 & 116.66 & 116.163913656974 & 0.496086343025837 \tabularnewline
33 & 114.29 & 112.51823912998 & 1.77176087001975 \tabularnewline
34 & 114.18 & 114.361677501187 & -0.181677501187139 \tabularnewline
35 & 114.12 & 112.710811810251 & 1.40918818974856 \tabularnewline
36 & 122.62 & 118.48927168006 & 4.13072831993976 \tabularnewline
37 & 115.7 & 117.618478117624 & -1.91847811762382 \tabularnewline
38 & 127.91 & 126.051999536307 & 1.85800046369324 \tabularnewline
39 & 119.55 & 123.122997128123 & -3.57299712812332 \tabularnewline
40 & 115.08 & 116.615816121065 & -1.53581612106484 \tabularnewline
41 & 116.63 & 117.524240271092 & -0.894240271092357 \tabularnewline
42 & 121.38 & 121.660687237206 & -0.280687237205782 \tabularnewline
43 & 123.41 & 123.066393484581 & 0.343606515418585 \tabularnewline
44 & 120.7 & 123.871854142838 & -3.17185414283759 \tabularnewline
45 & 119.4 & 118.755352358699 & 0.644647641301134 \tabularnewline
46 & 116.83 & 120.040874007528 & -3.21087400752796 \tabularnewline
47 & 116.4 & 116.98725323572 & -0.587253235719601 \tabularnewline
48 & 121.67 & 121.669906106119 & 9.38938805603584e-05 \tabularnewline
49 & 116.54 & 118.724871084052 & -2.18487108405155 \tabularnewline
50 & 129.61 & 126.532904050882 & 3.07709594911806 \tabularnewline
51 & 119.93 & 123.590422245113 & -3.66042224511281 \tabularnewline
52 & 117.64 & 116.572532730119 & 1.06746726988084 \tabularnewline
53 & 121.01 & 118.095266108938 & 2.91473389106166 \tabularnewline
54 & 124.2 & 123.460274707526 & 0.739725292474475 \tabularnewline
55 & 125.23 & 125.083594151576 & 0.146405848424308 \tabularnewline
56 & 123.24 & 125.638451388881 & -2.39845138888057 \tabularnewline
57 & 121.58 & 120.670262257533 & 0.909737742466731 \tabularnewline
58 & 120.89 & 121.923112194222 & -1.03311219422207 \tabularnewline
59 & 117.77 & 119.650170152098 & -1.88017015209796 \tabularnewline
60 & 110.91 & 123.748438686338 & -12.8384386863381 \tabularnewline
\hline
\end{tabular}
%Source: https://freestatistics.org/blog/index.php?pk=160840&T=2

[TABLE]
[ROW][C]Interpolation Forecasts of Exponential Smoothing[/C][/ROW]
[ROW][C]t[/C][C]Observed[/C][C]Fitted[/C][C]Residuals[/C][/ROW]
[ROW][C]13[/C][C]105.27[/C][C]103.685114850427[/C][C]1.58488514957266[/C][/ROW]
[ROW][C]14[/C][C]113.99[/C][C]113.076137312119[/C][C]0.913862687880936[/C][/ROW]
[ROW][C]15[/C][C]109.84[/C][C]109.385080308647[/C][C]0.454919691353055[/C][/ROW]
[ROW][C]16[/C][C]104.33[/C][C]104.162102265578[/C][C]0.167897734421587[/C][/ROW]
[ROW][C]17[/C][C]105.48[/C][C]105.54768937622[/C][C]-0.0676893762199313[/C][/ROW]
[ROW][C]18[/C][C]109.68[/C][C]109.864370323942[/C][C]-0.184370323942261[/C][/ROW]
[ROW][C]19[/C][C]111.54[/C][C]111.178452892929[/C][C]0.361547107070891[/C][/ROW]
[ROW][C]20[/C][C]110.63[/C][C]111.863428164924[/C][C]-1.23342816492436[/C][/ROW]
[ROW][C]21[/C][C]107.8[/C][C]107.432767736475[/C][C]0.367232263525224[/C][/ROW]
[ROW][C]22[/C][C]108.02[/C][C]108.555454116584[/C][C]-0.535454116583566[/C][/ROW]
[ROW][C]23[/C][C]105.59[/C][C]106.566050308433[/C][C]-0.976050308433329[/C][/ROW]
[ROW][C]24[/C][C]111.64[/C][C]111.139096658142[/C][C]0.500903341858304[/C][/ROW]
[ROW][C]25[/C][C]107[/C][C]108.441409914544[/C][C]-1.44140991454412[/C][/ROW]
[ROW][C]26[/C][C]116.14[/C][C]116.619449292002[/C][C]-0.479449292001789[/C][/ROW]
[ROW][C]27[/C][C]117.18[/C][C]112.274253661367[/C][C]4.90574633863274[/C][/ROW]
[ROW][C]28[/C][C]102.28[/C][C]108.790482716593[/C][C]-6.51048271659329[/C][/ROW]
[ROW][C]29[/C][C]109.43[/C][C]107.432461103047[/C][C]1.99753889695329[/C][/ROW]
[ROW][C]30[/C][C]114.28[/C][C]112.394825757238[/C][C]1.88517424276199[/C][/ROW]
[ROW][C]31[/C][C]117.39[/C][C]114.442481968723[/C][C]2.94751803127706[/C][/ROW]
[ROW][C]32[/C][C]116.66[/C][C]116.163913656974[/C][C]0.496086343025837[/C][/ROW]
[ROW][C]33[/C][C]114.29[/C][C]112.51823912998[/C][C]1.77176087001975[/C][/ROW]
[ROW][C]34[/C][C]114.18[/C][C]114.361677501187[/C][C]-0.181677501187139[/C][/ROW]
[ROW][C]35[/C][C]114.12[/C][C]112.710811810251[/C][C]1.40918818974856[/C][/ROW]
[ROW][C]36[/C][C]122.62[/C][C]118.48927168006[/C][C]4.13072831993976[/C][/ROW]
[ROW][C]37[/C][C]115.7[/C][C]117.618478117624[/C][C]-1.91847811762382[/C][/ROW]
[ROW][C]38[/C][C]127.91[/C][C]126.051999536307[/C][C]1.85800046369324[/C][/ROW]
[ROW][C]39[/C][C]119.55[/C][C]123.122997128123[/C][C]-3.57299712812332[/C][/ROW]
[ROW][C]40[/C][C]115.08[/C][C]116.615816121065[/C][C]-1.53581612106484[/C][/ROW]
[ROW][C]41[/C][C]116.63[/C][C]117.524240271092[/C][C]-0.894240271092357[/C][/ROW]
[ROW][C]42[/C][C]121.38[/C][C]121.660687237206[/C][C]-0.280687237205782[/C][/ROW]
[ROW][C]43[/C][C]123.41[/C][C]123.066393484581[/C][C]0.343606515418585[/C][/ROW]
[ROW][C]44[/C][C]120.7[/C][C]123.871854142838[/C][C]-3.17185414283759[/C][/ROW]
[ROW][C]45[/C][C]119.4[/C][C]118.755352358699[/C][C]0.644647641301134[/C][/ROW]
[ROW][C]46[/C][C]116.83[/C][C]120.040874007528[/C][C]-3.21087400752796[/C][/ROW]
[ROW][C]47[/C][C]116.4[/C][C]116.98725323572[/C][C]-0.587253235719601[/C][/ROW]
[ROW][C]48[/C][C]121.67[/C][C]121.669906106119[/C][C]9.38938805603584e-05[/C][/ROW]
[ROW][C]49[/C][C]116.54[/C][C]118.724871084052[/C][C]-2.18487108405155[/C][/ROW]
[ROW][C]50[/C][C]129.61[/C][C]126.532904050882[/C][C]3.07709594911806[/C][/ROW]
[ROW][C]51[/C][C]119.93[/C][C]123.590422245113[/C][C]-3.66042224511281[/C][/ROW]
[ROW][C]52[/C][C]117.64[/C][C]116.572532730119[/C][C]1.06746726988084[/C][/ROW]
[ROW][C]53[/C][C]121.01[/C][C]118.095266108938[/C][C]2.91473389106166[/C][/ROW]
[ROW][C]54[/C][C]124.2[/C][C]123.460274707526[/C][C]0.739725292474475[/C][/ROW]
[ROW][C]55[/C][C]125.23[/C][C]125.083594151576[/C][C]0.146405848424308[/C][/ROW]
[ROW][C]56[/C][C]123.24[/C][C]125.638451388881[/C][C]-2.39845138888057[/C][/ROW]
[ROW][C]57[/C][C]121.58[/C][C]120.670262257533[/C][C]0.909737742466731[/C][/ROW]
[ROW][C]58[/C][C]120.89[/C][C]121.923112194222[/C][C]-1.03311219422207[/C][/ROW]
[ROW][C]59[/C][C]117.77[/C][C]119.650170152098[/C][C]-1.88017015209796[/C][/ROW]
[ROW][C]60[/C][C]110.91[/C][C]123.748438686338[/C][C]-12.8384386863381[/C][/ROW]
[/TABLE]
Source: https://freestatistics.org/blog/index.php?pk=160840&T=2

Globally Unique Identifier (entire table): ba.freestatistics.org/blog/index.php?pk=160840&T=2

As an alternative you can also use a QR Code:  

The GUIDs for individual cells are displayed in the table below:

Interpolation Forecasts of Exponential Smoothing
tObservedFittedResiduals
13105.27103.6851148504271.58488514957266
14113.99113.0761373121190.913862687880936
15109.84109.3850803086470.454919691353055
16104.33104.1621022655780.167897734421587
17105.48105.54768937622-0.0676893762199313
18109.68109.864370323942-0.184370323942261
19111.54111.1784528929290.361547107070891
20110.63111.863428164924-1.23342816492436
21107.8107.4327677364750.367232263525224
22108.02108.555454116584-0.535454116583566
23105.59106.566050308433-0.976050308433329
24111.64111.1390966581420.500903341858304
25107108.441409914544-1.44140991454412
26116.14116.619449292002-0.479449292001789
27117.18112.2742536613674.90574633863274
28102.28108.790482716593-6.51048271659329
29109.43107.4324611030471.99753889695329
30114.28112.3948257572381.88517424276199
31117.39114.4424819687232.94751803127706
32116.66116.1639136569740.496086343025837
33114.29112.518239129981.77176087001975
34114.18114.361677501187-0.181677501187139
35114.12112.7108118102511.40918818974856
36122.62118.489271680064.13072831993976
37115.7117.618478117624-1.91847811762382
38127.91126.0519995363071.85800046369324
39119.55123.122997128123-3.57299712812332
40115.08116.615816121065-1.53581612106484
41116.63117.524240271092-0.894240271092357
42121.38121.660687237206-0.280687237205782
43123.41123.0663934845810.343606515418585
44120.7123.871854142838-3.17185414283759
45119.4118.7553523586990.644647641301134
46116.83120.040874007528-3.21087400752796
47116.4116.98725323572-0.587253235719601
48121.67121.6699061061199.38938805603584e-05
49116.54118.724871084052-2.18487108405155
50129.61126.5329040508823.07709594911806
51119.93123.590422245113-3.66042224511281
52117.64116.5725327301191.06746726988084
53121.01118.0952661089382.91473389106166
54124.2123.4602747075260.739725292474475
55125.23125.0835941515760.146405848424308
56123.24125.638451388881-2.39845138888057
57121.58120.6702622575330.909737742466731
58120.89121.923112194222-1.03311219422207
59117.77119.650170152098-1.88017015209796
60110.91123.748438686338-12.8384386863381


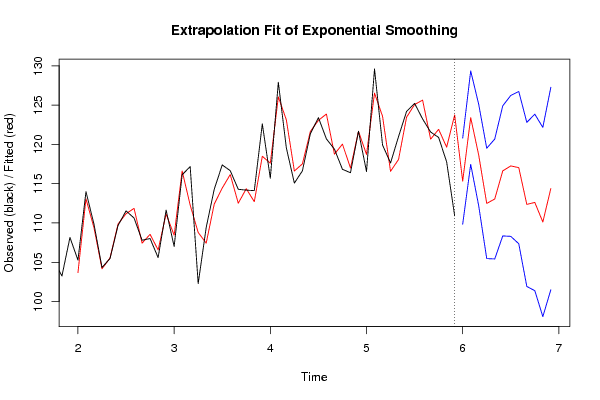
Extrapolation Forecasts of Exponential Smoothing
tForecast95% Lower Bound95% Upper Bound
61115.322133001697109.839348604989120.804917398406
62123.415593149251117.469989325173129.361196973329
63118.642386630138112.181516073834125.103257186442
64112.491680111025105.467201343446119.516158878603
65113.050973591912105.418410959117120.683536224707
66116.633183739465108.351551884236124.914815594695
67117.264560553685108.295949169512126.233171937859
68117.045520701239107.354692514446126.736348888032
69112.364814182126101.918841023987122.810787340264
70112.617440996346101.385386435304123.849495557388
71110.12131781056698.0739661949996122.168669426133
72114.39477795812101.5044057463127.28515016994

\begin{tabular}{lllllllll}
\hline
Extrapolation Forecasts of Exponential Smoothing \tabularnewline
t & Forecast & 95% Lower Bound & 95% Upper Bound \tabularnewline
61 & 115.322133001697 & 109.839348604989 & 120.804917398406 \tabularnewline
62 & 123.415593149251 & 117.469989325173 & 129.361196973329 \tabularnewline
63 & 118.642386630138 & 112.181516073834 & 125.103257186442 \tabularnewline
64 & 112.491680111025 & 105.467201343446 & 119.516158878603 \tabularnewline
65 & 113.050973591912 & 105.418410959117 & 120.683536224707 \tabularnewline
66 & 116.633183739465 & 108.351551884236 & 124.914815594695 \tabularnewline
67 & 117.264560553685 & 108.295949169512 & 126.233171937859 \tabularnewline
68 & 117.045520701239 & 107.354692514446 & 126.736348888032 \tabularnewline
69 & 112.364814182126 & 101.918841023987 & 122.810787340264 \tabularnewline
70 & 112.617440996346 & 101.385386435304 & 123.849495557388 \tabularnewline
71 & 110.121317810566 & 98.0739661949996 & 122.168669426133 \tabularnewline
72 & 114.39477795812 & 101.5044057463 & 127.28515016994 \tabularnewline
\hline
\end{tabular}
%Source: https://freestatistics.org/blog/index.php?pk=160840&T=3

[TABLE]
[ROW][C]Extrapolation Forecasts of Exponential Smoothing[/C][/ROW]
[ROW][C]t[/C][C]Forecast[/C][C]95% Lower Bound[/C][C]95% Upper Bound[/C][/ROW]
[ROW][C]61[/C][C]115.322133001697[/C][C]109.839348604989[/C][C]120.804917398406[/C][/ROW]
[ROW][C]62[/C][C]123.415593149251[/C][C]117.469989325173[/C][C]129.361196973329[/C][/ROW]
[ROW][C]63[/C][C]118.642386630138[/C][C]112.181516073834[/C][C]125.103257186442[/C][/ROW]
[ROW][C]64[/C][C]112.491680111025[/C][C]105.467201343446[/C][C]119.516158878603[/C][/ROW]
[ROW][C]65[/C][C]113.050973591912[/C][C]105.418410959117[/C][C]120.683536224707[/C][/ROW]
[ROW][C]66[/C][C]116.633183739465[/C][C]108.351551884236[/C][C]124.914815594695[/C][/ROW]
[ROW][C]67[/C][C]117.264560553685[/C][C]108.295949169512[/C][C]126.233171937859[/C][/ROW]
[ROW][C]68[/C][C]117.045520701239[/C][C]107.354692514446[/C][C]126.736348888032[/C][/ROW]
[ROW][C]69[/C][C]112.364814182126[/C][C]101.918841023987[/C][C]122.810787340264[/C][/ROW]
[ROW][C]70[/C][C]112.617440996346[/C][C]101.385386435304[/C][C]123.849495557388[/C][/ROW]
[ROW][C]71[/C][C]110.121317810566[/C][C]98.0739661949996[/C][C]122.168669426133[/C][/ROW]
[ROW][C]72[/C][C]114.39477795812[/C][C]101.5044057463[/C][C]127.28515016994[/C][/ROW]
[/TABLE]
Source: https://freestatistics.org/blog/index.php?pk=160840&T=3

Globally Unique Identifier (entire table): ba.freestatistics.org/blog/index.php?pk=160840&T=3

As an alternative you can also use a QR Code:  

The GUIDs for individual cells are displayed in the table below:

Extrapolation Forecasts of Exponential Smoothing
tForecast95% Lower Bound95% Upper Bound
61115.322133001697109.839348604989120.804917398406
62123.415593149251117.469989325173129.361196973329
63118.642386630138112.181516073834125.103257186442
64112.491680111025105.467201343446119.516158878603
65113.050973591912105.418410959117120.683536224707
66116.633183739465108.351551884236124.914815594695
67117.264560553685108.295949169512126.233171937859
68117.045520701239107.354692514446126.736348888032
69112.364814182126101.918841023987122.810787340264
70112.617440996346101.385386435304123.849495557388
71110.12131781056698.0739661949996122.168669426133
72114.39477795812101.5044057463127.28515016994


Parameters (Session):
par1 = 12 ; par2 = Triple ; par3 = additive ;
Parameters (R input):
par1 = 12 ; par2 = Triple ; par3 = additive ;
R code (references can be found in the software module):
par1 <- as.numeric(par1)
if (par2 == 'Single') K <- 1
if (par2 == 'Double') K <- 2
if (par2 == 'Triple') K <- par1
nx <- length(x)
nxmK <- nx - K
x <- ts(x, frequency = par1)
if (par2 == 'Single') fit <- HoltWinters(x, gamma=F, beta=F)
if (par2 == 'Double') fit <- HoltWinters(x, gamma=F)
if (par2 == 'Triple') fit <- HoltWinters(x, seasonal=par3)
fit
myresid <- x - fit$fitted[,'xhat']
bitmap(file='test1.png')
op <- par(mfrow=c(2,1))
plot(fit,ylab='Observed (black) / Fitted (red)',main='Interpolation Fit of Exponential Smoothing')
plot(myresid,ylab='Residuals',main='Interpolation Prediction Errors')
par(op)
dev.off()
bitmap(file='test2.png')
p <- predict(fit, par1, prediction.interval=TRUE)
np <- length(p[,1])
plot(fit,p,ylab='Observed (black) / Fitted (red)',main='Extrapolation Fit of Exponential Smoothing')
dev.off()
bitmap(file='test3.png')
op <- par(mfrow = c(2,2))
acf(as.numeric(myresid),lag.max = nx/2,main='Residual ACF')
spectrum(myresid,main='Residals Periodogram')
cpgram(myresid,main='Residal Cumulative Periodogram')
qqnorm(myresid,main='Residual Normal QQ Plot')
qqline(myresid)
par(op)
dev.off()
load(file='createtable')
a<-table.start()
a<-table.row.start(a)
a<-table.element(a,'Estimated Parameters of Exponential Smoothing',2,TRUE)
a<-table.row.end(a)
a<-table.row.start(a)
a<-table.element(a,'Parameter',header=TRUE)
a<-table.element(a,'Value',header=TRUE)
a<-table.row.end(a)
a<-table.row.start(a)
a<-table.element(a,'alpha',header=TRUE)
a<-table.element(a,fit$alpha)
a<-table.row.end(a)
a<-table.row.start(a)
a<-table.element(a,'beta',header=TRUE)
a<-table.element(a,fit$beta)
a<-table.row.end(a)
a<-table.row.start(a)
a<-table.element(a,'gamma',header=TRUE)
a<-table.element(a,fit$gamma)
a<-table.row.end(a)
a<-table.end(a)
table.save(a,file='mytable.tab')
a<-table.start()
a<-table.row.start(a)
a<-table.element(a,'Interpolation Forecasts of Exponential Smoothing',4,TRUE)
a<-table.row.end(a)
a<-table.row.start(a)
a<-table.element(a,'t',header=TRUE)
a<-table.element(a,'Observed',header=TRUE)
a<-table.element(a,'Fitted',header=TRUE)
a<-table.element(a,'Residuals',header=TRUE)
a<-table.row.end(a)
for (i in 1:nxmK) {
a<-table.row.start(a)
a<-table.element(a,i+K,header=TRUE)
a<-table.element(a,x[i+K])
a<-table.element(a,fit$fitted[i,'xhat'])
a<-table.element(a,myresid[i])
a<-table.row.end(a)
}
a<-table.end(a)
table.save(a,file='mytable1.tab')
a<-table.start()
a<-table.row.start(a)
a<-table.element(a,'Extrapolation Forecasts of Exponential Smoothing',4,TRUE)
a<-table.row.end(a)
a<-table.row.start(a)
a<-table.element(a,'t',header=TRUE)
a<-table.element(a,'Forecast',header=TRUE)
a<-table.element(a,'95% Lower Bound',header=TRUE)
a<-table.element(a,'95% Upper Bound',header=TRUE)
a<-table.row.end(a)
for (i in 1:np) {
a<-table.row.start(a)
a<-table.element(a,nx+i,header=TRUE)
a<-table.element(a,p[i,'fit'])
a<-table.element(a,p[i,'lwr'])
a<-table.element(a,p[i,'upr'])
a<-table.row.end(a)
}
a<-table.end(a)
table.save(a,file='mytable2.tab')