Free Statistics

of Irreproducible Research!

Author's title

Author*The author of this computation has been verified*
R Software Modulerwasp_exponentialsmoothing.wasp
Title produced by softwareExponential Smoothing
Date of computationMon, 19 Dec 2011 11:33:14 -0500
Cite this page as followsStatistical Computations at FreeStatistics.org, Office for Research Development and Education, URL https://freestatistics.org/blog/index.php?v=date/2011/Dec/19/t1324329582jm2loxfe9nrsbty.htm/, Retrieved Wed, 15 May 2024 19:47:44 +0000
Statistical Computations at FreeStatistics.org, Office for Research Development and Education, URL https://freestatistics.org/blog/index.php?pk=157698, Retrieved Wed, 15 May 2024 19:47:44 +0000
QR Codes:

Original text written by user:
IsPrivate?No (this computation is public)
User-defined keywords
Estimated Impact73
Family? (F = Feedback message, R = changed R code, M = changed R Module, P = changed Parameters, D = changed Data)
-       [Exponential Smoothing] [exponential smoot...] [2011-12-19 16:33:14] [de50302416ae5d0bdedd77e4c0468c33] [Current]
Feedback Forum

Post a new message
Dataseries X:
41
39
50
40
43
38
44
35
39
35
29
49
50
59
63
32
39
47
53
60
57
52
70
90
74
62
55
84
94
70
108
139
120
97
126
149
158
124
140
109
114
77
120
133
110
92
97
78
99
107
112
90
98
125
155
190
236
189
174
178
136
161
171
149
184
155
276
224
213
279
268
287


Summary of computational transaction
Raw Inputview raw input (R code)
Raw Outputview raw output of R engine
Computing time1 seconds
R Server'Gertrude Mary Cox' @ cox.wessa.net

\begin{tabular}{lllllllll}
\hline
Summary of computational transaction \tabularnewline
Raw Input & view raw input (R code)  \tabularnewline
Raw Output & view raw output of R engine  \tabularnewline
Computing time & 1 seconds \tabularnewline
R Server & 'Gertrude Mary Cox' @ cox.wessa.net \tabularnewline
\hline
\end{tabular}
%Source: https://freestatistics.org/blog/index.php?pk=157698&T=0

[TABLE]
[ROW][C]Summary of computational transaction[/C][/ROW]
[ROW][C]Raw Input[/C][C]view raw input (R code) [/C][/ROW]
[ROW][C]Raw Output[/C][C]view raw output of R engine [/C][/ROW]
[ROW][C]Computing time[/C][C]1 seconds[/C][/ROW]
[ROW][C]R Server[/C][C]'Gertrude Mary Cox' @ cox.wessa.net[/C][/ROW]
[/TABLE]
Source: https://freestatistics.org/blog/index.php?pk=157698&T=0

Globally Unique Identifier (entire table): ba.freestatistics.org/blog/index.php?pk=157698&T=0

As an alternative you can also use a QR Code:  

The GUIDs for individual cells are displayed in the table below:

Summary of computational transaction
Raw Inputview raw input (R code)
Raw Outputview raw output of R engine
Computing time1 seconds
R Server'Gertrude Mary Cox' @ cox.wessa.net


Estimated Parameters of Exponential Smoothing
ParameterValue
alpha0.620537316943013
beta0
gamma0.691764685631533

\begin{tabular}{lllllllll}
\hline
Estimated Parameters of Exponential Smoothing \tabularnewline
Parameter & Value \tabularnewline
alpha & 0.620537316943013 \tabularnewline
beta & 0 \tabularnewline
gamma & 0.691764685631533 \tabularnewline
\hline
\end{tabular}
%Source: https://freestatistics.org/blog/index.php?pk=157698&T=1

[TABLE]
[ROW][C]Estimated Parameters of Exponential Smoothing[/C][/ROW]
[ROW][C]Parameter[/C][C]Value[/C][/ROW]
[ROW][C]alpha[/C][C]0.620537316943013[/C][/ROW]
[ROW][C]beta[/C][C]0[/C][/ROW]
[ROW][C]gamma[/C][C]0.691764685631533[/C][/ROW]
[/TABLE]
Source: https://freestatistics.org/blog/index.php?pk=157698&T=1

Globally Unique Identifier (entire table): ba.freestatistics.org/blog/index.php?pk=157698&T=1

As an alternative you can also use a QR Code:  

The GUIDs for individual cells are displayed in the table below:

Estimated Parameters of Exponential Smoothing
ParameterValue
alpha0.620537316943013
beta0
gamma0.691764685631533


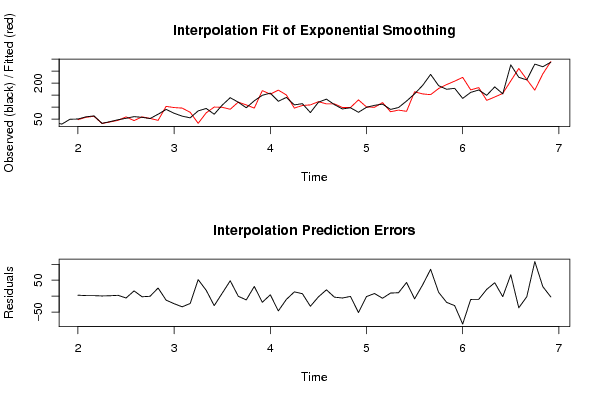
Interpolation Forecasts of Exponential Smoothing
tObservedFittedResiduals
135047.10543991015492.89456008984506
145957.30566657822681.69433342177321
156361.38623387140841.61376612859157
163231.44874041149780.551259588502219
173937.73280078874881.26719921125117
184744.43447585051342.56552414948664
195358.8749883873631-5.87498838736315
206043.566648464560816.4333515354392
215758.9755506005693-1.97555060056932
225252.4500643078582-0.450064307858213
237044.4632889321725.53671106783
2490102.639431689157-12.6394316891575
257497.8041025728887-23.8041025728887
266295.5892680762729-33.5892680762729
275578.1655338329924-23.1655338329924
288432.073223035127651.9267769648724
299475.776931188146918.2230688118531
307099.8776285514012-29.8776285514012
3110898.83407652649739.1659234735027
3213990.697525669481748.3024743305183
33120120.392214330597-0.392214330596829
3497108.90525698292-11.9052569829201
3512695.582214936092130.4177850639079
36149168.330866382641-19.3308663826413
37158153.7462277665534.25377223344677
38124170.421364402635-46.4213644026349
39140150.380308183253-10.3803081832532
4010995.658411923031513.3415880769685
41114106.3279589122057.67204108779541
4277108.94862805934-31.9486280593396
43120122.36221453824-2.36221453824029
44133113.17934869082819.8206513091719
45110113.245598657526-3.24559865752562
469297.8645369957318-5.86453699573184
479797.9564271836312-0.95642718363122
4878129.743045937555-51.7430459375551
4999100.360901088761-1.36090108876115
5010798.83529228351568.16470771648443
51112118.690264912725-6.69026491272541
529080.37243816414949.62756183585061
539887.178675541766310.8213244582337
5412582.066251928983442.9337480710166
55155163.507873443503-8.50787344350337
56190154.71050738024835.2894926197517
57236151.53541417821584.4645858217852
58189177.16675939344411.8332406065563
59174193.639681434782-19.6396814347821
60178207.840037629498-29.8400376294979
61136223.790542277062-87.7905422770622
62161171.414285740981-10.4142857409815
63171181.082803529836-10.0828035298362
64149127.7246803553921.2753196446103
65184141.87943102119242.1205689788078
66155156.685781517955-1.68578151795543
67276208.77391179715367.2260882028468
68224260.740031459137-36.7400314591368
69213214.776086180959-1.77608618095883
70279170.279548518324108.720451481676
71268238.1811000036729.8188999963298
72287289.658411286008-2.65841128600823

\begin{tabular}{lllllllll}
\hline
Interpolation Forecasts of Exponential Smoothing \tabularnewline
t & Observed & Fitted & Residuals \tabularnewline
13 & 50 & 47.1054399101549 & 2.89456008984506 \tabularnewline
14 & 59 & 57.3056665782268 & 1.69433342177321 \tabularnewline
15 & 63 & 61.3862338714084 & 1.61376612859157 \tabularnewline
16 & 32 & 31.4487404114978 & 0.551259588502219 \tabularnewline
17 & 39 & 37.7328007887488 & 1.26719921125117 \tabularnewline
18 & 47 & 44.4344758505134 & 2.56552414948664 \tabularnewline
19 & 53 & 58.8749883873631 & -5.87498838736315 \tabularnewline
20 & 60 & 43.5666484645608 & 16.4333515354392 \tabularnewline
21 & 57 & 58.9755506005693 & -1.97555060056932 \tabularnewline
22 & 52 & 52.4500643078582 & -0.450064307858213 \tabularnewline
23 & 70 & 44.46328893217 & 25.53671106783 \tabularnewline
24 & 90 & 102.639431689157 & -12.6394316891575 \tabularnewline
25 & 74 & 97.8041025728887 & -23.8041025728887 \tabularnewline
26 & 62 & 95.5892680762729 & -33.5892680762729 \tabularnewline
27 & 55 & 78.1655338329924 & -23.1655338329924 \tabularnewline
28 & 84 & 32.0732230351276 & 51.9267769648724 \tabularnewline
29 & 94 & 75.7769311881469 & 18.2230688118531 \tabularnewline
30 & 70 & 99.8776285514012 & -29.8776285514012 \tabularnewline
31 & 108 & 98.8340765264973 & 9.1659234735027 \tabularnewline
32 & 139 & 90.6975256694817 & 48.3024743305183 \tabularnewline
33 & 120 & 120.392214330597 & -0.392214330596829 \tabularnewline
34 & 97 & 108.90525698292 & -11.9052569829201 \tabularnewline
35 & 126 & 95.5822149360921 & 30.4177850639079 \tabularnewline
36 & 149 & 168.330866382641 & -19.3308663826413 \tabularnewline
37 & 158 & 153.746227766553 & 4.25377223344677 \tabularnewline
38 & 124 & 170.421364402635 & -46.4213644026349 \tabularnewline
39 & 140 & 150.380308183253 & -10.3803081832532 \tabularnewline
40 & 109 & 95.6584119230315 & 13.3415880769685 \tabularnewline
41 & 114 & 106.327958912205 & 7.67204108779541 \tabularnewline
42 & 77 & 108.94862805934 & -31.9486280593396 \tabularnewline
43 & 120 & 122.36221453824 & -2.36221453824029 \tabularnewline
44 & 133 & 113.179348690828 & 19.8206513091719 \tabularnewline
45 & 110 & 113.245598657526 & -3.24559865752562 \tabularnewline
46 & 92 & 97.8645369957318 & -5.86453699573184 \tabularnewline
47 & 97 & 97.9564271836312 & -0.95642718363122 \tabularnewline
48 & 78 & 129.743045937555 & -51.7430459375551 \tabularnewline
49 & 99 & 100.360901088761 & -1.36090108876115 \tabularnewline
50 & 107 & 98.8352922835156 & 8.16470771648443 \tabularnewline
51 & 112 & 118.690264912725 & -6.69026491272541 \tabularnewline
52 & 90 & 80.3724381641494 & 9.62756183585061 \tabularnewline
53 & 98 & 87.1786755417663 & 10.8213244582337 \tabularnewline
54 & 125 & 82.0662519289834 & 42.9337480710166 \tabularnewline
55 & 155 & 163.507873443503 & -8.50787344350337 \tabularnewline
56 & 190 & 154.710507380248 & 35.2894926197517 \tabularnewline
57 & 236 & 151.535414178215 & 84.4645858217852 \tabularnewline
58 & 189 & 177.166759393444 & 11.8332406065563 \tabularnewline
59 & 174 & 193.639681434782 & -19.6396814347821 \tabularnewline
60 & 178 & 207.840037629498 & -29.8400376294979 \tabularnewline
61 & 136 & 223.790542277062 & -87.7905422770622 \tabularnewline
62 & 161 & 171.414285740981 & -10.4142857409815 \tabularnewline
63 & 171 & 181.082803529836 & -10.0828035298362 \tabularnewline
64 & 149 & 127.72468035539 & 21.2753196446103 \tabularnewline
65 & 184 & 141.879431021192 & 42.1205689788078 \tabularnewline
66 & 155 & 156.685781517955 & -1.68578151795543 \tabularnewline
67 & 276 & 208.773911797153 & 67.2260882028468 \tabularnewline
68 & 224 & 260.740031459137 & -36.7400314591368 \tabularnewline
69 & 213 & 214.776086180959 & -1.77608618095883 \tabularnewline
70 & 279 & 170.279548518324 & 108.720451481676 \tabularnewline
71 & 268 & 238.18110000367 & 29.8188999963298 \tabularnewline
72 & 287 & 289.658411286008 & -2.65841128600823 \tabularnewline
\hline
\end{tabular}
%Source: https://freestatistics.org/blog/index.php?pk=157698&T=2

[TABLE]
[ROW][C]Interpolation Forecasts of Exponential Smoothing[/C][/ROW]
[ROW][C]t[/C][C]Observed[/C][C]Fitted[/C][C]Residuals[/C][/ROW]
[ROW][C]13[/C][C]50[/C][C]47.1054399101549[/C][C]2.89456008984506[/C][/ROW]
[ROW][C]14[/C][C]59[/C][C]57.3056665782268[/C][C]1.69433342177321[/C][/ROW]
[ROW][C]15[/C][C]63[/C][C]61.3862338714084[/C][C]1.61376612859157[/C][/ROW]
[ROW][C]16[/C][C]32[/C][C]31.4487404114978[/C][C]0.551259588502219[/C][/ROW]
[ROW][C]17[/C][C]39[/C][C]37.7328007887488[/C][C]1.26719921125117[/C][/ROW]
[ROW][C]18[/C][C]47[/C][C]44.4344758505134[/C][C]2.56552414948664[/C][/ROW]
[ROW][C]19[/C][C]53[/C][C]58.8749883873631[/C][C]-5.87498838736315[/C][/ROW]
[ROW][C]20[/C][C]60[/C][C]43.5666484645608[/C][C]16.4333515354392[/C][/ROW]
[ROW][C]21[/C][C]57[/C][C]58.9755506005693[/C][C]-1.97555060056932[/C][/ROW]
[ROW][C]22[/C][C]52[/C][C]52.4500643078582[/C][C]-0.450064307858213[/C][/ROW]
[ROW][C]23[/C][C]70[/C][C]44.46328893217[/C][C]25.53671106783[/C][/ROW]
[ROW][C]24[/C][C]90[/C][C]102.639431689157[/C][C]-12.6394316891575[/C][/ROW]
[ROW][C]25[/C][C]74[/C][C]97.8041025728887[/C][C]-23.8041025728887[/C][/ROW]
[ROW][C]26[/C][C]62[/C][C]95.5892680762729[/C][C]-33.5892680762729[/C][/ROW]
[ROW][C]27[/C][C]55[/C][C]78.1655338329924[/C][C]-23.1655338329924[/C][/ROW]
[ROW][C]28[/C][C]84[/C][C]32.0732230351276[/C][C]51.9267769648724[/C][/ROW]
[ROW][C]29[/C][C]94[/C][C]75.7769311881469[/C][C]18.2230688118531[/C][/ROW]
[ROW][C]30[/C][C]70[/C][C]99.8776285514012[/C][C]-29.8776285514012[/C][/ROW]
[ROW][C]31[/C][C]108[/C][C]98.8340765264973[/C][C]9.1659234735027[/C][/ROW]
[ROW][C]32[/C][C]139[/C][C]90.6975256694817[/C][C]48.3024743305183[/C][/ROW]
[ROW][C]33[/C][C]120[/C][C]120.392214330597[/C][C]-0.392214330596829[/C][/ROW]
[ROW][C]34[/C][C]97[/C][C]108.90525698292[/C][C]-11.9052569829201[/C][/ROW]
[ROW][C]35[/C][C]126[/C][C]95.5822149360921[/C][C]30.4177850639079[/C][/ROW]
[ROW][C]36[/C][C]149[/C][C]168.330866382641[/C][C]-19.3308663826413[/C][/ROW]
[ROW][C]37[/C][C]158[/C][C]153.746227766553[/C][C]4.25377223344677[/C][/ROW]
[ROW][C]38[/C][C]124[/C][C]170.421364402635[/C][C]-46.4213644026349[/C][/ROW]
[ROW][C]39[/C][C]140[/C][C]150.380308183253[/C][C]-10.3803081832532[/C][/ROW]
[ROW][C]40[/C][C]109[/C][C]95.6584119230315[/C][C]13.3415880769685[/C][/ROW]
[ROW][C]41[/C][C]114[/C][C]106.327958912205[/C][C]7.67204108779541[/C][/ROW]
[ROW][C]42[/C][C]77[/C][C]108.94862805934[/C][C]-31.9486280593396[/C][/ROW]
[ROW][C]43[/C][C]120[/C][C]122.36221453824[/C][C]-2.36221453824029[/C][/ROW]
[ROW][C]44[/C][C]133[/C][C]113.179348690828[/C][C]19.8206513091719[/C][/ROW]
[ROW][C]45[/C][C]110[/C][C]113.245598657526[/C][C]-3.24559865752562[/C][/ROW]
[ROW][C]46[/C][C]92[/C][C]97.8645369957318[/C][C]-5.86453699573184[/C][/ROW]
[ROW][C]47[/C][C]97[/C][C]97.9564271836312[/C][C]-0.95642718363122[/C][/ROW]
[ROW][C]48[/C][C]78[/C][C]129.743045937555[/C][C]-51.7430459375551[/C][/ROW]
[ROW][C]49[/C][C]99[/C][C]100.360901088761[/C][C]-1.36090108876115[/C][/ROW]
[ROW][C]50[/C][C]107[/C][C]98.8352922835156[/C][C]8.16470771648443[/C][/ROW]
[ROW][C]51[/C][C]112[/C][C]118.690264912725[/C][C]-6.69026491272541[/C][/ROW]
[ROW][C]52[/C][C]90[/C][C]80.3724381641494[/C][C]9.62756183585061[/C][/ROW]
[ROW][C]53[/C][C]98[/C][C]87.1786755417663[/C][C]10.8213244582337[/C][/ROW]
[ROW][C]54[/C][C]125[/C][C]82.0662519289834[/C][C]42.9337480710166[/C][/ROW]
[ROW][C]55[/C][C]155[/C][C]163.507873443503[/C][C]-8.50787344350337[/C][/ROW]
[ROW][C]56[/C][C]190[/C][C]154.710507380248[/C][C]35.2894926197517[/C][/ROW]
[ROW][C]57[/C][C]236[/C][C]151.535414178215[/C][C]84.4645858217852[/C][/ROW]
[ROW][C]58[/C][C]189[/C][C]177.166759393444[/C][C]11.8332406065563[/C][/ROW]
[ROW][C]59[/C][C]174[/C][C]193.639681434782[/C][C]-19.6396814347821[/C][/ROW]
[ROW][C]60[/C][C]178[/C][C]207.840037629498[/C][C]-29.8400376294979[/C][/ROW]
[ROW][C]61[/C][C]136[/C][C]223.790542277062[/C][C]-87.7905422770622[/C][/ROW]
[ROW][C]62[/C][C]161[/C][C]171.414285740981[/C][C]-10.4142857409815[/C][/ROW]
[ROW][C]63[/C][C]171[/C][C]181.082803529836[/C][C]-10.0828035298362[/C][/ROW]
[ROW][C]64[/C][C]149[/C][C]127.72468035539[/C][C]21.2753196446103[/C][/ROW]
[ROW][C]65[/C][C]184[/C][C]141.879431021192[/C][C]42.1205689788078[/C][/ROW]
[ROW][C]66[/C][C]155[/C][C]156.685781517955[/C][C]-1.68578151795543[/C][/ROW]
[ROW][C]67[/C][C]276[/C][C]208.773911797153[/C][C]67.2260882028468[/C][/ROW]
[ROW][C]68[/C][C]224[/C][C]260.740031459137[/C][C]-36.7400314591368[/C][/ROW]
[ROW][C]69[/C][C]213[/C][C]214.776086180959[/C][C]-1.77608618095883[/C][/ROW]
[ROW][C]70[/C][C]279[/C][C]170.279548518324[/C][C]108.720451481676[/C][/ROW]
[ROW][C]71[/C][C]268[/C][C]238.18110000367[/C][C]29.8188999963298[/C][/ROW]
[ROW][C]72[/C][C]287[/C][C]289.658411286008[/C][C]-2.65841128600823[/C][/ROW]
[/TABLE]
Source: https://freestatistics.org/blog/index.php?pk=157698&T=2

Globally Unique Identifier (entire table): ba.freestatistics.org/blog/index.php?pk=157698&T=2

As an alternative you can also use a QR Code:  

The GUIDs for individual cells are displayed in the table below:

Interpolation Forecasts of Exponential Smoothing
tObservedFittedResiduals
135047.10543991015492.89456008984506
145957.30566657822681.69433342177321
156361.38623387140841.61376612859157
163231.44874041149780.551259588502219
173937.73280078874881.26719921125117
184744.43447585051342.56552414948664
195358.8749883873631-5.87498838736315
206043.566648464560816.4333515354392
215758.9755506005693-1.97555060056932
225252.4500643078582-0.450064307858213
237044.4632889321725.53671106783
2490102.639431689157-12.6394316891575
257497.8041025728887-23.8041025728887
266295.5892680762729-33.5892680762729
275578.1655338329924-23.1655338329924
288432.073223035127651.9267769648724
299475.776931188146918.2230688118531
307099.8776285514012-29.8776285514012
3110898.83407652649739.1659234735027
3213990.697525669481748.3024743305183
33120120.392214330597-0.392214330596829
3497108.90525698292-11.9052569829201
3512695.582214936092130.4177850639079
36149168.330866382641-19.3308663826413
37158153.7462277665534.25377223344677
38124170.421364402635-46.4213644026349
39140150.380308183253-10.3803081832532
4010995.658411923031513.3415880769685
41114106.3279589122057.67204108779541
4277108.94862805934-31.9486280593396
43120122.36221453824-2.36221453824029
44133113.17934869082819.8206513091719
45110113.245598657526-3.24559865752562
469297.8645369957318-5.86453699573184
479797.9564271836312-0.95642718363122
4878129.743045937555-51.7430459375551
4999100.360901088761-1.36090108876115
5010798.83529228351568.16470771648443
51112118.690264912725-6.69026491272541
529080.37243816414949.62756183585061
539887.178675541766310.8213244582337
5412582.066251928983442.9337480710166
55155163.507873443503-8.50787344350337
56190154.71050738024835.2894926197517
57236151.53541417821584.4645858217852
58189177.16675939344411.8332406065563
59174193.639681434782-19.6396814347821
60178207.840037629498-29.8400376294979
61136223.790542277062-87.7905422770622
62161171.414285740981-10.4142857409815
63171181.082803529836-10.0828035298362
64149127.7246803553921.2753196446103
65184141.87943102119242.1205689788078
66155156.685781517955-1.68578151795543
67276208.77391179715367.2260882028468
68224260.740031459137-36.7400314591368
69213214.776086180959-1.77608618095883
70279170.279548518324108.720451481676
71268238.1811000036729.8188999963298
72287289.658411286008-2.65841128600823


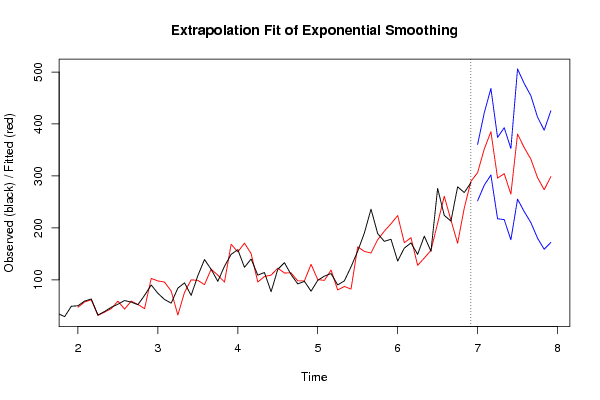
Extrapolation Forecasts of Exponential Smoothing
tForecast95% Lower Bound95% Upper Bound
73306.209323486453251.967993538557360.450653434348
74351.64757537315282.036417204989421.25873354131
75385.133271228062301.81392207888468.452620377245
76295.829905036948217.481034437352374.178775636544
77304.324887834555215.834745072527392.815030596583
78264.923377035355177.078547680659352.768206390051
79380.620478477905255.264431485986505.976525469824
80354.641831941666231.303045409119477.980618474212
81332.322009943915210.193198715566454.450821172265
82296.74274055111180.212661154608413.272819947612
83273.420316311408158.784647362212388.055985260605
84298.656010759144171.85613428538425.455887232908

\begin{tabular}{lllllllll}
\hline
Extrapolation Forecasts of Exponential Smoothing \tabularnewline
t & Forecast & 95% Lower Bound & 95% Upper Bound \tabularnewline
73 & 306.209323486453 & 251.967993538557 & 360.450653434348 \tabularnewline
74 & 351.64757537315 & 282.036417204989 & 421.25873354131 \tabularnewline
75 & 385.133271228062 & 301.81392207888 & 468.452620377245 \tabularnewline
76 & 295.829905036948 & 217.481034437352 & 374.178775636544 \tabularnewline
77 & 304.324887834555 & 215.834745072527 & 392.815030596583 \tabularnewline
78 & 264.923377035355 & 177.078547680659 & 352.768206390051 \tabularnewline
79 & 380.620478477905 & 255.264431485986 & 505.976525469824 \tabularnewline
80 & 354.641831941666 & 231.303045409119 & 477.980618474212 \tabularnewline
81 & 332.322009943915 & 210.193198715566 & 454.450821172265 \tabularnewline
82 & 296.74274055111 & 180.212661154608 & 413.272819947612 \tabularnewline
83 & 273.420316311408 & 158.784647362212 & 388.055985260605 \tabularnewline
84 & 298.656010759144 & 171.85613428538 & 425.455887232908 \tabularnewline
\hline
\end{tabular}
%Source: https://freestatistics.org/blog/index.php?pk=157698&T=3

[TABLE]
[ROW][C]Extrapolation Forecasts of Exponential Smoothing[/C][/ROW]
[ROW][C]t[/C][C]Forecast[/C][C]95% Lower Bound[/C][C]95% Upper Bound[/C][/ROW]
[ROW][C]73[/C][C]306.209323486453[/C][C]251.967993538557[/C][C]360.450653434348[/C][/ROW]
[ROW][C]74[/C][C]351.64757537315[/C][C]282.036417204989[/C][C]421.25873354131[/C][/ROW]
[ROW][C]75[/C][C]385.133271228062[/C][C]301.81392207888[/C][C]468.452620377245[/C][/ROW]
[ROW][C]76[/C][C]295.829905036948[/C][C]217.481034437352[/C][C]374.178775636544[/C][/ROW]
[ROW][C]77[/C][C]304.324887834555[/C][C]215.834745072527[/C][C]392.815030596583[/C][/ROW]
[ROW][C]78[/C][C]264.923377035355[/C][C]177.078547680659[/C][C]352.768206390051[/C][/ROW]
[ROW][C]79[/C][C]380.620478477905[/C][C]255.264431485986[/C][C]505.976525469824[/C][/ROW]
[ROW][C]80[/C][C]354.641831941666[/C][C]231.303045409119[/C][C]477.980618474212[/C][/ROW]
[ROW][C]81[/C][C]332.322009943915[/C][C]210.193198715566[/C][C]454.450821172265[/C][/ROW]
[ROW][C]82[/C][C]296.74274055111[/C][C]180.212661154608[/C][C]413.272819947612[/C][/ROW]
[ROW][C]83[/C][C]273.420316311408[/C][C]158.784647362212[/C][C]388.055985260605[/C][/ROW]
[ROW][C]84[/C][C]298.656010759144[/C][C]171.85613428538[/C][C]425.455887232908[/C][/ROW]
[/TABLE]
Source: https://freestatistics.org/blog/index.php?pk=157698&T=3

Globally Unique Identifier (entire table): ba.freestatistics.org/blog/index.php?pk=157698&T=3

As an alternative you can also use a QR Code:  

The GUIDs for individual cells are displayed in the table below:

Extrapolation Forecasts of Exponential Smoothing
tForecast95% Lower Bound95% Upper Bound
73306.209323486453251.967993538557360.450653434348
74351.64757537315282.036417204989421.25873354131
75385.133271228062301.81392207888468.452620377245
76295.829905036948217.481034437352374.178775636544
77304.324887834555215.834745072527392.815030596583
78264.923377035355177.078547680659352.768206390051
79380.620478477905255.264431485986505.976525469824
80354.641831941666231.303045409119477.980618474212
81332.322009943915210.193198715566454.450821172265
82296.74274055111180.212661154608413.272819947612
83273.420316311408158.784647362212388.055985260605
84298.656010759144171.85613428538425.455887232908


Parameters (Session):
par1 = 12 ; par2 = Triple ; par3 = multiplicative ;
Parameters (R input):
par1 = 12 ; par2 = Triple ; par3 = multiplicative ;
R code (references can be found in the software module):
par1 <- as.numeric(par1)
if (par2 == 'Single') K <- 1
if (par2 == 'Double') K <- 2
if (par2 == 'Triple') K <- par1
nx <- length(x)
nxmK <- nx - K
x <- ts(x, frequency = par1)
if (par2 == 'Single') fit <- HoltWinters(x, gamma=F, beta=F)
if (par2 == 'Double') fit <- HoltWinters(x, gamma=F)
if (par2 == 'Triple') fit <- HoltWinters(x, seasonal=par3)
fit
myresid <- x - fit$fitted[,'xhat']
bitmap(file='test1.png')
op <- par(mfrow=c(2,1))
plot(fit,ylab='Observed (black) / Fitted (red)',main='Interpolation Fit of Exponential Smoothing')
plot(myresid,ylab='Residuals',main='Interpolation Prediction Errors')
par(op)
dev.off()
bitmap(file='test2.png')
p <- predict(fit, par1, prediction.interval=TRUE)
np <- length(p[,1])
plot(fit,p,ylab='Observed (black) / Fitted (red)',main='Extrapolation Fit of Exponential Smoothing')
dev.off()
bitmap(file='test3.png')
op <- par(mfrow = c(2,2))
acf(as.numeric(myresid),lag.max = nx/2,main='Residual ACF')
spectrum(myresid,main='Residals Periodogram')
cpgram(myresid,main='Residal Cumulative Periodogram')
qqnorm(myresid,main='Residual Normal QQ Plot')
qqline(myresid)
par(op)
dev.off()
load(file='createtable')
a<-table.start()
a<-table.row.start(a)
a<-table.element(a,'Estimated Parameters of Exponential Smoothing',2,TRUE)
a<-table.row.end(a)
a<-table.row.start(a)
a<-table.element(a,'Parameter',header=TRUE)
a<-table.element(a,'Value',header=TRUE)
a<-table.row.end(a)
a<-table.row.start(a)
a<-table.element(a,'alpha',header=TRUE)
a<-table.element(a,fit$alpha)
a<-table.row.end(a)
a<-table.row.start(a)
a<-table.element(a,'beta',header=TRUE)
a<-table.element(a,fit$beta)
a<-table.row.end(a)
a<-table.row.start(a)
a<-table.element(a,'gamma',header=TRUE)
a<-table.element(a,fit$gamma)
a<-table.row.end(a)
a<-table.end(a)
table.save(a,file='mytable.tab')
a<-table.start()
a<-table.row.start(a)
a<-table.element(a,'Interpolation Forecasts of Exponential Smoothing',4,TRUE)
a<-table.row.end(a)
a<-table.row.start(a)
a<-table.element(a,'t',header=TRUE)
a<-table.element(a,'Observed',header=TRUE)
a<-table.element(a,'Fitted',header=TRUE)
a<-table.element(a,'Residuals',header=TRUE)
a<-table.row.end(a)
for (i in 1:nxmK) {
a<-table.row.start(a)
a<-table.element(a,i+K,header=TRUE)
a<-table.element(a,x[i+K])
a<-table.element(a,fit$fitted[i,'xhat'])
a<-table.element(a,myresid[i])
a<-table.row.end(a)
}
a<-table.end(a)
table.save(a,file='mytable1.tab')
a<-table.start()
a<-table.row.start(a)
a<-table.element(a,'Extrapolation Forecasts of Exponential Smoothing',4,TRUE)
a<-table.row.end(a)
a<-table.row.start(a)
a<-table.element(a,'t',header=TRUE)
a<-table.element(a,'Forecast',header=TRUE)
a<-table.element(a,'95% Lower Bound',header=TRUE)
a<-table.element(a,'95% Upper Bound',header=TRUE)
a<-table.row.end(a)
for (i in 1:np) {
a<-table.row.start(a)
a<-table.element(a,nx+i,header=TRUE)
a<-table.element(a,p[i,'fit'])
a<-table.element(a,p[i,'lwr'])
a<-table.element(a,p[i,'upr'])
a<-table.row.end(a)
}
a<-table.end(a)
table.save(a,file='mytable2.tab')