Free Statistics
of Irreproducible Research!
Description of Statistical Computation | |||||||||||||||||||||||||||||||||
|---|---|---|---|---|---|---|---|---|---|---|---|---|---|---|---|---|---|---|---|---|---|---|---|---|---|---|---|---|---|---|---|---|---|
| Author's title | |||||||||||||||||||||||||||||||||
| Author | *The author of this computation has been verified* | ||||||||||||||||||||||||||||||||
| R Software Module | rwasp_meanversusmedian.wasp | ||||||||||||||||||||||||||||||||
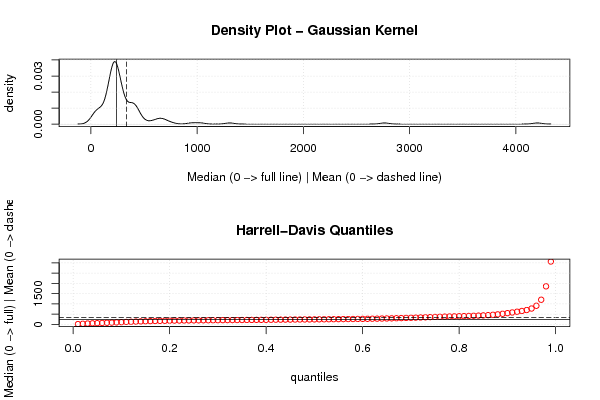
| Title produced by software | Mean versus Median | ||||||||||||||||||||||||||||||||
| Date of computation | Wed, 07 Dec 2011 13:02:08 -0500 | ||||||||||||||||||||||||||||||||
| Cite this page as follows | Statistical Computations at FreeStatistics.org, Office for Research Development and Education, URL https://freestatistics.org/blog/index.php?v=date/2011/Dec/07/t1323281016dxdqzmsms2gmokw.htm/, Retrieved Wed, 15 May 2024 18:32:59 +0000 | ||||||||||||||||||||||||||||||||
| Statistical Computations at FreeStatistics.org, Office for Research Development and Education, URL https://freestatistics.org/blog/index.php?pk=152587, Retrieved Wed, 15 May 2024 18:32:59 +0000 | |||||||||||||||||||||||||||||||||
| QR Codes: | |||||||||||||||||||||||||||||||||
|
| |||||||||||||||||||||||||||||||||
| Original text written by user: | |||||||||||||||||||||||||||||||||
| IsPrivate? | No (this computation is public) | ||||||||||||||||||||||||||||||||
| User-defined keywords | |||||||||||||||||||||||||||||||||
| Estimated Impact | 97 | ||||||||||||||||||||||||||||||||
Tree of Dependent Computations | |||||||||||||||||||||||||||||||||
| Family? (F = Feedback message, R = changed R code, M = changed R Module, P = changed Parameters, D = changed Data) | |||||||||||||||||||||||||||||||||
| - [Stem-and-leaf Plot] [Paper statistiek ...] [2011-12-07 17:10:05] [9e469a83342941fcd5c6dffbf184cd3a] - RMPD [Mean versus Median] [Paper statistiek ...] [2011-12-07 18:02:08] [5ae3d23a633522d14794d358c652ae9c] [Current] | |||||||||||||||||||||||||||||||||
| Feedback Forum | |||||||||||||||||||||||||||||||||
Post a new message | |||||||||||||||||||||||||||||||||
Dataset | |||||||||||||||||||||||||||||||||
| Dataseries X: | |||||||||||||||||||||||||||||||||
4202,361 2763,544 1305,923 1030,944 947,293 756,46 699,645 694,87 662,883 653,641 645,285 611,281 601,162 556,277 506,652 475,834 449,594 441,437 440,31 438,555 435,956 426,113 421,403 406,167 403,556 403,064 401,915 401,422 392,25 388,3 386,688 383,703 380,531 380,155 366,936 356,725 350,089 348,821 330,563 324,04 315,955 313,906 308,532 308,174 308,16 295,281 293,671 289,714 287,069 278,741 275,562 274,482 266,793 265,777 263,906 262,875 262,517 261,596 260,642 259,7 257,567 257,102 252,64 251,422 250,407 249,148 246,542 242,344 242,205 241,171 240,755 239,89 238,502 236,71 236,302 235,577 232,669 232,444 229,641 226,731 223,166 221,588 220,553 218,761 217,465 216,886 216,548 216,046 213,923 213,511 213,361 211,655 208,108 207,533 206,893 206,771 204,386 203,077 200,156 199,746 199,297 198,296 197,549 193,299 192,797 191,835 190,379 190,157 187,881 184,641 183,613 183,186 180,818 171,328 171,26 169,861 158,047 156,187 150,034 140,321 137,55 136,813 136,452 131,812 109,215 103,898 86,58 85,094 72,844 70,939 64,016 62,156 59,609 57,47 39,047 37,028 33,999 8,95 4,813 | |||||||||||||||||||||||||||||||||
Tables (Output of Computation) | |||||||||||||||||||||||||||||||||
| |||||||||||||||||||||||||||||||||
Figures (Output of Computation) | |||||||||||||||||||||||||||||||||
Input Parameters & R Code | |||||||||||||||||||||||||||||||||
| Parameters (Session): | |||||||||||||||||||||||||||||||||
| Parameters (R input): | |||||||||||||||||||||||||||||||||
| R code (references can be found in the software module): | |||||||||||||||||||||||||||||||||
library(Hmisc) | |||||||||||||||||||||||||||||||||