Free Statistics

of Irreproducible Research!

Author's title

Author*Unverified author*
R Software Modulerwasp_autocorrelation.wasp
Title produced by software(Partial) Autocorrelation Function
Date of computationThu, 18 Aug 2011 12:55:04 -0400
Cite this page as followsStatistical Computations at FreeStatistics.org, Office for Research Development and Education, URL https://freestatistics.org/blog/index.php?v=date/2011/Aug/18/t13136867913u5i7cdpt5knuef.htm/, Retrieved Wed, 15 May 2024 20:06:50 +0000
Statistical Computations at FreeStatistics.org, Office for Research Development and Education, URL https://freestatistics.org/blog/index.php?pk=124124, Retrieved Wed, 15 May 2024 20:06:50 +0000
QR Codes:

Original text written by user:
IsPrivate?No (this computation is public)
User-defined keywordsGregory Goris
Estimated Impact132
Family? (F = Feedback message, R = changed R code, M = changed R Module, P = changed Parameters, D = changed Data)
-       [(Partial) Autocorrelation Function] [Tijdreeks A - Sta...] [2011-08-18 16:55:04] [4069dbe0e58b4004934f5f5b0dc60f40] [Current]
Feedback Forum

Post a new message
Dataseries X:
34671
34355
34035
33373
39924
39577
34671
31409
31724
31724
32075
32706
34671
34035
35017
36631
45813
45813
43853
41888
43502
45466
45813
46795
49742
47777
47777
50724
58893
59555
57911
53982
56928
56928
57244
58893
60191
60853
60853
62817
70355
72315
72630
67724
70355
69373
67408
71653
72630
70986
71333
73613
82133
86372
86372
84412
87355
84412
82764
89004
89981
87670
93559
95870
102741
107301
106670
106319
108950
108630
104706
110594
112559
110594
118763
122692
131839
135448
134470
132505
134150
136114
129559
134785
138079
136750
145265
148207
160652
162932
159990
161634
162616
163598
157358
163247
166509
163247
172749
175692
188451
190416
191047
194340
194340
195638
189749
192696
194656
191047
201527
203491
216567
218878
222140
225087
225402
225749
219860
225749


Summary of computational transaction
Raw Inputview raw input (R code)
Raw Outputview raw output of R engine
Computing time1 seconds
R Server'Herman Ole Andreas Wold' @ wold.wessa.net

\begin{tabular}{lllllllll}
\hline
Summary of computational transaction \tabularnewline
Raw Input & view raw input (R code)  \tabularnewline
Raw Output & view raw output of R engine  \tabularnewline
Computing time & 1 seconds \tabularnewline
R Server & 'Herman Ole Andreas Wold' @ wold.wessa.net \tabularnewline
\hline
\end{tabular}
%Source: https://freestatistics.org/blog/index.php?pk=124124&T=0

[TABLE]
[ROW][C]Summary of computational transaction[/C][/ROW]
[ROW][C]Raw Input[/C][C]view raw input (R code) [/C][/ROW]
[ROW][C]Raw Output[/C][C]view raw output of R engine [/C][/ROW]
[ROW][C]Computing time[/C][C]1 seconds[/C][/ROW]
[ROW][C]R Server[/C][C]'Herman Ole Andreas Wold' @ wold.wessa.net[/C][/ROW]
[/TABLE]
Source: https://freestatistics.org/blog/index.php?pk=124124&T=0

Globally Unique Identifier (entire table): ba.freestatistics.org/blog/index.php?pk=124124&T=0

As an alternative you can also use a QR Code:  

The GUIDs for individual cells are displayed in the table below:

Summary of computational transaction
Raw Inputview raw input (R code)
Raw Outputview raw output of R engine
Computing time1 seconds
R Server'Herman Ole Andreas Wold' @ wold.wessa.net


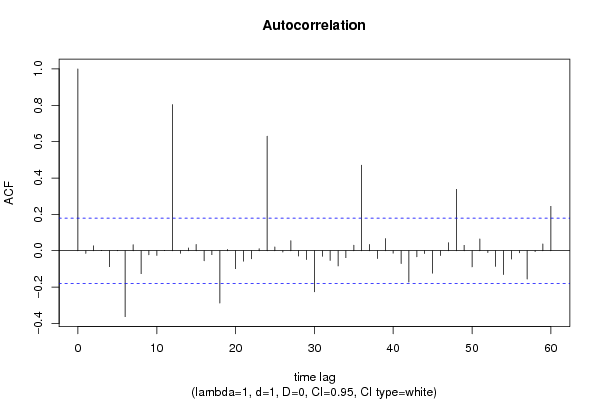
Autocorrelation Function
Time lag kACF(k)T-STATP-value
1-0.01463-0.15960.436736
20.0264440.28850.386746
30.0011260.01230.495111
4-0.087593-0.95550.170625
50.0018340.020.492036
6-0.362898-3.95876.4e-05
70.0332180.36240.35886
8-0.126059-1.37510.085836
9-0.022564-0.24610.402997
10-0.025882-0.28230.389085
110.0012090.01320.494749
120.8037688.76810
13-0.013926-0.15190.439754
140.0145810.15910.436946
150.0342160.37330.354812
16-0.055763-0.60830.272071
17-0.021588-0.23550.407112
18-0.288232-3.14420.001051
190.0067260.07340.470817
20-0.09867-1.07640.141971
21-0.057539-0.62770.265709
22-0.044124-0.48130.31558
230.0108780.11870.452872
240.6293876.86580
250.0199280.21740.414141
26-0.007039-0.07680.469459
270.0545660.59520.276406
28-0.02879-0.31410.377014
29-0.048224-0.52610.299912
30-0.225764-2.46280.007609
31-0.030162-0.3290.371358
32-0.053342-0.58190.280868
33-0.083723-0.91330.181463
34-0.038178-0.41650.338906
350.0303920.33150.370412
360.4700255.12741e-06
370.0338810.36960.35617
38-0.043312-0.47250.318725
390.0664660.72510.234921
40-0.013454-0.14680.441783
41-0.070125-0.7650.222902
42-0.17248-1.88150.031172
43-0.032951-0.35950.359948
44-0.015021-0.16390.435061
45-0.123411-1.34630.090389
46-0.02629-0.28680.387386
470.0440590.48060.315833
480.3372943.67940.000176
490.0292810.31940.374985
50-0.088875-0.96950.167129
510.0642010.70030.242538
52-0.009553-0.10420.458587
53-0.086188-0.94020.174509
54-0.130711-1.42590.078259
55-0.045866-0.50030.308882
56-0.011204-0.12220.451466
57-0.155566-1.6970.046153
58-0.005001-0.05460.478292
590.037160.40540.342969
600.2439882.66160.004426

\begin{tabular}{lllllllll}
\hline
Autocorrelation Function \tabularnewline
Time lag k & ACF(k) & T-STAT & P-value \tabularnewline
1 & -0.01463 & -0.1596 & 0.436736 \tabularnewline
2 & 0.026444 & 0.2885 & 0.386746 \tabularnewline
3 & 0.001126 & 0.0123 & 0.495111 \tabularnewline
4 & -0.087593 & -0.9555 & 0.170625 \tabularnewline
5 & 0.001834 & 0.02 & 0.492036 \tabularnewline
6 & -0.362898 & -3.9587 & 6.4e-05 \tabularnewline
7 & 0.033218 & 0.3624 & 0.35886 \tabularnewline
8 & -0.126059 & -1.3751 & 0.085836 \tabularnewline
9 & -0.022564 & -0.2461 & 0.402997 \tabularnewline
10 & -0.025882 & -0.2823 & 0.389085 \tabularnewline
11 & 0.001209 & 0.0132 & 0.494749 \tabularnewline
12 & 0.803768 & 8.7681 & 0 \tabularnewline
13 & -0.013926 & -0.1519 & 0.439754 \tabularnewline
14 & 0.014581 & 0.1591 & 0.436946 \tabularnewline
15 & 0.034216 & 0.3733 & 0.354812 \tabularnewline
16 & -0.055763 & -0.6083 & 0.272071 \tabularnewline
17 & -0.021588 & -0.2355 & 0.407112 \tabularnewline
18 & -0.288232 & -3.1442 & 0.001051 \tabularnewline
19 & 0.006726 & 0.0734 & 0.470817 \tabularnewline
20 & -0.09867 & -1.0764 & 0.141971 \tabularnewline
21 & -0.057539 & -0.6277 & 0.265709 \tabularnewline
22 & -0.044124 & -0.4813 & 0.31558 \tabularnewline
23 & 0.010878 & 0.1187 & 0.452872 \tabularnewline
24 & 0.629387 & 6.8658 & 0 \tabularnewline
25 & 0.019928 & 0.2174 & 0.414141 \tabularnewline
26 & -0.007039 & -0.0768 & 0.469459 \tabularnewline
27 & 0.054566 & 0.5952 & 0.276406 \tabularnewline
28 & -0.02879 & -0.3141 & 0.377014 \tabularnewline
29 & -0.048224 & -0.5261 & 0.299912 \tabularnewline
30 & -0.225764 & -2.4628 & 0.007609 \tabularnewline
31 & -0.030162 & -0.329 & 0.371358 \tabularnewline
32 & -0.053342 & -0.5819 & 0.280868 \tabularnewline
33 & -0.083723 & -0.9133 & 0.181463 \tabularnewline
34 & -0.038178 & -0.4165 & 0.338906 \tabularnewline
35 & 0.030392 & 0.3315 & 0.370412 \tabularnewline
36 & 0.470025 & 5.1274 & 1e-06 \tabularnewline
37 & 0.033881 & 0.3696 & 0.35617 \tabularnewline
38 & -0.043312 & -0.4725 & 0.318725 \tabularnewline
39 & 0.066466 & 0.7251 & 0.234921 \tabularnewline
40 & -0.013454 & -0.1468 & 0.441783 \tabularnewline
41 & -0.070125 & -0.765 & 0.222902 \tabularnewline
42 & -0.17248 & -1.8815 & 0.031172 \tabularnewline
43 & -0.032951 & -0.3595 & 0.359948 \tabularnewline
44 & -0.015021 & -0.1639 & 0.435061 \tabularnewline
45 & -0.123411 & -1.3463 & 0.090389 \tabularnewline
46 & -0.02629 & -0.2868 & 0.387386 \tabularnewline
47 & 0.044059 & 0.4806 & 0.315833 \tabularnewline
48 & 0.337294 & 3.6794 & 0.000176 \tabularnewline
49 & 0.029281 & 0.3194 & 0.374985 \tabularnewline
50 & -0.088875 & -0.9695 & 0.167129 \tabularnewline
51 & 0.064201 & 0.7003 & 0.242538 \tabularnewline
52 & -0.009553 & -0.1042 & 0.458587 \tabularnewline
53 & -0.086188 & -0.9402 & 0.174509 \tabularnewline
54 & -0.130711 & -1.4259 & 0.078259 \tabularnewline
55 & -0.045866 & -0.5003 & 0.308882 \tabularnewline
56 & -0.011204 & -0.1222 & 0.451466 \tabularnewline
57 & -0.155566 & -1.697 & 0.046153 \tabularnewline
58 & -0.005001 & -0.0546 & 0.478292 \tabularnewline
59 & 0.03716 & 0.4054 & 0.342969 \tabularnewline
60 & 0.243988 & 2.6616 & 0.004426 \tabularnewline
\hline
\end{tabular}
%Source: https://freestatistics.org/blog/index.php?pk=124124&T=1

[TABLE]
[ROW][C]Autocorrelation Function[/C][/ROW]
[ROW][C]Time lag k[/C][C]ACF(k)[/C][C]T-STAT[/C][C]P-value[/C][/ROW]
[ROW][C]1[/C][C]-0.01463[/C][C]-0.1596[/C][C]0.436736[/C][/ROW]
[ROW][C]2[/C][C]0.026444[/C][C]0.2885[/C][C]0.386746[/C][/ROW]
[ROW][C]3[/C][C]0.001126[/C][C]0.0123[/C][C]0.495111[/C][/ROW]
[ROW][C]4[/C][C]-0.087593[/C][C]-0.9555[/C][C]0.170625[/C][/ROW]
[ROW][C]5[/C][C]0.001834[/C][C]0.02[/C][C]0.492036[/C][/ROW]
[ROW][C]6[/C][C]-0.362898[/C][C]-3.9587[/C][C]6.4e-05[/C][/ROW]
[ROW][C]7[/C][C]0.033218[/C][C]0.3624[/C][C]0.35886[/C][/ROW]
[ROW][C]8[/C][C]-0.126059[/C][C]-1.3751[/C][C]0.085836[/C][/ROW]
[ROW][C]9[/C][C]-0.022564[/C][C]-0.2461[/C][C]0.402997[/C][/ROW]
[ROW][C]10[/C][C]-0.025882[/C][C]-0.2823[/C][C]0.389085[/C][/ROW]
[ROW][C]11[/C][C]0.001209[/C][C]0.0132[/C][C]0.494749[/C][/ROW]
[ROW][C]12[/C][C]0.803768[/C][C]8.7681[/C][C]0[/C][/ROW]
[ROW][C]13[/C][C]-0.013926[/C][C]-0.1519[/C][C]0.439754[/C][/ROW]
[ROW][C]14[/C][C]0.014581[/C][C]0.1591[/C][C]0.436946[/C][/ROW]
[ROW][C]15[/C][C]0.034216[/C][C]0.3733[/C][C]0.354812[/C][/ROW]
[ROW][C]16[/C][C]-0.055763[/C][C]-0.6083[/C][C]0.272071[/C][/ROW]
[ROW][C]17[/C][C]-0.021588[/C][C]-0.2355[/C][C]0.407112[/C][/ROW]
[ROW][C]18[/C][C]-0.288232[/C][C]-3.1442[/C][C]0.001051[/C][/ROW]
[ROW][C]19[/C][C]0.006726[/C][C]0.0734[/C][C]0.470817[/C][/ROW]
[ROW][C]20[/C][C]-0.09867[/C][C]-1.0764[/C][C]0.141971[/C][/ROW]
[ROW][C]21[/C][C]-0.057539[/C][C]-0.6277[/C][C]0.265709[/C][/ROW]
[ROW][C]22[/C][C]-0.044124[/C][C]-0.4813[/C][C]0.31558[/C][/ROW]
[ROW][C]23[/C][C]0.010878[/C][C]0.1187[/C][C]0.452872[/C][/ROW]
[ROW][C]24[/C][C]0.629387[/C][C]6.8658[/C][C]0[/C][/ROW]
[ROW][C]25[/C][C]0.019928[/C][C]0.2174[/C][C]0.414141[/C][/ROW]
[ROW][C]26[/C][C]-0.007039[/C][C]-0.0768[/C][C]0.469459[/C][/ROW]
[ROW][C]27[/C][C]0.054566[/C][C]0.5952[/C][C]0.276406[/C][/ROW]
[ROW][C]28[/C][C]-0.02879[/C][C]-0.3141[/C][C]0.377014[/C][/ROW]
[ROW][C]29[/C][C]-0.048224[/C][C]-0.5261[/C][C]0.299912[/C][/ROW]
[ROW][C]30[/C][C]-0.225764[/C][C]-2.4628[/C][C]0.007609[/C][/ROW]
[ROW][C]31[/C][C]-0.030162[/C][C]-0.329[/C][C]0.371358[/C][/ROW]
[ROW][C]32[/C][C]-0.053342[/C][C]-0.5819[/C][C]0.280868[/C][/ROW]
[ROW][C]33[/C][C]-0.083723[/C][C]-0.9133[/C][C]0.181463[/C][/ROW]
[ROW][C]34[/C][C]-0.038178[/C][C]-0.4165[/C][C]0.338906[/C][/ROW]
[ROW][C]35[/C][C]0.030392[/C][C]0.3315[/C][C]0.370412[/C][/ROW]
[ROW][C]36[/C][C]0.470025[/C][C]5.1274[/C][C]1e-06[/C][/ROW]
[ROW][C]37[/C][C]0.033881[/C][C]0.3696[/C][C]0.35617[/C][/ROW]
[ROW][C]38[/C][C]-0.043312[/C][C]-0.4725[/C][C]0.318725[/C][/ROW]
[ROW][C]39[/C][C]0.066466[/C][C]0.7251[/C][C]0.234921[/C][/ROW]
[ROW][C]40[/C][C]-0.013454[/C][C]-0.1468[/C][C]0.441783[/C][/ROW]
[ROW][C]41[/C][C]-0.070125[/C][C]-0.765[/C][C]0.222902[/C][/ROW]
[ROW][C]42[/C][C]-0.17248[/C][C]-1.8815[/C][C]0.031172[/C][/ROW]
[ROW][C]43[/C][C]-0.032951[/C][C]-0.3595[/C][C]0.359948[/C][/ROW]
[ROW][C]44[/C][C]-0.015021[/C][C]-0.1639[/C][C]0.435061[/C][/ROW]
[ROW][C]45[/C][C]-0.123411[/C][C]-1.3463[/C][C]0.090389[/C][/ROW]
[ROW][C]46[/C][C]-0.02629[/C][C]-0.2868[/C][C]0.387386[/C][/ROW]
[ROW][C]47[/C][C]0.044059[/C][C]0.4806[/C][C]0.315833[/C][/ROW]
[ROW][C]48[/C][C]0.337294[/C][C]3.6794[/C][C]0.000176[/C][/ROW]
[ROW][C]49[/C][C]0.029281[/C][C]0.3194[/C][C]0.374985[/C][/ROW]
[ROW][C]50[/C][C]-0.088875[/C][C]-0.9695[/C][C]0.167129[/C][/ROW]
[ROW][C]51[/C][C]0.064201[/C][C]0.7003[/C][C]0.242538[/C][/ROW]
[ROW][C]52[/C][C]-0.009553[/C][C]-0.1042[/C][C]0.458587[/C][/ROW]
[ROW][C]53[/C][C]-0.086188[/C][C]-0.9402[/C][C]0.174509[/C][/ROW]
[ROW][C]54[/C][C]-0.130711[/C][C]-1.4259[/C][C]0.078259[/C][/ROW]
[ROW][C]55[/C][C]-0.045866[/C][C]-0.5003[/C][C]0.308882[/C][/ROW]
[ROW][C]56[/C][C]-0.011204[/C][C]-0.1222[/C][C]0.451466[/C][/ROW]
[ROW][C]57[/C][C]-0.155566[/C][C]-1.697[/C][C]0.046153[/C][/ROW]
[ROW][C]58[/C][C]-0.005001[/C][C]-0.0546[/C][C]0.478292[/C][/ROW]
[ROW][C]59[/C][C]0.03716[/C][C]0.4054[/C][C]0.342969[/C][/ROW]
[ROW][C]60[/C][C]0.243988[/C][C]2.6616[/C][C]0.004426[/C][/ROW]
[/TABLE]
Source: https://freestatistics.org/blog/index.php?pk=124124&T=1

Globally Unique Identifier (entire table): ba.freestatistics.org/blog/index.php?pk=124124&T=1

As an alternative you can also use a QR Code:  

The GUIDs for individual cells are displayed in the table below:

Autocorrelation Function
Time lag kACF(k)T-STATP-value
1-0.01463-0.15960.436736
20.0264440.28850.386746
30.0011260.01230.495111
4-0.087593-0.95550.170625
50.0018340.020.492036
6-0.362898-3.95876.4e-05
70.0332180.36240.35886
8-0.126059-1.37510.085836
9-0.022564-0.24610.402997
10-0.025882-0.28230.389085
110.0012090.01320.494749
120.8037688.76810
13-0.013926-0.15190.439754
140.0145810.15910.436946
150.0342160.37330.354812
16-0.055763-0.60830.272071
17-0.021588-0.23550.407112
18-0.288232-3.14420.001051
190.0067260.07340.470817
20-0.09867-1.07640.141971
21-0.057539-0.62770.265709
22-0.044124-0.48130.31558
230.0108780.11870.452872
240.6293876.86580
250.0199280.21740.414141
26-0.007039-0.07680.469459
270.0545660.59520.276406
28-0.02879-0.31410.377014
29-0.048224-0.52610.299912
30-0.225764-2.46280.007609
31-0.030162-0.3290.371358
32-0.053342-0.58190.280868
33-0.083723-0.91330.181463
34-0.038178-0.41650.338906
350.0303920.33150.370412
360.4700255.12741e-06
370.0338810.36960.35617
38-0.043312-0.47250.318725
390.0664660.72510.234921
40-0.013454-0.14680.441783
41-0.070125-0.7650.222902
42-0.17248-1.88150.031172
43-0.032951-0.35950.359948
44-0.015021-0.16390.435061
45-0.123411-1.34630.090389
46-0.02629-0.28680.387386
470.0440590.48060.315833
480.3372943.67940.000176
490.0292810.31940.374985
50-0.088875-0.96950.167129
510.0642010.70030.242538
52-0.009553-0.10420.458587
53-0.086188-0.94020.174509
54-0.130711-1.42590.078259
55-0.045866-0.50030.308882
56-0.011204-0.12220.451466
57-0.155566-1.6970.046153
58-0.005001-0.05460.478292
590.037160.40540.342969
600.2439882.66160.004426


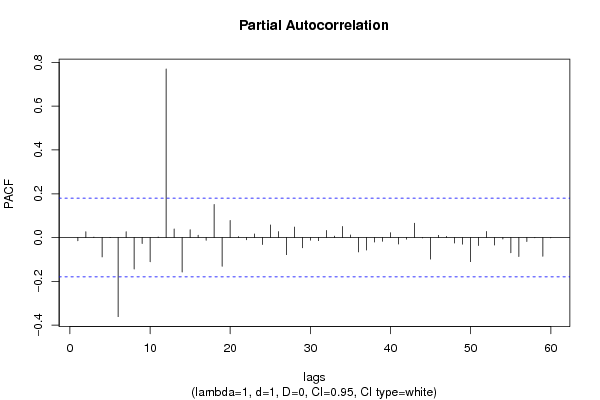
Partial Autocorrelation Function
Time lag kPACF(k)T-STATP-value
1-0.01463-0.15960.436736
20.0262350.28620.387614
30.0018880.02060.491801
4-0.088323-0.96350.168627
5-0.000751-0.00820.496738
6-0.361186-3.94016.9e-05
70.0266950.29120.385698
8-0.1439-1.56980.059563
9-0.027003-0.29460.38442
10-0.110665-1.20720.114872
110.0023980.02620.489586
120.7698318.39790
130.0391020.42660.335237
14-0.15737-1.71670.044317
150.0358490.39110.348225
160.0104610.11410.45467
17-0.01231-0.13430.446699
180.1507141.64410.051398
19-0.131122-1.43040.077615
200.0779150.84990.19853
210.0041530.04530.481971
22-0.009728-0.10610.457834
230.0163730.17860.429274
24-0.0315-0.34360.365867
250.0572230.62420.266835
260.0271290.29590.383896
27-0.078094-0.85190.19799
280.0477070.52040.301868
29-0.046956-0.51220.304721
30-0.01194-0.13020.448295
31-0.014167-0.15450.438721
320.0325290.35480.361666
330.0063970.06980.472243
340.0501280.54680.292759
350.0115420.12590.450008
36-0.065547-0.7150.237995
37-0.05721-0.62410.266883
38-0.020564-0.22430.411442
39-0.017-0.18540.426597
400.0218110.23790.40617
41-0.029215-0.31870.375256
42-0.007381-0.08050.467981
430.0652270.71150.239071
44-0.001468-0.0160.493625
45-0.098406-1.07350.142612
460.0101350.11060.456076
470.0052490.05730.477219
48-0.025031-0.27310.39264
49-0.029963-0.32690.372174
50-0.109983-1.19980.116306
51-0.036429-0.39740.345894
520.0279330.30470.380557
53-0.033951-0.37040.355888
54-0.006606-0.07210.471335
55-0.069589-0.75910.224638
56-0.086261-0.9410.174308
57-0.018163-0.19810.42164
58-0.001054-0.01150.495421
59-0.085155-0.92890.177403
60-0.001381-0.01510.494001

\begin{tabular}{lllllllll}
\hline
Partial Autocorrelation Function \tabularnewline
Time lag k & PACF(k) & T-STAT & P-value \tabularnewline
1 & -0.01463 & -0.1596 & 0.436736 \tabularnewline
2 & 0.026235 & 0.2862 & 0.387614 \tabularnewline
3 & 0.001888 & 0.0206 & 0.491801 \tabularnewline
4 & -0.088323 & -0.9635 & 0.168627 \tabularnewline
5 & -0.000751 & -0.0082 & 0.496738 \tabularnewline
6 & -0.361186 & -3.9401 & 6.9e-05 \tabularnewline
7 & 0.026695 & 0.2912 & 0.385698 \tabularnewline
8 & -0.1439 & -1.5698 & 0.059563 \tabularnewline
9 & -0.027003 & -0.2946 & 0.38442 \tabularnewline
10 & -0.110665 & -1.2072 & 0.114872 \tabularnewline
11 & 0.002398 & 0.0262 & 0.489586 \tabularnewline
12 & 0.769831 & 8.3979 & 0 \tabularnewline
13 & 0.039102 & 0.4266 & 0.335237 \tabularnewline
14 & -0.15737 & -1.7167 & 0.044317 \tabularnewline
15 & 0.035849 & 0.3911 & 0.348225 \tabularnewline
16 & 0.010461 & 0.1141 & 0.45467 \tabularnewline
17 & -0.01231 & -0.1343 & 0.446699 \tabularnewline
18 & 0.150714 & 1.6441 & 0.051398 \tabularnewline
19 & -0.131122 & -1.4304 & 0.077615 \tabularnewline
20 & 0.077915 & 0.8499 & 0.19853 \tabularnewline
21 & 0.004153 & 0.0453 & 0.481971 \tabularnewline
22 & -0.009728 & -0.1061 & 0.457834 \tabularnewline
23 & 0.016373 & 0.1786 & 0.429274 \tabularnewline
24 & -0.0315 & -0.3436 & 0.365867 \tabularnewline
25 & 0.057223 & 0.6242 & 0.266835 \tabularnewline
26 & 0.027129 & 0.2959 & 0.383896 \tabularnewline
27 & -0.078094 & -0.8519 & 0.19799 \tabularnewline
28 & 0.047707 & 0.5204 & 0.301868 \tabularnewline
29 & -0.046956 & -0.5122 & 0.304721 \tabularnewline
30 & -0.01194 & -0.1302 & 0.448295 \tabularnewline
31 & -0.014167 & -0.1545 & 0.438721 \tabularnewline
32 & 0.032529 & 0.3548 & 0.361666 \tabularnewline
33 & 0.006397 & 0.0698 & 0.472243 \tabularnewline
34 & 0.050128 & 0.5468 & 0.292759 \tabularnewline
35 & 0.011542 & 0.1259 & 0.450008 \tabularnewline
36 & -0.065547 & -0.715 & 0.237995 \tabularnewline
37 & -0.05721 & -0.6241 & 0.266883 \tabularnewline
38 & -0.020564 & -0.2243 & 0.411442 \tabularnewline
39 & -0.017 & -0.1854 & 0.426597 \tabularnewline
40 & 0.021811 & 0.2379 & 0.40617 \tabularnewline
41 & -0.029215 & -0.3187 & 0.375256 \tabularnewline
42 & -0.007381 & -0.0805 & 0.467981 \tabularnewline
43 & 0.065227 & 0.7115 & 0.239071 \tabularnewline
44 & -0.001468 & -0.016 & 0.493625 \tabularnewline
45 & -0.098406 & -1.0735 & 0.142612 \tabularnewline
46 & 0.010135 & 0.1106 & 0.456076 \tabularnewline
47 & 0.005249 & 0.0573 & 0.477219 \tabularnewline
48 & -0.025031 & -0.2731 & 0.39264 \tabularnewline
49 & -0.029963 & -0.3269 & 0.372174 \tabularnewline
50 & -0.109983 & -1.1998 & 0.116306 \tabularnewline
51 & -0.036429 & -0.3974 & 0.345894 \tabularnewline
52 & 0.027933 & 0.3047 & 0.380557 \tabularnewline
53 & -0.033951 & -0.3704 & 0.355888 \tabularnewline
54 & -0.006606 & -0.0721 & 0.471335 \tabularnewline
55 & -0.069589 & -0.7591 & 0.224638 \tabularnewline
56 & -0.086261 & -0.941 & 0.174308 \tabularnewline
57 & -0.018163 & -0.1981 & 0.42164 \tabularnewline
58 & -0.001054 & -0.0115 & 0.495421 \tabularnewline
59 & -0.085155 & -0.9289 & 0.177403 \tabularnewline
60 & -0.001381 & -0.0151 & 0.494001 \tabularnewline
\hline
\end{tabular}
%Source: https://freestatistics.org/blog/index.php?pk=124124&T=2

[TABLE]
[ROW][C]Partial Autocorrelation Function[/C][/ROW]
[ROW][C]Time lag k[/C][C]PACF(k)[/C][C]T-STAT[/C][C]P-value[/C][/ROW]
[ROW][C]1[/C][C]-0.01463[/C][C]-0.1596[/C][C]0.436736[/C][/ROW]
[ROW][C]2[/C][C]0.026235[/C][C]0.2862[/C][C]0.387614[/C][/ROW]
[ROW][C]3[/C][C]0.001888[/C][C]0.0206[/C][C]0.491801[/C][/ROW]
[ROW][C]4[/C][C]-0.088323[/C][C]-0.9635[/C][C]0.168627[/C][/ROW]
[ROW][C]5[/C][C]-0.000751[/C][C]-0.0082[/C][C]0.496738[/C][/ROW]
[ROW][C]6[/C][C]-0.361186[/C][C]-3.9401[/C][C]6.9e-05[/C][/ROW]
[ROW][C]7[/C][C]0.026695[/C][C]0.2912[/C][C]0.385698[/C][/ROW]
[ROW][C]8[/C][C]-0.1439[/C][C]-1.5698[/C][C]0.059563[/C][/ROW]
[ROW][C]9[/C][C]-0.027003[/C][C]-0.2946[/C][C]0.38442[/C][/ROW]
[ROW][C]10[/C][C]-0.110665[/C][C]-1.2072[/C][C]0.114872[/C][/ROW]
[ROW][C]11[/C][C]0.002398[/C][C]0.0262[/C][C]0.489586[/C][/ROW]
[ROW][C]12[/C][C]0.769831[/C][C]8.3979[/C][C]0[/C][/ROW]
[ROW][C]13[/C][C]0.039102[/C][C]0.4266[/C][C]0.335237[/C][/ROW]
[ROW][C]14[/C][C]-0.15737[/C][C]-1.7167[/C][C]0.044317[/C][/ROW]
[ROW][C]15[/C][C]0.035849[/C][C]0.3911[/C][C]0.348225[/C][/ROW]
[ROW][C]16[/C][C]0.010461[/C][C]0.1141[/C][C]0.45467[/C][/ROW]
[ROW][C]17[/C][C]-0.01231[/C][C]-0.1343[/C][C]0.446699[/C][/ROW]
[ROW][C]18[/C][C]0.150714[/C][C]1.6441[/C][C]0.051398[/C][/ROW]
[ROW][C]19[/C][C]-0.131122[/C][C]-1.4304[/C][C]0.077615[/C][/ROW]
[ROW][C]20[/C][C]0.077915[/C][C]0.8499[/C][C]0.19853[/C][/ROW]
[ROW][C]21[/C][C]0.004153[/C][C]0.0453[/C][C]0.481971[/C][/ROW]
[ROW][C]22[/C][C]-0.009728[/C][C]-0.1061[/C][C]0.457834[/C][/ROW]
[ROW][C]23[/C][C]0.016373[/C][C]0.1786[/C][C]0.429274[/C][/ROW]
[ROW][C]24[/C][C]-0.0315[/C][C]-0.3436[/C][C]0.365867[/C][/ROW]
[ROW][C]25[/C][C]0.057223[/C][C]0.6242[/C][C]0.266835[/C][/ROW]
[ROW][C]26[/C][C]0.027129[/C][C]0.2959[/C][C]0.383896[/C][/ROW]
[ROW][C]27[/C][C]-0.078094[/C][C]-0.8519[/C][C]0.19799[/C][/ROW]
[ROW][C]28[/C][C]0.047707[/C][C]0.5204[/C][C]0.301868[/C][/ROW]
[ROW][C]29[/C][C]-0.046956[/C][C]-0.5122[/C][C]0.304721[/C][/ROW]
[ROW][C]30[/C][C]-0.01194[/C][C]-0.1302[/C][C]0.448295[/C][/ROW]
[ROW][C]31[/C][C]-0.014167[/C][C]-0.1545[/C][C]0.438721[/C][/ROW]
[ROW][C]32[/C][C]0.032529[/C][C]0.3548[/C][C]0.361666[/C][/ROW]
[ROW][C]33[/C][C]0.006397[/C][C]0.0698[/C][C]0.472243[/C][/ROW]
[ROW][C]34[/C][C]0.050128[/C][C]0.5468[/C][C]0.292759[/C][/ROW]
[ROW][C]35[/C][C]0.011542[/C][C]0.1259[/C][C]0.450008[/C][/ROW]
[ROW][C]36[/C][C]-0.065547[/C][C]-0.715[/C][C]0.237995[/C][/ROW]
[ROW][C]37[/C][C]-0.05721[/C][C]-0.6241[/C][C]0.266883[/C][/ROW]
[ROW][C]38[/C][C]-0.020564[/C][C]-0.2243[/C][C]0.411442[/C][/ROW]
[ROW][C]39[/C][C]-0.017[/C][C]-0.1854[/C][C]0.426597[/C][/ROW]
[ROW][C]40[/C][C]0.021811[/C][C]0.2379[/C][C]0.40617[/C][/ROW]
[ROW][C]41[/C][C]-0.029215[/C][C]-0.3187[/C][C]0.375256[/C][/ROW]
[ROW][C]42[/C][C]-0.007381[/C][C]-0.0805[/C][C]0.467981[/C][/ROW]
[ROW][C]43[/C][C]0.065227[/C][C]0.7115[/C][C]0.239071[/C][/ROW]
[ROW][C]44[/C][C]-0.001468[/C][C]-0.016[/C][C]0.493625[/C][/ROW]
[ROW][C]45[/C][C]-0.098406[/C][C]-1.0735[/C][C]0.142612[/C][/ROW]
[ROW][C]46[/C][C]0.010135[/C][C]0.1106[/C][C]0.456076[/C][/ROW]
[ROW][C]47[/C][C]0.005249[/C][C]0.0573[/C][C]0.477219[/C][/ROW]
[ROW][C]48[/C][C]-0.025031[/C][C]-0.2731[/C][C]0.39264[/C][/ROW]
[ROW][C]49[/C][C]-0.029963[/C][C]-0.3269[/C][C]0.372174[/C][/ROW]
[ROW][C]50[/C][C]-0.109983[/C][C]-1.1998[/C][C]0.116306[/C][/ROW]
[ROW][C]51[/C][C]-0.036429[/C][C]-0.3974[/C][C]0.345894[/C][/ROW]
[ROW][C]52[/C][C]0.027933[/C][C]0.3047[/C][C]0.380557[/C][/ROW]
[ROW][C]53[/C][C]-0.033951[/C][C]-0.3704[/C][C]0.355888[/C][/ROW]
[ROW][C]54[/C][C]-0.006606[/C][C]-0.0721[/C][C]0.471335[/C][/ROW]
[ROW][C]55[/C][C]-0.069589[/C][C]-0.7591[/C][C]0.224638[/C][/ROW]
[ROW][C]56[/C][C]-0.086261[/C][C]-0.941[/C][C]0.174308[/C][/ROW]
[ROW][C]57[/C][C]-0.018163[/C][C]-0.1981[/C][C]0.42164[/C][/ROW]
[ROW][C]58[/C][C]-0.001054[/C][C]-0.0115[/C][C]0.495421[/C][/ROW]
[ROW][C]59[/C][C]-0.085155[/C][C]-0.9289[/C][C]0.177403[/C][/ROW]
[ROW][C]60[/C][C]-0.001381[/C][C]-0.0151[/C][C]0.494001[/C][/ROW]
[/TABLE]
Source: https://freestatistics.org/blog/index.php?pk=124124&T=2

Globally Unique Identifier (entire table): ba.freestatistics.org/blog/index.php?pk=124124&T=2

As an alternative you can also use a QR Code:  

The GUIDs for individual cells are displayed in the table below:

Partial Autocorrelation Function
Time lag kPACF(k)T-STATP-value
1-0.01463-0.15960.436736
20.0262350.28620.387614
30.0018880.02060.491801
4-0.088323-0.96350.168627
5-0.000751-0.00820.496738
6-0.361186-3.94016.9e-05
70.0266950.29120.385698
8-0.1439-1.56980.059563
9-0.027003-0.29460.38442
10-0.110665-1.20720.114872
110.0023980.02620.489586
120.7698318.39790
130.0391020.42660.335237
14-0.15737-1.71670.044317
150.0358490.39110.348225
160.0104610.11410.45467
17-0.01231-0.13430.446699
180.1507141.64410.051398
19-0.131122-1.43040.077615
200.0779150.84990.19853
210.0041530.04530.481971
22-0.009728-0.10610.457834
230.0163730.17860.429274
24-0.0315-0.34360.365867
250.0572230.62420.266835
260.0271290.29590.383896
27-0.078094-0.85190.19799
280.0477070.52040.301868
29-0.046956-0.51220.304721
30-0.01194-0.13020.448295
31-0.014167-0.15450.438721
320.0325290.35480.361666
330.0063970.06980.472243
340.0501280.54680.292759
350.0115420.12590.450008
36-0.065547-0.7150.237995
37-0.05721-0.62410.266883
38-0.020564-0.22430.411442
39-0.017-0.18540.426597
400.0218110.23790.40617
41-0.029215-0.31870.375256
42-0.007381-0.08050.467981
430.0652270.71150.239071
44-0.001468-0.0160.493625
45-0.098406-1.07350.142612
460.0101350.11060.456076
470.0052490.05730.477219
48-0.025031-0.27310.39264
49-0.029963-0.32690.372174
50-0.109983-1.19980.116306
51-0.036429-0.39740.345894
520.0279330.30470.380557
53-0.033951-0.37040.355888
54-0.006606-0.07210.471335
55-0.069589-0.75910.224638
56-0.086261-0.9410.174308
57-0.018163-0.19810.42164
58-0.001054-0.01150.495421
59-0.085155-0.92890.177403
60-0.001381-0.01510.494001


Parameters (Session):
par1 = 60 ; par2 = 1 ; par3 = 1 ; par4 = 0 ; par5 = 12 ; par6 = White Noise ; par7 = 0.95 ;
Parameters (R input):
par1 = 60 ; par2 = 1 ; par3 = 1 ; par4 = 0 ; par5 = 12 ; par6 = White Noise ; par7 = 0.95 ; par8 = ;
R code (references can be found in the software module):
if (par1 == 'Default') {
par1 = 10*log10(length(x))
} else {
par1 <- as.numeric(par1)
}
par2 <- as.numeric(par2)
par3 <- as.numeric(par3)
par4 <- as.numeric(par4)
par5 <- as.numeric(par5)
if (par6 == 'White Noise') par6 <- 'white' else par6 <- 'ma'
par7 <- as.numeric(par7)
if (par8 != '') par8 <- as.numeric(par8)
ox <- x
if (par8 == '') {
if (par2 == 0) {
x <- log(x)
} else {
x <- (x ^ par2 - 1) / par2
}
} else {
x <- log(x,base=par8)
}
if (par3 > 0) x <- diff(x,lag=1,difference=par3)
if (par4 > 0) x <- diff(x,lag=par5,difference=par4)
bitmap(file='picts.png')
op <- par(mfrow=c(2,1))
plot(ox,type='l',main='Original Time Series',xlab='time',ylab='value')
if (par8=='') {
mytitle <- paste('Working Time Series (lambda=',par2,', d=',par3,', D=',par4,')',sep='')
mysub <- paste('(lambda=',par2,', d=',par3,', D=',par4,', CI=', par7, ', CI type=',par6,')',sep='')
} else {
mytitle <- paste('Working Time Series (base=',par8,', d=',par3,', D=',par4,')',sep='')
mysub <- paste('(base=',par8,', d=',par3,', D=',par4,', CI=', par7, ', CI type=',par6,')',sep='')
}
plot(x,type='l', main=mytitle,xlab='time',ylab='value')
par(op)
dev.off()
bitmap(file='pic1.png')
racf <- acf(x, par1, main='Autocorrelation', xlab='time lag', ylab='ACF', ci.type=par6, ci=par7, sub=mysub)
dev.off()
bitmap(file='pic2.png')
rpacf <- pacf(x,par1,main='Partial Autocorrelation',xlab='lags',ylab='PACF',sub=mysub)
dev.off()
(myacf <- c(racf$acf))
(mypacf <- c(rpacf$acf))
lengthx <- length(x)
sqrtn <- sqrt(lengthx)
load(file='createtable')
a<-table.start()
a<-table.row.start(a)
a<-table.element(a,'Autocorrelation Function',4,TRUE)
a<-table.row.end(a)
a<-table.row.start(a)
a<-table.element(a,'Time lag k',header=TRUE)
a<-table.element(a,hyperlink('basics.htm','ACF(k)','click here for more information about the Autocorrelation Function'),header=TRUE)
a<-table.element(a,'T-STAT',header=TRUE)
a<-table.element(a,'P-value',header=TRUE)
a<-table.row.end(a)
for (i in 2:(par1+1)) {
a<-table.row.start(a)
a<-table.element(a,i-1,header=TRUE)
a<-table.element(a,round(myacf[i],6))
mytstat <- myacf[i]*sqrtn
a<-table.element(a,round(mytstat,4))
a<-table.element(a,round(1-pt(abs(mytstat),lengthx),6))
a<-table.row.end(a)
}
a<-table.end(a)
table.save(a,file='mytable.tab')
a<-table.start()
a<-table.row.start(a)
a<-table.element(a,'Partial Autocorrelation Function',4,TRUE)
a<-table.row.end(a)
a<-table.row.start(a)
a<-table.element(a,'Time lag k',header=TRUE)
a<-table.element(a,hyperlink('basics.htm','PACF(k)','click here for more information about the Partial Autocorrelation Function'),header=TRUE)
a<-table.element(a,'T-STAT',header=TRUE)
a<-table.element(a,'P-value',header=TRUE)
a<-table.row.end(a)
for (i in 1:par1) {
a<-table.row.start(a)
a<-table.element(a,i,header=TRUE)
a<-table.element(a,round(mypacf[i],6))
mytstat <- mypacf[i]*sqrtn
a<-table.element(a,round(mytstat,4))
a<-table.element(a,round(1-pt(abs(mytstat),lengthx),6))
a<-table.row.end(a)
}
a<-table.end(a)
table.save(a,file='mytable1.tab')