Free Statistics
of Irreproducible Research!
Description of Statistical Computation | |||||||||||||||||||||||||||||||||||||||||
|---|---|---|---|---|---|---|---|---|---|---|---|---|---|---|---|---|---|---|---|---|---|---|---|---|---|---|---|---|---|---|---|---|---|---|---|---|---|---|---|---|---|
| Author's title | |||||||||||||||||||||||||||||||||||||||||
| Author | *Unverified author* | ||||||||||||||||||||||||||||||||||||||||
| R Software Module | rwasp_univariatedataseries.wasp | ||||||||||||||||||||||||||||||||||||||||
| Title produced by software | Univariate Data Series | ||||||||||||||||||||||||||||||||||||||||
| Date of computation | Tue, 05 Oct 2010 17:48:29 +0000 | ||||||||||||||||||||||||||||||||||||||||
| Cite this page as follows | Statistical Computations at FreeStatistics.org, Office for Research Development and Education, URL https://freestatistics.org/blog/index.php?v=date/2010/Oct/05/t1286301255scqa5e1nwap902r.htm/, Retrieved Sun, 28 Apr 2024 11:03:36 +0000 | ||||||||||||||||||||||||||||||||||||||||
| Statistical Computations at FreeStatistics.org, Office for Research Development and Education, URL https://freestatistics.org/blog/index.php?pk=81498, Retrieved Sun, 28 Apr 2024 11:03:36 +0000 | |||||||||||||||||||||||||||||||||||||||||
| QR Codes: | |||||||||||||||||||||||||||||||||||||||||
|
| |||||||||||||||||||||||||||||||||||||||||
| Original text written by user: | |||||||||||||||||||||||||||||||||||||||||
| IsPrivate? | No (this computation is public) | ||||||||||||||||||||||||||||||||||||||||
| User-defined keywords | KDGP1W1 | ||||||||||||||||||||||||||||||||||||||||
| Estimated Impact | 120 | ||||||||||||||||||||||||||||||||||||||||
Tree of Dependent Computations | |||||||||||||||||||||||||||||||||||||||||
| Family? (F = Feedback message, R = changed R code, M = changed R Module, P = changed Parameters, D = changed Data) | |||||||||||||||||||||||||||||||||||||||||
| - [Univariate Data Series] [Evolutie van de g...] [2010-10-05 17:48:29] [907ff08aa543b935e12b9ef122e80b4e] [Current] | |||||||||||||||||||||||||||||||||||||||||
| Feedback Forum | |||||||||||||||||||||||||||||||||||||||||
Post a new message | |||||||||||||||||||||||||||||||||||||||||
Dataset | |||||||||||||||||||||||||||||||||||||||||
| Dataseries X: | |||||||||||||||||||||||||||||||||||||||||
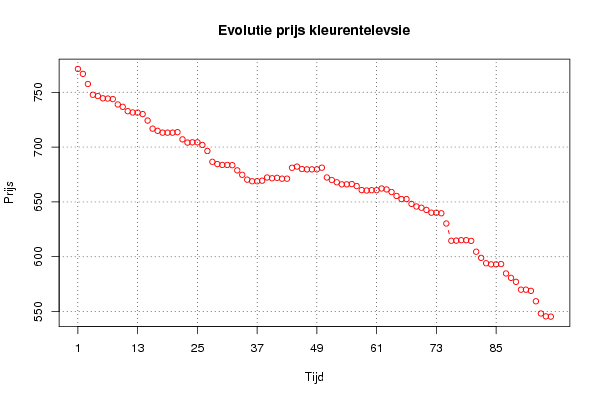
771.28 766.78 757.59 747.73 746.59 744.5 744.29 743.79 738.89 736.74 732.77 731.58 731.48 730.08 724.19 716.81 714.84 713.18 713.16 713.15 713.6 707.08 704.11 704.36 704.36 701.93 696.44 686.58 684.48 683.74 683.7 683.52 678.77 674.71 670.28 668.85 668.85 669.35 672.28 671.6 671.96 671.18 671.18 681.14 682.23 679.98 679.69 679.69 679.7 681.21 672.32 669.98 667.91 666.04 666.04 666.27 664.45 660.76 660.4 660.69 660.69 662.23 661.41 659.02 655.43 652.59 652.59 648.2 645.84 644.67 642.71 640.14 640.14 639.64 630.28 614.57 614.7 615.08 615.08 614.43 604.55 598.98 594.05 593.05 593.05 593.34 584.72 580.7 577.08 569.92 569.92 568.86 559.38 548.22 545.61 545.33 | |||||||||||||||||||||||||||||||||||||||||
Tables (Output of Computation) | |||||||||||||||||||||||||||||||||||||||||
| |||||||||||||||||||||||||||||||||||||||||
Figures (Output of Computation) | |||||||||||||||||||||||||||||||||||||||||
Input Parameters & R Code | |||||||||||||||||||||||||||||||||||||||||
| Parameters (Session): | |||||||||||||||||||||||||||||||||||||||||
| par1 = Prijzen Kleurentelevisie ; par2 = http://www.nbb.be/belgostat/PresentationLinker?Order=true&TableId=251000026&Lang=N&prop=null ; par3 = Evolutie van de prijzen ; par4 = 12 ; | |||||||||||||||||||||||||||||||||||||||||
| Parameters (R input): | |||||||||||||||||||||||||||||||||||||||||
| par1 = Prijzen Kleurentelevisie ; par2 = http://www.nbb.be/belgostat/PresentationLinker?Order=true&TableId=251000026&Lang=N&prop=null ; par3 = Evolutie van de prijzen ; par4 = 12 ; | |||||||||||||||||||||||||||||||||||||||||
| R code (references can be found in the software module): | |||||||||||||||||||||||||||||||||||||||||
if (par4 != 'No season') { | |||||||||||||||||||||||||||||||||||||||||