Free Statistics
of Irreproducible Research!
Description of Statistical Computation | |||||||||||||||||||||||||||||||||||||||||
|---|---|---|---|---|---|---|---|---|---|---|---|---|---|---|---|---|---|---|---|---|---|---|---|---|---|---|---|---|---|---|---|---|---|---|---|---|---|---|---|---|---|
| Author's title | |||||||||||||||||||||||||||||||||||||||||
| Author | *Unverified author* | ||||||||||||||||||||||||||||||||||||||||
| R Software Module | rwasp_univariatedataseries.wasp | ||||||||||||||||||||||||||||||||||||||||
| Title produced by software | Univariate Data Series | ||||||||||||||||||||||||||||||||||||||||
| Date of computation | Tue, 05 Oct 2010 14:00:34 +0000 | ||||||||||||||||||||||||||||||||||||||||
| Cite this page as follows | Statistical Computations at FreeStatistics.org, Office for Research Development and Education, URL https://freestatistics.org/blog/index.php?v=date/2010/Oct/05/t128628723340rjel3424c2d0l.htm/, Retrieved Sun, 28 Apr 2024 16:27:49 +0000 | ||||||||||||||||||||||||||||||||||||||||
| Statistical Computations at FreeStatistics.org, Office for Research Development and Education, URL https://freestatistics.org/blog/index.php?pk=81453, Retrieved Sun, 28 Apr 2024 16:27:49 +0000 | |||||||||||||||||||||||||||||||||||||||||
| QR Codes: | |||||||||||||||||||||||||||||||||||||||||
|
| |||||||||||||||||||||||||||||||||||||||||
| Original text written by user: | |||||||||||||||||||||||||||||||||||||||||
| IsPrivate? | No (this computation is public) | ||||||||||||||||||||||||||||||||||||||||
| User-defined keywords | KDGP1W1 | ||||||||||||||||||||||||||||||||||||||||
| Estimated Impact | 101 | ||||||||||||||||||||||||||||||||||||||||
Tree of Dependent Computations | |||||||||||||||||||||||||||||||||||||||||
| Family? (F = Feedback message, R = changed R code, M = changed R Module, P = changed Parameters, D = changed Data) | |||||||||||||||||||||||||||||||||||||||||
| - [Univariate Data Series] [] [2010-10-05 14:00:34] [e682c8b2f32588f1ce8624d4caf1be78] [Current] - RMP [Histogram] [] [2010-10-05 14:43:42] [b1f6d8dbeadd0fa6517eb94d633322ff] - RMP [Kernel Density Estimation] [] [2010-10-05 14:47:18] [b1f6d8dbeadd0fa6517eb94d633322ff] | |||||||||||||||||||||||||||||||||||||||||
| Feedback Forum | |||||||||||||||||||||||||||||||||||||||||
Post a new message | |||||||||||||||||||||||||||||||||||||||||
Dataset | |||||||||||||||||||||||||||||||||||||||||
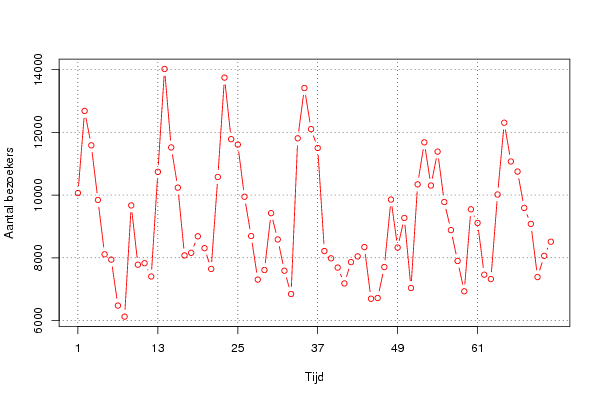
| Dataseries X: | |||||||||||||||||||||||||||||||||||||||||
10065 12684 11587 9843 8110 7940 6475 6121 9669 7778 7826 7403 10741 14023 11519 10236 8075 8157 8684 8306 7643 10577 13747 11783 11611 9946 8693 7303 7609 9423 8584 7586 6843 11811 13414 12103 11501 8213 7982 7687 7180 7862 8043 8340 6692 6715 7703 9856 8326 9269 7035 10342 11682 10304 11385 9777 8882 7897 6930 9545 9110 7459 7320 10017 12307 11072 10749 9589 9080 7384 8062 8511 | |||||||||||||||||||||||||||||||||||||||||
Tables (Output of Computation) | |||||||||||||||||||||||||||||||||||||||||
| |||||||||||||||||||||||||||||||||||||||||
Figures (Output of Computation) | |||||||||||||||||||||||||||||||||||||||||
Input Parameters & R Code | |||||||||||||||||||||||||||||||||||||||||
| Parameters (Session): | |||||||||||||||||||||||||||||||||||||||||
| par1 = Aantal bezoekers aan Hawaï vanuit Europa ; par2 = Blackboard ; par3 = Aantal bezoekers aan Hawaï vanuit Europa ; par4 = 12 ; | |||||||||||||||||||||||||||||||||||||||||
| Parameters (R input): | |||||||||||||||||||||||||||||||||||||||||
| par1 = Aantal bezoekers aan Hawaï vanuit Europa ; par2 = Blackboard ; par3 = Aantal bezoekers aan Hawaï vanuit Europa ; par4 = 12 ; | |||||||||||||||||||||||||||||||||||||||||
| R code (references can be found in the software module): | |||||||||||||||||||||||||||||||||||||||||
if (par4 != 'No season') { | |||||||||||||||||||||||||||||||||||||||||