Free Statistics
of Irreproducible Research!
Description of Statistical Computation | |||||||||||||||||||||||||||||||||||||||||
|---|---|---|---|---|---|---|---|---|---|---|---|---|---|---|---|---|---|---|---|---|---|---|---|---|---|---|---|---|---|---|---|---|---|---|---|---|---|---|---|---|---|
| Author's title | |||||||||||||||||||||||||||||||||||||||||
| Author | *Unverified author* | ||||||||||||||||||||||||||||||||||||||||
| R Software Module | rwasp_univariatedataseries.wasp | ||||||||||||||||||||||||||||||||||||||||
| Title produced by software | Univariate Data Series | ||||||||||||||||||||||||||||||||||||||||
| Date of computation | Tue, 05 Oct 2010 12:26:19 +0000 | ||||||||||||||||||||||||||||||||||||||||
| Cite this page as follows | Statistical Computations at FreeStatistics.org, Office for Research Development and Education, URL https://freestatistics.org/blog/index.php?v=date/2010/Oct/05/t1286281552rogwf14iavt3j74.htm/, Retrieved Sat, 27 Apr 2024 22:11:01 +0000 | ||||||||||||||||||||||||||||||||||||||||
| Statistical Computations at FreeStatistics.org, Office for Research Development and Education, URL https://freestatistics.org/blog/index.php?pk=81413, Retrieved Sat, 27 Apr 2024 22:11:01 +0000 | |||||||||||||||||||||||||||||||||||||||||
| QR Codes: | |||||||||||||||||||||||||||||||||||||||||
|
| |||||||||||||||||||||||||||||||||||||||||
| Original text written by user: | |||||||||||||||||||||||||||||||||||||||||
| IsPrivate? | No (this computation is public) | ||||||||||||||||||||||||||||||||||||||||
| User-defined keywords | KDGP1W1 | ||||||||||||||||||||||||||||||||||||||||
| Estimated Impact | 117 | ||||||||||||||||||||||||||||||||||||||||
Tree of Dependent Computations | |||||||||||||||||||||||||||||||||||||||||
| Family? (F = Feedback message, R = changed R code, M = changed R Module, P = changed Parameters, D = changed Data) | |||||||||||||||||||||||||||||||||||||||||
| - [Univariate Data Series] [Aantal personen l...] [2010-10-05 12:26:19] [5815de052410d7754c978b0de903e641] [Current] - RMPD [Histogram] [Frequentietabel p...] [2010-10-05 13:15:58] [8a02c60b4e489c76553df8621bda666b] - RMP [Kernel Density Estimation] [Dichtheidsgrafiek...] [2010-10-05 13:40:42] [8a02c60b4e489c76553df8621bda666b] | |||||||||||||||||||||||||||||||||||||||||
| Feedback Forum | |||||||||||||||||||||||||||||||||||||||||
Post a new message | |||||||||||||||||||||||||||||||||||||||||
Dataset | |||||||||||||||||||||||||||||||||||||||||
| Dataseries X: | |||||||||||||||||||||||||||||||||||||||||
100,4 97,7 97 96,5 98,4 106,3 103,1 102,4 95 98,1 106,1 99,1 101,2 95,5 99,8 97,1 97,5 96,8 97,7 100,9 94,3 99,5 100,8 97 99,2 101 102,3 97 91,2 97,6 95,7 100,5 94,4 102,9 105,1 98,8 100,7 99,6 107,7 102,9 101,6 102,7 110,5 109,8 94,3 102,5 105 102,3 107,7 100,3 99,5 95 97,7 96,3 97,8 106,4 96,1 106,2 114,7 111,9 121 117,7 115,4 114,3 109,5 108,1 108,2 99,1 101,2 98,1 95,5 97,9 98,2 98,7 95,6 95,8 94,4 96,5 103,3 104,3 104,5 102,3 103,8 103,1 102,2 106,3 102,1 94 102,6 102,6 106,7 107,9 109,3 105,9 109,1 108,5 111,7 109,8 109,1 108,5 108,5 106,2 117,1 109,8 115,2 115,9 119,2 121 118,6 117,6 114,6 110,6 102,5 101,6 107,4 105,8 102,8 104 100,4 100,6 | |||||||||||||||||||||||||||||||||||||||||
Tables (Output of Computation) | |||||||||||||||||||||||||||||||||||||||||
| |||||||||||||||||||||||||||||||||||||||||
Figures (Output of Computation) | |||||||||||||||||||||||||||||||||||||||||
Input Parameters & R Code | |||||||||||||||||||||||||||||||||||||||||
| Parameters (Session): | |||||||||||||||||||||||||||||||||||||||||
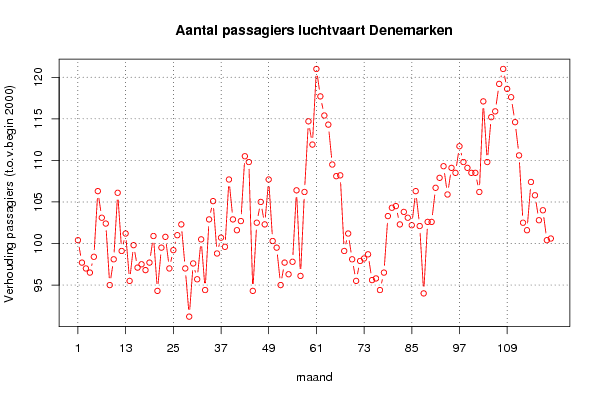
| par1 = Passagiers luchtverkeer Denemarken 2000-2009 ; par3 = Deze gegevensreeks geeft de verhouding weer tussen de passagiers in begin 2000 en de passagiers per maand van ieder jaar (2000-2009) ; par4 = 12 ; | |||||||||||||||||||||||||||||||||||||||||
| Parameters (R input): | |||||||||||||||||||||||||||||||||||||||||
| par1 = Passagiers luchtverkeer Denemarken 2000-2009 ; par2 = ; par3 = Deze gegevensreeks geeft de verhouding weer tussen de passagiers in begin 2000 en de passagiers per maand van ieder jaar (2000-2009) ; par4 = 12 ; | |||||||||||||||||||||||||||||||||||||||||
| R code (references can be found in the software module): | |||||||||||||||||||||||||||||||||||||||||
if (par4 != 'No season') { | |||||||||||||||||||||||||||||||||||||||||