Free Statistics
of Irreproducible Research!
Description of Statistical Computation | |||||||||||||||||||||||||||||||||||||||||
|---|---|---|---|---|---|---|---|---|---|---|---|---|---|---|---|---|---|---|---|---|---|---|---|---|---|---|---|---|---|---|---|---|---|---|---|---|---|---|---|---|---|
| Author's title | |||||||||||||||||||||||||||||||||||||||||
| Author | *Unverified author* | ||||||||||||||||||||||||||||||||||||||||
| R Software Module | rwasp_univariatedataseries.wasp | ||||||||||||||||||||||||||||||||||||||||
| Title produced by software | Univariate Data Series | ||||||||||||||||||||||||||||||||||||||||
| Date of computation | Mon, 04 Oct 2010 22:23:10 +0000 | ||||||||||||||||||||||||||||||||||||||||
| Cite this page as follows | Statistical Computations at FreeStatistics.org, Office for Research Development and Education, URL https://freestatistics.org/blog/index.php?v=date/2010/Oct/05/t1286231029a4xamcnwb7myw3y.htm/, Retrieved Sun, 28 Apr 2024 18:21:40 +0000 | ||||||||||||||||||||||||||||||||||||||||
| Statistical Computations at FreeStatistics.org, Office for Research Development and Education, URL https://freestatistics.org/blog/index.php?pk=81274, Retrieved Sun, 28 Apr 2024 18:21:40 +0000 | |||||||||||||||||||||||||||||||||||||||||
| QR Codes: | |||||||||||||||||||||||||||||||||||||||||
|
| |||||||||||||||||||||||||||||||||||||||||
| Original text written by user: | |||||||||||||||||||||||||||||||||||||||||
| IsPrivate? | No (this computation is public) | ||||||||||||||||||||||||||||||||||||||||
| User-defined keywords | KDGP1W1 | ||||||||||||||||||||||||||||||||||||||||
| Estimated Impact | 178 | ||||||||||||||||||||||||||||||||||||||||
Tree of Dependent Computations | |||||||||||||||||||||||||||||||||||||||||
| Family? (F = Feedback message, R = changed R code, M = changed R Module, P = changed Parameters, D = changed Data) | |||||||||||||||||||||||||||||||||||||||||
| - [Univariate Data Series] [Verkoopsindex via...] [2010-10-04 22:23:10] [836c64735fc21f091fd80eb090cba4d6] [Current] | |||||||||||||||||||||||||||||||||||||||||
| Feedback Forum | |||||||||||||||||||||||||||||||||||||||||
Post a new message | |||||||||||||||||||||||||||||||||||||||||
Dataset | |||||||||||||||||||||||||||||||||||||||||
| Dataseries X: | |||||||||||||||||||||||||||||||||||||||||
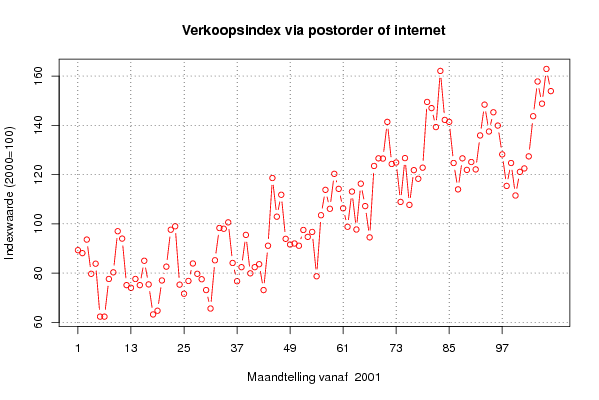
89.3 88.1 93.6 79.7 83.8 62.3 62.3 77.6 80.3 97 94 75.1 74 77.6 75.1 85 75.4 63.2 64.7 77 82.6 97.6 99 75.3 71.6 76.8 83.9 79.7 77.5 73.1 65.6 85.2 98.3 98 100.6 84.1 76.7 82.4 95.5 79.9 82.4 83.6 73.1 91.1 118.6 102.9 111.8 93.9 91.6 92 91.1 97.5 94.7 96.7 78.7 103.5 113.8 106.1 120.3 114.2 106.3 98.8 113.1 97.7 116.3 107.2 94.5 123.5 126.6 126.5 141.4 124.3 124.9 108.9 126.7 107.7 121.8 118.3 122.8 149.5 147 139.3 162.1 142.2 141.4 124.7 114 126.6 121.9 125.1 122.1 135.9 148.4 137.5 145.3 139.9 128.2 115.4 124.7 111.5 121.1 122.5 127.4 143.7 157.8 148.8 162.9 153.9 | |||||||||||||||||||||||||||||||||||||||||
Tables (Output of Computation) | |||||||||||||||||||||||||||||||||||||||||
| |||||||||||||||||||||||||||||||||||||||||
Figures (Output of Computation) | |||||||||||||||||||||||||||||||||||||||||
Input Parameters & R Code | |||||||||||||||||||||||||||||||||||||||||
| Parameters (Session): | |||||||||||||||||||||||||||||||||||||||||
| par1 = Verkoopsindex via postorder of internet ; par2 = Statbank Norway ; par3 = Het stelt de verkoopsindex via postorder of internet voor. ; par4 = 12 ; | |||||||||||||||||||||||||||||||||||||||||
| Parameters (R input): | |||||||||||||||||||||||||||||||||||||||||
| par1 = Verkoopsindex via postorder of internet ; par2 = Statbank Norway ; par3 = Het stelt de verkoopsindex via postorder of internet voor. ; par4 = 12 ; | |||||||||||||||||||||||||||||||||||||||||
| R code (references can be found in the software module): | |||||||||||||||||||||||||||||||||||||||||
if (par4 != 'No season') { | |||||||||||||||||||||||||||||||||||||||||