Free Statistics

of Irreproducible Research!

Author's title

Author*The author of this computation has been verified*
R Software Modulerwasp_notchedbox1.wasp
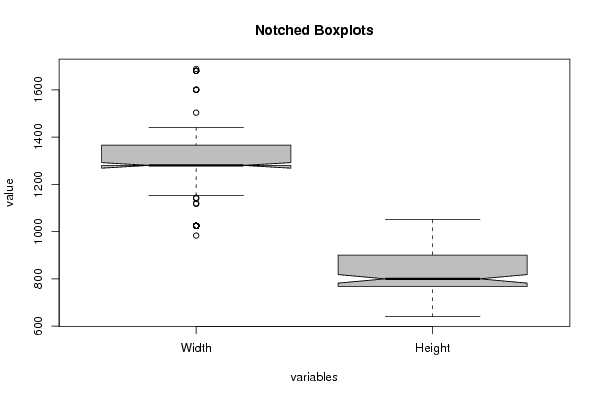
Title produced by softwareNotched Boxplots
Date of computationSat, 02 Oct 2010 17:05:05 +0000
Cite this page as followsStatistical Computations at FreeStatistics.org, Office for Research Development and Education, URL https://freestatistics.org/blog/index.php?v=date/2010/Oct/02/t1286039052d3drtvrnk4d3vjh.htm/, Retrieved Mon, 29 Apr 2024 18:37:16 +0000
Statistical Computations at FreeStatistics.org, Office for Research Development and Education, URL https://freestatistics.org/blog/index.php?pk=80075, Retrieved Mon, 29 Apr 2024 18:37:16 +0000
QR Codes:

Original text written by user:
IsPrivate?No (this computation is public)
User-defined keywords
Estimated Impact216
Family? (F = Feedback message, R = changed R code, M = changed R Module, P = changed Parameters, D = changed Data)
-     [Notched Boxplots] [Screen Width and ...] [2010-09-25 10:03:47] [b98453cac15ba1066b407e146608df68]
F   PD    [Notched Boxplots] [Notched Boxplots] [2010-10-02 17:05:05] [99c051a77087383325372ff23bc64341] [Current]
-   PD      [Notched Boxplots] [Boxplot verbeteri...] [2010-10-09 10:29:36] [1afa3497b02a8d7c9f6727c1b17b89b2]
Feedback Forum
2010-10-09 11:35:17 [Kim Van Assche] [reply
Task 7: De weergave van de boxplot is volgens mij fout. ik heb een nieuwe gemaakt: http://www.freestatistics.org/blog/index.php?v=date/2010/Oct/09/t1286620156p0mrtwusgo9ekhg.htm/. Er zijn nog outliers te zien, dit is niet de bedoeling. De extreme waarden heb ik weggelaten en de sample range aangepast. De onderkant van de boxplot geeft het 25ste percentiel weer en het bovenste het 75ste. Wanneer we outliers uitschakelen zien we een beter resultaat. 50% van de studenten heeft een scherm van 800 x 1280
2010-10-10 09:17:42 [Andries Achten] [reply
Zoals hierboven vermeld zouden de uitschieters allemaal verwijderd moeten zijn om geen vertekend beeld te krijgen. De uitschieters verwijderen kan ofwel handmatig (extreme waarden verwijderen uit data) of via het aanpassen van de R code. Als de uitschieters verwijderd hebben (zoals de link hierboven) dan kunnen we besluiten dat de uitshieters niet echt invloed hadden op de boxplot, we krijgen ongeveer dezelfde boxplot dus deze is niet gevoelig voor uitschieters.

Post a new message
Dataseries X:
1280	1024
1024	768
1120	700
1024	768
1280	800
1280	1024
1280	800
1024	768
1280	800
1280	1024
1280	800
1280	800
1280	1024
1688	949
1440	900
1280	800
1280	800
1280	768
1176	735
1280	800
1503	845
1440	900
1366	768
1280	768
1024	768
1280	800
1280	768
1024	768
1280	1024
1280	800
1440	900
1280	800
1440	900
1024	768
1440	900
1143	857
1280	800
1440	900
1280	800
1366	768
1024	768
1408	880
1366	768
1176	735
1257	785
1280	800
1280	800
1440	900
1680	1050
1440	900
1024	768
1140	641
1280	1024
1280	800
1280	800
1280	800
1280	800
1440	900
1280	800
1152	864
1280	1024
1280	800
1440	900
1280	800
1280	1024
1440	900
1280	800
1280	800
1440	900
1280	800
1280	1024
1600	900
1024	768
1366	768
1280	800
1280	800
1440	900
1366	768
1280	800
1024	768
1280	800
1440	900
1280	800
1280	800
1408	880
1280	800
1600	900
1600	900
1680	1050
1440	900
1440	900
1280	800
1280	800
1280	800
1280	800
1024	768
1366	768
1440	900
1280	800
1280	1024
1024	768
1024	768
1600	900
1117	698
1440	900
983	737
1024	768
1024	640
1280	800
1440	900
1280	800
1280	800
1280	800
1440	900
1280	800
1024	768
1024	768
1152	864
1280	768
1024	768
1366	768
1680	1050
1680	1050
1280	800
1366	768
1024	768
1440	900
1024	768
1280	800
1280	800
1280	800
1024	768
1280	800


Summary of computational transaction
Raw Inputview raw input (R code)
Raw Outputview raw output of R engine
Computing time4 seconds
R Server'George Udny Yule' @ 72.249.76.132

\begin{tabular}{lllllllll}
\hline
Summary of computational transaction \tabularnewline
Raw Input & view raw input (R code)  \tabularnewline
Raw Output & view raw output of R engine  \tabularnewline
Computing time & 4 seconds \tabularnewline
R Server & 'George Udny Yule' @ 72.249.76.132 \tabularnewline
\hline
\end{tabular}
%Source: https://freestatistics.org/blog/index.php?pk=80075&T=0

[TABLE]
[ROW][C]Summary of computational transaction[/C][/ROW]
[ROW][C]Raw Input[/C][C]view raw input (R code) [/C][/ROW]
[ROW][C]Raw Output[/C][C]view raw output of R engine [/C][/ROW]
[ROW][C]Computing time[/C][C]4 seconds[/C][/ROW]
[ROW][C]R Server[/C][C]'George Udny Yule' @ 72.249.76.132[/C][/ROW]
[/TABLE]
Source: https://freestatistics.org/blog/index.php?pk=80075&T=0

Globally Unique Identifier (entire table): ba.freestatistics.org/blog/index.php?pk=80075&T=0

As an alternative you can also use a QR Code:  

The GUIDs for individual cells are displayed in the table below:

Summary of computational transaction
Raw Inputview raw input (R code)
Raw Outputview raw output of R engine
Computing time4 seconds
R Server'George Udny Yule' @ 72.249.76.132


Boxplot statistics
Variablelower whiskerlower hingemedianupper hingeupper whisker
Width11521280128013661440
Height6407688009001050

\begin{tabular}{lllllllll}
\hline
Boxplot statistics \tabularnewline
Variable & lower whisker & lower hinge & median & upper hinge & upper whisker \tabularnewline
Width & 1152 & 1280 & 1280 & 1366 & 1440 \tabularnewline
Height & 640 & 768 & 800 & 900 & 1050 \tabularnewline
\hline
\end{tabular}
%Source: https://freestatistics.org/blog/index.php?pk=80075&T=1

[TABLE]
[ROW][C]Boxplot statistics[/C][/ROW]
[ROW][C]Variable[/C][C]lower whisker[/C][C]lower hinge[/C][C]median[/C][C]upper hinge[/C][C]upper whisker[/C][/ROW]
[ROW][C]Width[/C][C]1152[/C][C]1280[/C][C]1280[/C][C]1366[/C][C]1440[/C][/ROW]
[ROW][C]Height[/C][C]640[/C][C]768[/C][C]800[/C][C]900[/C][C]1050[/C][/ROW]
[/TABLE]
Source: https://freestatistics.org/blog/index.php?pk=80075&T=1

Globally Unique Identifier (entire table): ba.freestatistics.org/blog/index.php?pk=80075&T=1

As an alternative you can also use a QR Code:  

The GUIDs for individual cells are displayed in the table below:

Boxplot statistics
Variablelower whiskerlower hingemedianupper hingeupper whisker
Width11521280128013661440
Height6407688009001050


Boxplot Notches
Variablelower boundmedianupper bound
Width1268.2177097341112801291.78229026589
Height781.915554475605800818.084445524395

\begin{tabular}{lllllllll}
\hline
Boxplot Notches \tabularnewline
Variable & lower bound & median & upper bound \tabularnewline
Width & 1268.21770973411 & 1280 & 1291.78229026589 \tabularnewline
Height & 781.915554475605 & 800 & 818.084445524395 \tabularnewline
\hline
\end{tabular}
%Source: https://freestatistics.org/blog/index.php?pk=80075&T=2

[TABLE]
[ROW][C]Boxplot Notches[/C][/ROW]
[ROW][C]Variable[/C][C]lower bound[/C][C]median[/C][C]upper bound[/C][/ROW]
[ROW][C]Width[/C][C]1268.21770973411[/C][C]1280[/C][C]1291.78229026589[/C][/ROW]
[ROW][C]Height[/C][C]781.915554475605[/C][C]800[/C][C]818.084445524395[/C][/ROW]
[/TABLE]
Source: https://freestatistics.org/blog/index.php?pk=80075&T=2

Globally Unique Identifier (entire table): ba.freestatistics.org/blog/index.php?pk=80075&T=2

As an alternative you can also use a QR Code:  

The GUIDs for individual cells are displayed in the table below:

Boxplot Notches
Variablelower boundmedianupper bound
Width1268.2177097341112801291.78229026589
Height781.915554475605800818.084445524395


Parameters (Session):
par1 = 9 ; par2 = grey ; par3 = FALSE ; par4 = Unknown ;
Parameters (R input):
par1 = grey ;
R code (references can be found in the software module):
z <- as.data.frame(t(y))
bitmap(file='test1.png')
(r<-boxplot(z ,xlab=xlab,ylab=ylab,main=main,notch=TRUE,col=par1))
dev.off()
load(file='createtable')
a<-table.start()
a<-table.row.start(a)
a<-table.element(a,hyperlink('overview.htm','Boxplot statistics','Boxplot overview'),6,TRUE)
a<-table.row.end(a)
a<-table.row.start(a)
a<-table.element(a,'Variable',1,TRUE)
a<-table.element(a,hyperlink('lower_whisker.htm','lower whisker','definition of lower whisker'),1,TRUE)
a<-table.element(a,hyperlink('lower_hinge.htm','lower hinge','definition of lower hinge'),1,TRUE)
a<-table.element(a,hyperlink('central_tendency.htm','median','definitions about measures of central tendency'),1,TRUE)
a<-table.element(a,hyperlink('upper_hinge.htm','upper hinge','definition of upper hinge'),1,TRUE)
a<-table.element(a,hyperlink('upper_whisker.htm','upper whisker','definition of upper whisker'),1,TRUE)
a<-table.row.end(a)
for (i in 1:length(y[,1]))
{
a<-table.row.start(a)
a<-table.element(a,dimnames(t(x))[[2]][i],1,TRUE)
for (j in 1:5)
{
a<-table.element(a,r$stats[j,i])
}
a<-table.row.end(a)
}
a<-table.end(a)
table.save(a,file='mytable.tab')
a<-table.start()
a<-table.row.start(a)
a<-table.element(a,'Boxplot Notches',4,TRUE)
a<-table.row.end(a)
a<-table.row.start(a)
a<-table.element(a,'Variable',1,TRUE)
a<-table.element(a,'lower bound',1,TRUE)
a<-table.element(a,'median',1,TRUE)
a<-table.element(a,'upper bound',1,TRUE)
a<-table.row.end(a)
for (i in 1:length(y[,1]))
{
a<-table.row.start(a)
a<-table.element(a,dimnames(t(x))[[2]][i],1,TRUE)
a<-table.element(a,r$conf[1,i])
a<-table.element(a,r$stats[3,i])
a<-table.element(a,r$conf[2,i])
a<-table.row.end(a)
}
a<-table.end(a)
table.save(a,file='mytable1.tab')