Free Statistics
of Irreproducible Research!
Description of Statistical Computation | |||||||||||||||||||||||||||||||||||||||||
|---|---|---|---|---|---|---|---|---|---|---|---|---|---|---|---|---|---|---|---|---|---|---|---|---|---|---|---|---|---|---|---|---|---|---|---|---|---|---|---|---|---|
| Author's title | |||||||||||||||||||||||||||||||||||||||||
| Author | *Unverified author* | ||||||||||||||||||||||||||||||||||||||||
| R Software Module | rwasp_univariatedataseries.wasp | ||||||||||||||||||||||||||||||||||||||||
| Title produced by software | Univariate Data Series | ||||||||||||||||||||||||||||||||||||||||
| Date of computation | Sat, 02 Oct 2010 12:35:16 +0000 | ||||||||||||||||||||||||||||||||||||||||
| Cite this page as follows | Statistical Computations at FreeStatistics.org, Office for Research Development and Education, URL https://freestatistics.org/blog/index.php?v=date/2010/Oct/02/t1286023096rzs2rrkabyh7f6h.htm/, Retrieved Mon, 29 Apr 2024 19:28:18 +0000 | ||||||||||||||||||||||||||||||||||||||||
| Statistical Computations at FreeStatistics.org, Office for Research Development and Education, URL https://freestatistics.org/blog/index.php?pk=79987, Retrieved Mon, 29 Apr 2024 19:28:18 +0000 | |||||||||||||||||||||||||||||||||||||||||
| QR Codes: | |||||||||||||||||||||||||||||||||||||||||
|
| |||||||||||||||||||||||||||||||||||||||||
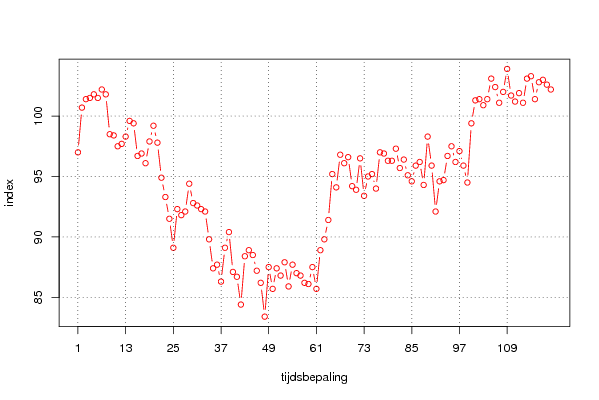
| Original text written by user: | Deze reeks stelt de consumptieprijsindex van koffie voor in Denemarken. Zo wordt dus de gemiddelde prijs van koffie door de jaren (en maanden) heen weergegeven in een bepaalde regio (Denemarken). | ||||||||||||||||||||||||||||||||||||||||
| IsPrivate? | No (this computation is public) | ||||||||||||||||||||||||||||||||||||||||
| User-defined keywords | KDGP1W1 | ||||||||||||||||||||||||||||||||||||||||
| Estimated Impact | 130 | ||||||||||||||||||||||||||||||||||||||||
Tree of Dependent Computations | |||||||||||||||||||||||||||||||||||||||||
| Family? (F = Feedback message, R = changed R code, M = changed R Module, P = changed Parameters, D = changed Data) | |||||||||||||||||||||||||||||||||||||||||
| - [Univariate Data Series] [consumentenprijsi...] [2010-10-02 12:35:16] [97983bf7277c2e38098275bb77d0f83a] [Current] - D [Univariate Data Series] [Frequentietabel a...] [2010-10-05 17:44:39] [74be16979710d4c4e7c6647856088456] | |||||||||||||||||||||||||||||||||||||||||
| Feedback Forum | |||||||||||||||||||||||||||||||||||||||||
Post a new message | |||||||||||||||||||||||||||||||||||||||||
Dataset | |||||||||||||||||||||||||||||||||||||||||
| Dataseries X: | |||||||||||||||||||||||||||||||||||||||||
97 100,7 101,4 101,5 101,8 101,5 102,2 101,8 98,5 98,4 97,5 97,7 98,3 99,6 99,4 96,7 96,9 96,1 97,9 99,2 97,8 94,9 93,3 91,5 89,1 92,3 91,8 92,1 94,4 92,8 92,6 92,3 92,1 89,8 87,4 87,7 86,3 89,1 90,4 87,1 86,7 84,4 88,4 88,9 88,5 87,2 86,2 83,4 87,5 85,7 87,4 86,8 87,9 85,9 87,7 87 86,8 86,2 86,1 87,5 85,7 88,9 89,8 91,4 95,2 94,1 96,8 96,1 96,6 94,2 93,9 96,5 93,4 95 95,2 94 97 96,9 96,3 96,3 97,3 95,7 96,4 95,1 94,6 95,9 96,2 94,3 98,3 95,9 92,1 94,6 94,7 96,7 97,5 96,2 97,1 95,9 94,5 99,4 101,3 101,4 100,9 101,4 103,1 102,4 101,1 102 103,9 101,7 101,2 101,9 101,1 103,1 103,3 101,4 102,8 103 102,6 102,2 | |||||||||||||||||||||||||||||||||||||||||
Tables (Output of Computation) | |||||||||||||||||||||||||||||||||||||||||
| |||||||||||||||||||||||||||||||||||||||||
Figures (Output of Computation) | |||||||||||||||||||||||||||||||||||||||||
Input Parameters & R Code | |||||||||||||||||||||||||||||||||||||||||
| Parameters (Session): | |||||||||||||||||||||||||||||||||||||||||
| par1 = consumptieprijsindex van koffie in Denemarken ; par2 = Statbank Denmark ; par4 = 12 ; | |||||||||||||||||||||||||||||||||||||||||
| Parameters (R input): | |||||||||||||||||||||||||||||||||||||||||
| par1 = consumptieprijsindex van koffie in Denemarken ; par2 = Statbank Denmark ; par3 = ; par4 = 12 ; | |||||||||||||||||||||||||||||||||||||||||
| R code (references can be found in the software module): | |||||||||||||||||||||||||||||||||||||||||
if (par4 != 'No season') { | |||||||||||||||||||||||||||||||||||||||||