| Multiple Linear Regression - Estimated Regression Equation |
| Crudeoilprice[t] = + 52.80975 -1.64053472222217M1[t] -1.52848611111111M2[t] + 3.6735625M3[t] + 6.90961111111112M4[t] + 10.3836597222222M5[t] + 15.9397083333333M6[t] + 16.9277569444445M7[t] + 15.1318055555556M8[t] + 11.5758541666667M9[t] + 6.6699027777778M10[t] + 3.9739513888889M11[t] + 0.365951388888888t + e[t] |
| Multiple Linear Regression - Ordinary Least Squares | |||||
| Variable | Parameter | S.D. | T-STAT H0: parameter = 0 | 2-tail p-value | 1-tail p-value |
| (Intercept) | 52.80975 | 11.467838 | 4.605 | 3.2e-05 | 1.6e-05 |
| M1 | -1.64053472222217 | 13.951267 | -0.1176 | 0.906893 | 0.453447 |
| M2 | -1.52848611111111 | 13.930422 | -0.1097 | 0.913096 | 0.456548 |
| M3 | 3.6735625 | 13.911536 | 0.2641 | 0.792884 | 0.396442 |
| M4 | 6.90961111111112 | 13.894616 | 0.4973 | 0.621305 | 0.310653 |
| M5 | 10.3836597222222 | 13.87967 | 0.7481 | 0.458115 | 0.229058 |
| M6 | 15.9397083333333 | 13.866704 | 1.1495 | 0.256168 | 0.128084 |
| M7 | 16.9277569444445 | 13.855722 | 1.2217 | 0.227908 | 0.113954 |
| M8 | 15.1318055555556 | 13.846731 | 1.0928 | 0.280048 | 0.140024 |
| M9 | 11.5758541666667 | 13.839734 | 0.8364 | 0.40715 | 0.203575 |
| M10 | 6.6699027777778 | 13.834734 | 0.4821 | 0.631963 | 0.315982 |
| M11 | 3.9739513888889 | 13.831733 | 0.2873 | 0.77514 | 0.38757 |
| t | 0.365951388888888 | 0.166358 | 2.1998 | 0.032775 | 0.016388 |
| Multiple Linear Regression - Regression Statistics | |
| Multiple R | 0.430197138182165 |
| R-squared | 0.185069577700125 |
| Adjusted R-squared | -0.0229977641636727 |
| F-TEST (value) | 0.889469611339932 |
| F-TEST (DF numerator) | 12 |
| F-TEST (DF denominator) | 47 |
| p-value | 0.563345577233602 |
| Multiple Linear Regression - Residual Statistics | |
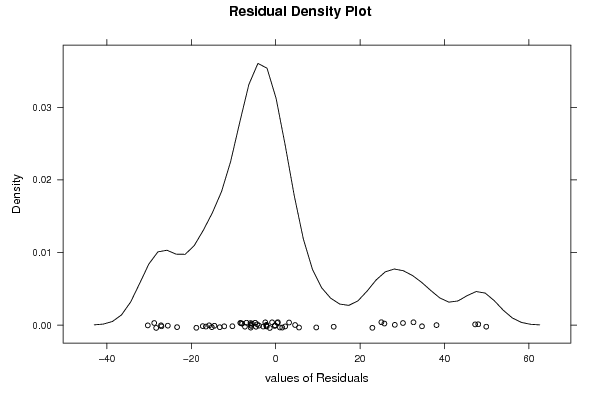
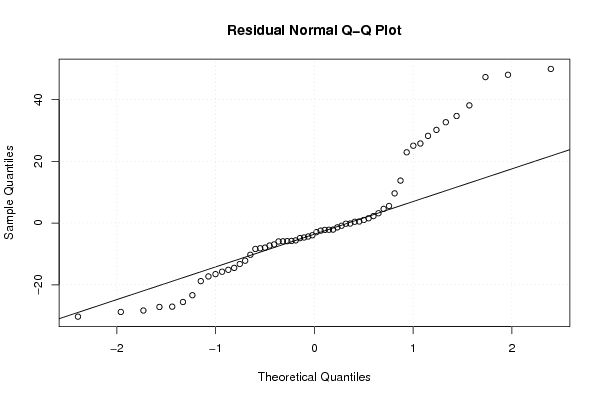
| Residual Standard Deviation | 21.8683087123745 |
| Sum Squared Residuals | 22476.4775191667 |
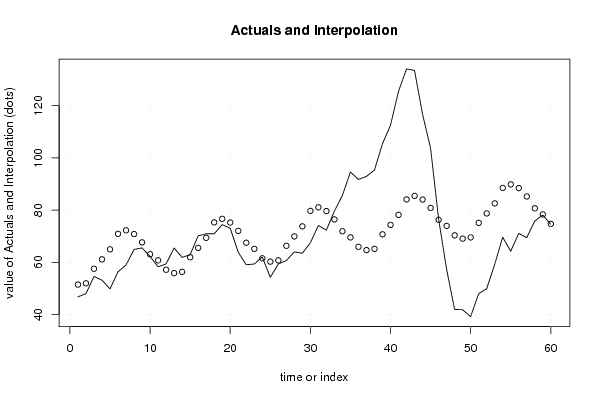
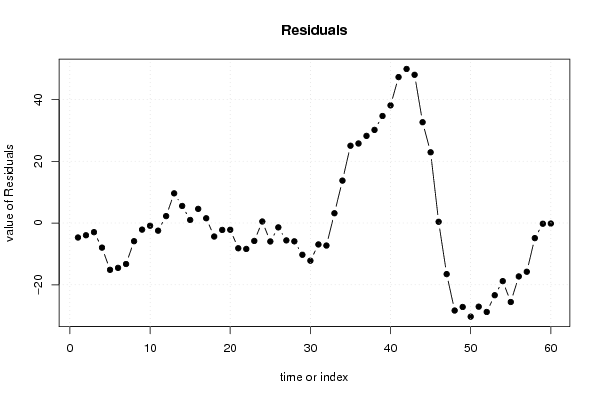
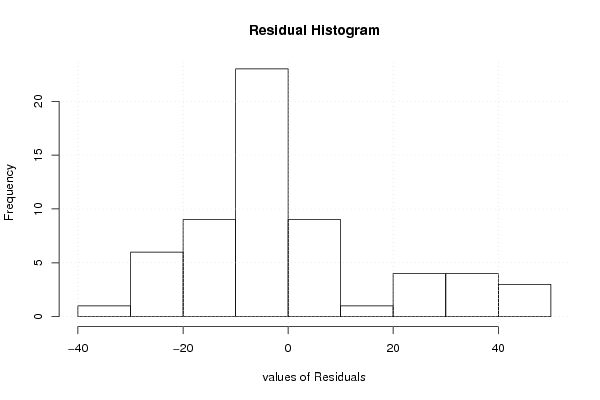
| Multiple Linear Regression - Actuals, Interpolation, and Residuals | |||
| Time or Index | Actuals | Interpolation Forecast | Residuals Prediction Error |
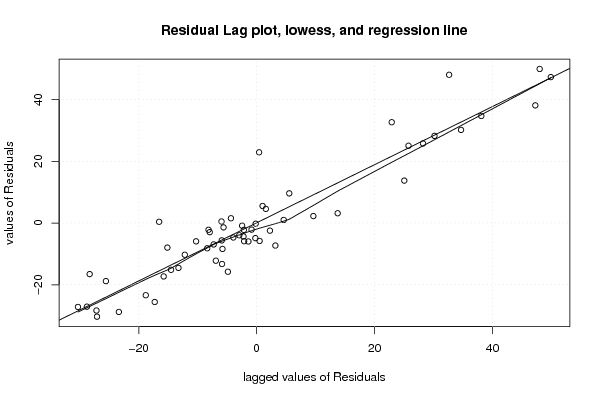
| 1 | 46.85 | 51.5351666666665 | -4.68516666666653 |
| 2 | 48.05 | 52.0131666666667 | -3.96316666666669 |
| 3 | 54.63 | 57.5811666666667 | -2.95116666666668 |
| 4 | 53.22 | 61.1831666666666 | -7.96316666666663 |
| 5 | 49.87 | 65.0231666666667 | -15.1531666666667 |
| 6 | 56.42 | 70.9451666666667 | -14.5251666666667 |
| 7 | 59.03 | 72.2991666666667 | -13.2691666666667 |
| 8 | 64.99 | 70.8691666666667 | -5.87916666666668 |
| 9 | 65.55 | 67.6791666666667 | -2.12916666666667 |
| 10 | 62.27 | 63.1391666666667 | -0.869166666666666 |
| 11 | 58.34 | 60.8091666666667 | -2.46916666666667 |
| 12 | 59.45 | 57.2011666666667 | 2.24883333333334 |
| 13 | 65.54 | 55.9265833333334 | 9.61341666666665 |
| 14 | 61.93 | 56.4045833333333 | 5.52541666666666 |
| 15 | 62.97 | 61.9725833333333 | 0.99741666666666 |
| 16 | 70.16 | 65.5745833333333 | 4.58541666666666 |
| 17 | 70.96 | 69.4145833333333 | 1.54541666666666 |
| 18 | 70.97 | 75.3365833333333 | -4.36658333333334 |
| 19 | 74.46 | 76.6905833333333 | -2.23058333333335 |
| 20 | 73.08 | 75.2605833333333 | -2.18058333333334 |
| 21 | 63.9 | 72.0705833333333 | -8.17058333333334 |
| 22 | 59.14 | 67.5305833333333 | -8.39058333333334 |
| 23 | 59.4 | 65.2005833333333 | -5.80058333333334 |
| 24 | 62.09 | 61.5925833333333 | 0.497416666666681 |
| 25 | 54.35 | 60.318 | -5.96800000000004 |
| 26 | 59.39 | 60.796 | -1.40600000000000 |
| 27 | 60.74 | 66.364 | -5.624 |
| 28 | 64.04 | 69.966 | -5.92599999999999 |
| 29 | 63.53 | 73.806 | -10.276 |
| 30 | 67.53 | 79.728 | -12.198 |
| 31 | 74.15 | 81.082 | -6.932 |
| 32 | 72.36 | 79.652 | -7.292 |
| 33 | 79.63 | 76.462 | 3.168 |
| 34 | 85.66 | 71.922 | 13.738 |
| 35 | 94.63 | 69.592 | 25.038 |
| 36 | 91.74 | 65.984 | 25.756 |
| 37 | 92.93 | 64.7094166666667 | 28.2205833333333 |
| 38 | 95.35 | 65.1874166666667 | 30.1625833333333 |
| 39 | 105.42 | 70.7554166666667 | 34.6645833333333 |
| 40 | 112.46 | 74.3574166666667 | 38.1025833333333 |
| 41 | 125.46 | 78.1974166666667 | 47.2625833333333 |
| 42 | 134.02 | 84.1194166666667 | 49.9005833333334 |
| 43 | 133.48 | 85.4734166666667 | 48.0065833333333 |
| 44 | 116.69 | 84.0434166666667 | 32.6465833333333 |
| 45 | 103.76 | 80.8534166666667 | 22.9065833333333 |
| 46 | 76.72 | 76.3134166666667 | 0.406583333333334 |
| 47 | 57.44 | 73.9834166666667 | -16.5434166666667 |
| 48 | 42.04 | 70.3754166666667 | -28.3354166666667 |
| 49 | 41.92 | 69.1008333333334 | -27.1808333333334 |
| 50 | 39.26 | 69.5788333333333 | -30.3188333333333 |
| 51 | 48.06 | 75.1468333333333 | -27.0868333333333 |
| 52 | 49.95 | 78.7488333333333 | -28.7988333333333 |
| 53 | 59.21 | 82.5888333333333 | -23.3788333333333 |
| 54 | 69.7 | 88.5108333333333 | -18.8108333333333 |
| 55 | 64.29 | 89.8648333333333 | -25.5748333333333 |
| 56 | 71.14 | 88.4348333333333 | -17.2948333333333 |
| 57 | 69.47 | 85.2448333333333 | -15.7748333333333 |
| 58 | 75.82 | 80.7048333333333 | -4.88483333333333 |
| 59 | 78.15 | 78.3748333333333 | -0.224833333333324 |
| 60 | 74.6 | 74.7668333333333 | -0.166833333333314 |
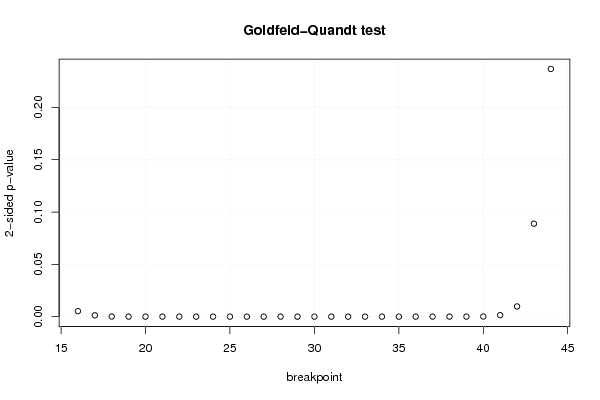
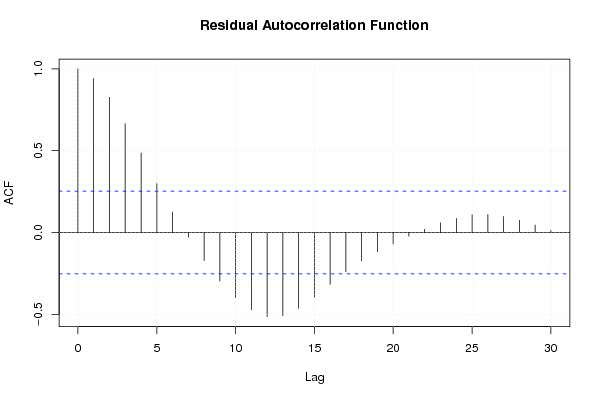
| Goldfeld-Quandt test for Heteroskedasticity | |||
| p-values | Alternative Hypothesis | ||
| breakpoint index | greater | 2-sided | less |
| 16 | 0.00263053886931193 | 0.00526107773862387 | 0.997369461130688 |
| 17 | 0.00063186857559217 | 0.00126373715118434 | 0.999368131424408 |
| 18 | 7.34641743466015e-05 | 0.000146928348693203 | 0.999926535825653 |
| 19 | 7.56746256307722e-06 | 1.51349251261544e-05 | 0.999992432537437 |
| 20 | 2.88995603352467e-06 | 5.77991206704933e-06 | 0.999997110043966 |
| 21 | 1.3740556288444e-05 | 2.7481112576888e-05 | 0.999986259443712 |
| 22 | 1.82225554028152e-05 | 3.64451108056304e-05 | 0.999981777444597 |
| 23 | 7.52575243867712e-06 | 1.50515048773542e-05 | 0.999992474247561 |
| 24 | 2.22725955859776e-06 | 4.45451911719552e-06 | 0.999997772740441 |
| 25 | 2.76103348583162e-06 | 5.52206697166324e-06 | 0.999997238966514 |
| 26 | 8.20603256876916e-07 | 1.64120651375383e-06 | 0.999999179396743 |
| 27 | 3.06150426693875e-07 | 6.12300853387751e-07 | 0.999999693849573 |
| 28 | 1.05196928216101e-07 | 2.10393856432202e-07 | 0.999999894803072 |
| 29 | 4.60776990022425e-08 | 9.21553980044849e-08 | 0.999999953922301 |
| 30 | 3.04172723222194e-08 | 6.08345446444388e-08 | 0.999999969582728 |
| 31 | 1.92152636098083e-08 | 3.84305272196167e-08 | 0.999999980784736 |
| 32 | 2.11392849930122e-08 | 4.22785699860244e-08 | 0.999999978860715 |
| 33 | 3.03014407716362e-08 | 6.06028815432723e-08 | 0.99999996969856 |
| 34 | 1.60663035611125e-07 | 3.21326071222249e-07 | 0.999999839336964 |
| 35 | 2.62510739550891e-06 | 5.25021479101782e-06 | 0.999997374892605 |
| 36 | 5.25595625307418e-06 | 1.05119125061484e-05 | 0.999994744043747 |
| 37 | 8.52552973774598e-06 | 1.70510594754920e-05 | 0.999991474470262 |
| 38 | 1.18880723280486e-05 | 2.37761446560972e-05 | 0.999988111927672 |
| 39 | 2.7223710540691e-05 | 5.4447421081382e-05 | 0.99997277628946 |
| 40 | 7.76653677387382e-05 | 0.000155330735477476 | 0.99992233463226 |
| 41 | 0.000714205485848743 | 0.00142841097169749 | 0.99928579451415 |
| 42 | 0.00487908051233727 | 0.00975816102467455 | 0.995120919487663 |
| 43 | 0.0444397785160251 | 0.0888795570320501 | 0.955560221483975 |
| 44 | 0.118399872576986 | 0.236799745153973 | 0.881600127423014 |
| Meta Analysis of Goldfeld-Quandt test for Heteroskedasticity | |||
| Description | # significant tests | % significant tests | OK/NOK |
| 1% type I error level | 27 | 0.93103448275862 | NOK |
| 5% type I error level | 27 | 0.93103448275862 | NOK |
| 10% type I error level | 28 | 0.96551724137931 | NOK |