Free Statistics

of Irreproducible Research!

Author's title

Author*The author of this computation has been verified*
R Software Modulerwasp_exponentialsmoothing.wasp
Title produced by softwareExponential Smoothing
Date of computationTue, 30 Nov 2010 19:48:44 +0000
Cite this page as followsStatistical Computations at FreeStatistics.org, Office for Research Development and Education, URL https://freestatistics.org/blog/index.php?v=date/2010/Nov/30/t129114699062lxe92rvy7ef0e.htm/, Retrieved Mon, 29 Apr 2024 12:42:07 +0000
Statistical Computations at FreeStatistics.org, Office for Research Development and Education, URL https://freestatistics.org/blog/index.php?pk=103802, Retrieved Mon, 29 Apr 2024 12:42:07 +0000
QR Codes:

Original text written by user:
IsPrivate?No (this computation is public)
User-defined keywords
Estimated Impact171
Family? (F = Feedback message, R = changed R code, M = changed R Module, P = changed Parameters, D = changed Data)
-     [Exponential Smoothing] [HPC Retail Sales] [2008-03-10 17:56:43] [74be16979710d4c4e7c6647856088456]
-  M D    [Exponential Smoothing] [Workshop 8 - blog 2] [2010-11-30 19:48:44] [47bfda5353cd53c1cf7ea7aa9038654a] [Current]
Feedback Forum

Post a new message
Dataseries X:
219,3
211,1
215,2
240,2
242,2
240,7
255,4
253
218,2
203,7
205,6
215,6
188,5
202,9
214
230,3
230
241
259,6
247,8
270,3
289,7
322,7
315
320,2
329,5
360,6
382,2
435,4
464
468,8
403
351,6
252
188
146,5
152,9
148,1
165,1
177
206,1
244,9
228,6
253,4
241,1
261,4
273,7
263,7
272,5
263,2
279,8
298,1
267,6
264,3
264,3
268,7
269,1
288,6


Summary of computational transaction
Raw Inputview raw input (R code)
Raw Outputview raw output of R engine
Computing time2 seconds
R Server'George Udny Yule' @ 72.249.76.132

\begin{tabular}{lllllllll}
\hline
Summary of computational transaction \tabularnewline
Raw Input & view raw input (R code)  \tabularnewline
Raw Output & view raw output of R engine  \tabularnewline
Computing time & 2 seconds \tabularnewline
R Server & 'George Udny Yule' @ 72.249.76.132 \tabularnewline
\hline
\end{tabular}
%Source: https://freestatistics.org/blog/index.php?pk=103802&T=0

[TABLE]
[ROW][C]Summary of computational transaction[/C][/ROW]
[ROW][C]Raw Input[/C][C]view raw input (R code) [/C][/ROW]
[ROW][C]Raw Output[/C][C]view raw output of R engine [/C][/ROW]
[ROW][C]Computing time[/C][C]2 seconds[/C][/ROW]
[ROW][C]R Server[/C][C]'George Udny Yule' @ 72.249.76.132[/C][/ROW]
[/TABLE]
Source: https://freestatistics.org/blog/index.php?pk=103802&T=0

Globally Unique Identifier (entire table): ba.freestatistics.org/blog/index.php?pk=103802&T=0

As an alternative you can also use a QR Code:  

The GUIDs for individual cells are displayed in the table below:

Summary of computational transaction
Raw Inputview raw input (R code)
Raw Outputview raw output of R engine
Computing time2 seconds
R Server'George Udny Yule' @ 72.249.76.132


Estimated Parameters of Exponential Smoothing
ParameterValue
alpha1
beta0
gamma0

\begin{tabular}{lllllllll}
\hline
Estimated Parameters of Exponential Smoothing \tabularnewline
Parameter & Value \tabularnewline
alpha & 1 \tabularnewline
beta & 0 \tabularnewline
gamma & 0 \tabularnewline
\hline
\end{tabular}
%Source: https://freestatistics.org/blog/index.php?pk=103802&T=1

[TABLE]
[ROW][C]Estimated Parameters of Exponential Smoothing[/C][/ROW]
[ROW][C]Parameter[/C][C]Value[/C][/ROW]
[ROW][C]alpha[/C][C]1[/C][/ROW]
[ROW][C]beta[/C][C]0[/C][/ROW]
[ROW][C]gamma[/C][C]0[/C][/ROW]
[/TABLE]
Source: https://freestatistics.org/blog/index.php?pk=103802&T=1

Globally Unique Identifier (entire table): ba.freestatistics.org/blog/index.php?pk=103802&T=1

As an alternative you can also use a QR Code:  

The GUIDs for individual cells are displayed in the table below:

Estimated Parameters of Exponential Smoothing
ParameterValue
alpha1
beta0
gamma0


Interpolation Forecasts of Exponential Smoothing
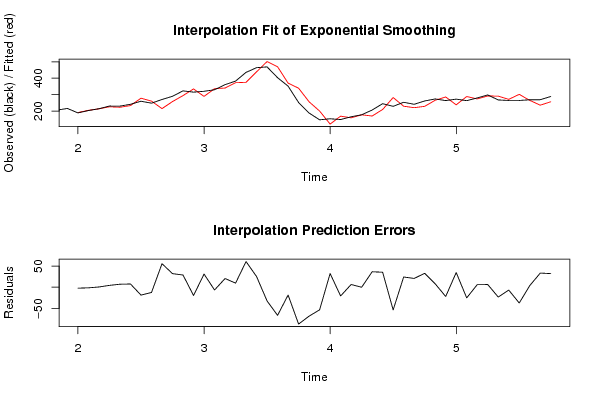
tObservedFittedResiduals
13188.5190.796474358974-2.29647435897439
14202.9204.36351981352-1.46351981351984
15214213.4676864801860.532313519813528
16230.3225.9676864801864.33231351981354
17230222.9593531468537.04064685314682
18241233.4010198135207.59898018648019
19259.6278.26351981352-18.6635198135199
20247.8260.246853146853-12.4468531468532
21270.3214.81351981352055.4864801864803
22289.7257.68435314685332.0156468531468
23322.7293.94268648018728.7573135198135
24315334.617686480186-19.6176864801865
25320.2289.13435314685331.0656468531469
26329.5336.06351981352-6.56351981351986
27360.6340.06768648018620.5323135198136
28382.2372.5676864801869.63231351981352
29435.4374.85935314685360.5406468531468
30464438.8010198135225.1989801864802
31468.8501.26351981352-32.4635198135198
32403469.446853146853-66.4468531468532
33351.6370.01351981352-18.4135198135197
34252338.984353146853-86.9843531468532
35188256.242686480187-68.2426864801865
36146.5199.917686480186-53.4176864801865
37152.9120.63435314685332.2656468531468
38148.1168.76351981352-20.6635198135199
39165.1158.6676864801866.43231351981353
40177177.067686480186-0.0676864801864667
41206.1169.65935314685336.4406468531468
42244.9209.50101981352035.3989801864802
43228.6282.16351981352-53.5635198135199
44253.4229.24685314685324.1531468531469
45241.1220.41351981352020.6864801864803
46261.4228.48435314685332.9156468531468
47273.7265.6426864801878.05731351981348
48263.7285.617686480186-21.9176864801865
49272.5237.83435314685334.6656468531469
50263.2288.36351981352-25.1635198135199
51279.8273.7676864801866.03231351981356
52298.1291.7676864801866.33231351981357
53267.6290.759353146853-23.1593531468532
54264.3271.00101981352-6.70101981351985
55264.3301.56351981352-37.2635198135198
56268.7264.9468531468533.7531468531468
57269.1235.71351981352033.3864801864803
58288.6256.48435314685332.1156468531469

\begin{tabular}{lllllllll}
\hline
Interpolation Forecasts of Exponential Smoothing \tabularnewline
t & Observed & Fitted & Residuals \tabularnewline
13 & 188.5 & 190.796474358974 & -2.29647435897439 \tabularnewline
14 & 202.9 & 204.36351981352 & -1.46351981351984 \tabularnewline
15 & 214 & 213.467686480186 & 0.532313519813528 \tabularnewline
16 & 230.3 & 225.967686480186 & 4.33231351981354 \tabularnewline
17 & 230 & 222.959353146853 & 7.04064685314682 \tabularnewline
18 & 241 & 233.401019813520 & 7.59898018648019 \tabularnewline
19 & 259.6 & 278.26351981352 & -18.6635198135199 \tabularnewline
20 & 247.8 & 260.246853146853 & -12.4468531468532 \tabularnewline
21 & 270.3 & 214.813519813520 & 55.4864801864803 \tabularnewline
22 & 289.7 & 257.684353146853 & 32.0156468531468 \tabularnewline
23 & 322.7 & 293.942686480187 & 28.7573135198135 \tabularnewline
24 & 315 & 334.617686480186 & -19.6176864801865 \tabularnewline
25 & 320.2 & 289.134353146853 & 31.0656468531469 \tabularnewline
26 & 329.5 & 336.06351981352 & -6.56351981351986 \tabularnewline
27 & 360.6 & 340.067686480186 & 20.5323135198136 \tabularnewline
28 & 382.2 & 372.567686480186 & 9.63231351981352 \tabularnewline
29 & 435.4 & 374.859353146853 & 60.5406468531468 \tabularnewline
30 & 464 & 438.80101981352 & 25.1989801864802 \tabularnewline
31 & 468.8 & 501.26351981352 & -32.4635198135198 \tabularnewline
32 & 403 & 469.446853146853 & -66.4468531468532 \tabularnewline
33 & 351.6 & 370.01351981352 & -18.4135198135197 \tabularnewline
34 & 252 & 338.984353146853 & -86.9843531468532 \tabularnewline
35 & 188 & 256.242686480187 & -68.2426864801865 \tabularnewline
36 & 146.5 & 199.917686480186 & -53.4176864801865 \tabularnewline
37 & 152.9 & 120.634353146853 & 32.2656468531468 \tabularnewline
38 & 148.1 & 168.76351981352 & -20.6635198135199 \tabularnewline
39 & 165.1 & 158.667686480186 & 6.43231351981353 \tabularnewline
40 & 177 & 177.067686480186 & -0.0676864801864667 \tabularnewline
41 & 206.1 & 169.659353146853 & 36.4406468531468 \tabularnewline
42 & 244.9 & 209.501019813520 & 35.3989801864802 \tabularnewline
43 & 228.6 & 282.16351981352 & -53.5635198135199 \tabularnewline
44 & 253.4 & 229.246853146853 & 24.1531468531469 \tabularnewline
45 & 241.1 & 220.413519813520 & 20.6864801864803 \tabularnewline
46 & 261.4 & 228.484353146853 & 32.9156468531468 \tabularnewline
47 & 273.7 & 265.642686480187 & 8.05731351981348 \tabularnewline
48 & 263.7 & 285.617686480186 & -21.9176864801865 \tabularnewline
49 & 272.5 & 237.834353146853 & 34.6656468531469 \tabularnewline
50 & 263.2 & 288.36351981352 & -25.1635198135199 \tabularnewline
51 & 279.8 & 273.767686480186 & 6.03231351981356 \tabularnewline
52 & 298.1 & 291.767686480186 & 6.33231351981357 \tabularnewline
53 & 267.6 & 290.759353146853 & -23.1593531468532 \tabularnewline
54 & 264.3 & 271.00101981352 & -6.70101981351985 \tabularnewline
55 & 264.3 & 301.56351981352 & -37.2635198135198 \tabularnewline
56 & 268.7 & 264.946853146853 & 3.7531468531468 \tabularnewline
57 & 269.1 & 235.713519813520 & 33.3864801864803 \tabularnewline
58 & 288.6 & 256.484353146853 & 32.1156468531469 \tabularnewline
\hline
\end{tabular}
%Source: https://freestatistics.org/blog/index.php?pk=103802&T=2

[TABLE]
[ROW][C]Interpolation Forecasts of Exponential Smoothing[/C][/ROW]
[ROW][C]t[/C][C]Observed[/C][C]Fitted[/C][C]Residuals[/C][/ROW]
[ROW][C]13[/C][C]188.5[/C][C]190.796474358974[/C][C]-2.29647435897439[/C][/ROW]
[ROW][C]14[/C][C]202.9[/C][C]204.36351981352[/C][C]-1.46351981351984[/C][/ROW]
[ROW][C]15[/C][C]214[/C][C]213.467686480186[/C][C]0.532313519813528[/C][/ROW]
[ROW][C]16[/C][C]230.3[/C][C]225.967686480186[/C][C]4.33231351981354[/C][/ROW]
[ROW][C]17[/C][C]230[/C][C]222.959353146853[/C][C]7.04064685314682[/C][/ROW]
[ROW][C]18[/C][C]241[/C][C]233.401019813520[/C][C]7.59898018648019[/C][/ROW]
[ROW][C]19[/C][C]259.6[/C][C]278.26351981352[/C][C]-18.6635198135199[/C][/ROW]
[ROW][C]20[/C][C]247.8[/C][C]260.246853146853[/C][C]-12.4468531468532[/C][/ROW]
[ROW][C]21[/C][C]270.3[/C][C]214.813519813520[/C][C]55.4864801864803[/C][/ROW]
[ROW][C]22[/C][C]289.7[/C][C]257.684353146853[/C][C]32.0156468531468[/C][/ROW]
[ROW][C]23[/C][C]322.7[/C][C]293.942686480187[/C][C]28.7573135198135[/C][/ROW]
[ROW][C]24[/C][C]315[/C][C]334.617686480186[/C][C]-19.6176864801865[/C][/ROW]
[ROW][C]25[/C][C]320.2[/C][C]289.134353146853[/C][C]31.0656468531469[/C][/ROW]
[ROW][C]26[/C][C]329.5[/C][C]336.06351981352[/C][C]-6.56351981351986[/C][/ROW]
[ROW][C]27[/C][C]360.6[/C][C]340.067686480186[/C][C]20.5323135198136[/C][/ROW]
[ROW][C]28[/C][C]382.2[/C][C]372.567686480186[/C][C]9.63231351981352[/C][/ROW]
[ROW][C]29[/C][C]435.4[/C][C]374.859353146853[/C][C]60.5406468531468[/C][/ROW]
[ROW][C]30[/C][C]464[/C][C]438.80101981352[/C][C]25.1989801864802[/C][/ROW]
[ROW][C]31[/C][C]468.8[/C][C]501.26351981352[/C][C]-32.4635198135198[/C][/ROW]
[ROW][C]32[/C][C]403[/C][C]469.446853146853[/C][C]-66.4468531468532[/C][/ROW]
[ROW][C]33[/C][C]351.6[/C][C]370.01351981352[/C][C]-18.4135198135197[/C][/ROW]
[ROW][C]34[/C][C]252[/C][C]338.984353146853[/C][C]-86.9843531468532[/C][/ROW]
[ROW][C]35[/C][C]188[/C][C]256.242686480187[/C][C]-68.2426864801865[/C][/ROW]
[ROW][C]36[/C][C]146.5[/C][C]199.917686480186[/C][C]-53.4176864801865[/C][/ROW]
[ROW][C]37[/C][C]152.9[/C][C]120.634353146853[/C][C]32.2656468531468[/C][/ROW]
[ROW][C]38[/C][C]148.1[/C][C]168.76351981352[/C][C]-20.6635198135199[/C][/ROW]
[ROW][C]39[/C][C]165.1[/C][C]158.667686480186[/C][C]6.43231351981353[/C][/ROW]
[ROW][C]40[/C][C]177[/C][C]177.067686480186[/C][C]-0.0676864801864667[/C][/ROW]
[ROW][C]41[/C][C]206.1[/C][C]169.659353146853[/C][C]36.4406468531468[/C][/ROW]
[ROW][C]42[/C][C]244.9[/C][C]209.501019813520[/C][C]35.3989801864802[/C][/ROW]
[ROW][C]43[/C][C]228.6[/C][C]282.16351981352[/C][C]-53.5635198135199[/C][/ROW]
[ROW][C]44[/C][C]253.4[/C][C]229.246853146853[/C][C]24.1531468531469[/C][/ROW]
[ROW][C]45[/C][C]241.1[/C][C]220.413519813520[/C][C]20.6864801864803[/C][/ROW]
[ROW][C]46[/C][C]261.4[/C][C]228.484353146853[/C][C]32.9156468531468[/C][/ROW]
[ROW][C]47[/C][C]273.7[/C][C]265.642686480187[/C][C]8.05731351981348[/C][/ROW]
[ROW][C]48[/C][C]263.7[/C][C]285.617686480186[/C][C]-21.9176864801865[/C][/ROW]
[ROW][C]49[/C][C]272.5[/C][C]237.834353146853[/C][C]34.6656468531469[/C][/ROW]
[ROW][C]50[/C][C]263.2[/C][C]288.36351981352[/C][C]-25.1635198135199[/C][/ROW]
[ROW][C]51[/C][C]279.8[/C][C]273.767686480186[/C][C]6.03231351981356[/C][/ROW]
[ROW][C]52[/C][C]298.1[/C][C]291.767686480186[/C][C]6.33231351981357[/C][/ROW]
[ROW][C]53[/C][C]267.6[/C][C]290.759353146853[/C][C]-23.1593531468532[/C][/ROW]
[ROW][C]54[/C][C]264.3[/C][C]271.00101981352[/C][C]-6.70101981351985[/C][/ROW]
[ROW][C]55[/C][C]264.3[/C][C]301.56351981352[/C][C]-37.2635198135198[/C][/ROW]
[ROW][C]56[/C][C]268.7[/C][C]264.946853146853[/C][C]3.7531468531468[/C][/ROW]
[ROW][C]57[/C][C]269.1[/C][C]235.713519813520[/C][C]33.3864801864803[/C][/ROW]
[ROW][C]58[/C][C]288.6[/C][C]256.484353146853[/C][C]32.1156468531469[/C][/ROW]
[/TABLE]
Source: https://freestatistics.org/blog/index.php?pk=103802&T=2

Globally Unique Identifier (entire table): ba.freestatistics.org/blog/index.php?pk=103802&T=2

As an alternative you can also use a QR Code:  

The GUIDs for individual cells are displayed in the table below:

Interpolation Forecasts of Exponential Smoothing
tObservedFittedResiduals
13188.5190.796474358974-2.29647435897439
14202.9204.36351981352-1.46351981351984
15214213.4676864801860.532313519813528
16230.3225.9676864801864.33231351981354
17230222.9593531468537.04064685314682
18241233.4010198135207.59898018648019
19259.6278.26351981352-18.6635198135199
20247.8260.246853146853-12.4468531468532
21270.3214.81351981352055.4864801864803
22289.7257.68435314685332.0156468531468
23322.7293.94268648018728.7573135198135
24315334.617686480186-19.6176864801865
25320.2289.13435314685331.0656468531469
26329.5336.06351981352-6.56351981351986
27360.6340.06768648018620.5323135198136
28382.2372.5676864801869.63231351981352
29435.4374.85935314685360.5406468531468
30464438.8010198135225.1989801864802
31468.8501.26351981352-32.4635198135198
32403469.446853146853-66.4468531468532
33351.6370.01351981352-18.4135198135197
34252338.984353146853-86.9843531468532
35188256.242686480187-68.2426864801865
36146.5199.917686480186-53.4176864801865
37152.9120.63435314685332.2656468531468
38148.1168.76351981352-20.6635198135199
39165.1158.6676864801866.43231351981353
40177177.067686480186-0.0676864801864667
41206.1169.65935314685336.4406468531468
42244.9209.50101981352035.3989801864802
43228.6282.16351981352-53.5635198135199
44253.4229.24685314685324.1531468531469
45241.1220.41351981352020.6864801864803
46261.4228.48435314685332.9156468531468
47273.7265.6426864801878.05731351981348
48263.7285.617686480186-21.9176864801865
49272.5237.83435314685334.6656468531469
50263.2288.36351981352-25.1635198135199
51279.8273.7676864801866.03231351981356
52298.1291.7676864801866.33231351981357
53267.6290.759353146853-23.1593531468532
54264.3271.00101981352-6.70101981351985
55264.3301.56351981352-37.2635198135198
56268.7264.9468531468533.7531468531468
57269.1235.71351981352033.3864801864803
58288.6256.48435314685332.1156468531469


Extrapolation Forecasts of Exponential Smoothing
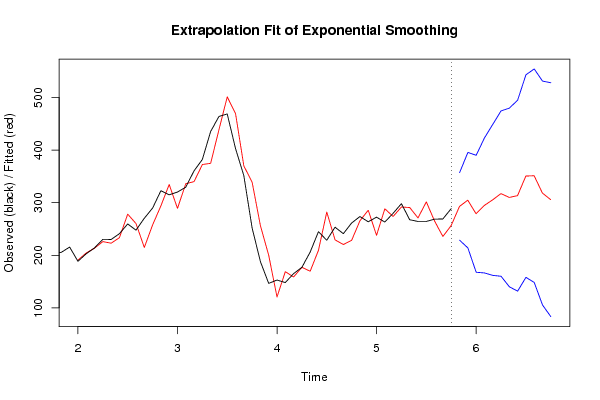
tForecast95% Lower Bound95% Upper Bound
59292.842686480187228.635746171010357.049626789363
60304.760372960373213.958047176656395.56269874409
61278.894726107226167.685043293191390.104408921261
62294.758245920746166.344365302394423.172126539098
63305.325932400932161.754849242343448.897015559522
64317.293618881119160.0193771783474.567860583938
65309.952972027972140.077375525523479.828568530421
66313.353991841492131.749340274059494.958643408925
67350.617511655012157.996690727483543.23833258254
68351.264364801865148.224191834392554.304537769337
69318.277884615385105.327554673102531.228214557668
70305.66223776223883.2428721341672528.081603390308

\begin{tabular}{lllllllll}
\hline
Extrapolation Forecasts of Exponential Smoothing \tabularnewline
t & Forecast & 95% Lower Bound & 95% Upper Bound \tabularnewline
59 & 292.842686480187 & 228.635746171010 & 357.049626789363 \tabularnewline
60 & 304.760372960373 & 213.958047176656 & 395.56269874409 \tabularnewline
61 & 278.894726107226 & 167.685043293191 & 390.104408921261 \tabularnewline
62 & 294.758245920746 & 166.344365302394 & 423.172126539098 \tabularnewline
63 & 305.325932400932 & 161.754849242343 & 448.897015559522 \tabularnewline
64 & 317.293618881119 & 160.0193771783 & 474.567860583938 \tabularnewline
65 & 309.952972027972 & 140.077375525523 & 479.828568530421 \tabularnewline
66 & 313.353991841492 & 131.749340274059 & 494.958643408925 \tabularnewline
67 & 350.617511655012 & 157.996690727483 & 543.23833258254 \tabularnewline
68 & 351.264364801865 & 148.224191834392 & 554.304537769337 \tabularnewline
69 & 318.277884615385 & 105.327554673102 & 531.228214557668 \tabularnewline
70 & 305.662237762238 & 83.2428721341672 & 528.081603390308 \tabularnewline
\hline
\end{tabular}
%Source: https://freestatistics.org/blog/index.php?pk=103802&T=3

[TABLE]
[ROW][C]Extrapolation Forecasts of Exponential Smoothing[/C][/ROW]
[ROW][C]t[/C][C]Forecast[/C][C]95% Lower Bound[/C][C]95% Upper Bound[/C][/ROW]
[ROW][C]59[/C][C]292.842686480187[/C][C]228.635746171010[/C][C]357.049626789363[/C][/ROW]
[ROW][C]60[/C][C]304.760372960373[/C][C]213.958047176656[/C][C]395.56269874409[/C][/ROW]
[ROW][C]61[/C][C]278.894726107226[/C][C]167.685043293191[/C][C]390.104408921261[/C][/ROW]
[ROW][C]62[/C][C]294.758245920746[/C][C]166.344365302394[/C][C]423.172126539098[/C][/ROW]
[ROW][C]63[/C][C]305.325932400932[/C][C]161.754849242343[/C][C]448.897015559522[/C][/ROW]
[ROW][C]64[/C][C]317.293618881119[/C][C]160.0193771783[/C][C]474.567860583938[/C][/ROW]
[ROW][C]65[/C][C]309.952972027972[/C][C]140.077375525523[/C][C]479.828568530421[/C][/ROW]
[ROW][C]66[/C][C]313.353991841492[/C][C]131.749340274059[/C][C]494.958643408925[/C][/ROW]
[ROW][C]67[/C][C]350.617511655012[/C][C]157.996690727483[/C][C]543.23833258254[/C][/ROW]
[ROW][C]68[/C][C]351.264364801865[/C][C]148.224191834392[/C][C]554.304537769337[/C][/ROW]
[ROW][C]69[/C][C]318.277884615385[/C][C]105.327554673102[/C][C]531.228214557668[/C][/ROW]
[ROW][C]70[/C][C]305.662237762238[/C][C]83.2428721341672[/C][C]528.081603390308[/C][/ROW]
[/TABLE]
Source: https://freestatistics.org/blog/index.php?pk=103802&T=3

Globally Unique Identifier (entire table): ba.freestatistics.org/blog/index.php?pk=103802&T=3

As an alternative you can also use a QR Code:  

The GUIDs for individual cells are displayed in the table below:

Extrapolation Forecasts of Exponential Smoothing
tForecast95% Lower Bound95% Upper Bound
59292.842686480187228.635746171010357.049626789363
60304.760372960373213.958047176656395.56269874409
61278.894726107226167.685043293191390.104408921261
62294.758245920746166.344365302394423.172126539098
63305.325932400932161.754849242343448.897015559522
64317.293618881119160.0193771783474.567860583938
65309.952972027972140.077375525523479.828568530421
66313.353991841492131.749340274059494.958643408925
67350.617511655012157.996690727483543.23833258254
68351.264364801865148.224191834392554.304537769337
69318.277884615385105.327554673102531.228214557668
70305.66223776223883.2428721341672528.081603390308


Parameters (Session):
par1 = 12 ; par2 = Triple ; par3 = additive ;
Parameters (R input):
par1 = 12 ; par2 = Triple ; par3 = additive ;
R code (references can be found in the software module):
par1 <- as.numeric(par1)
if (par2 == 'Single') K <- 1
if (par2 == 'Double') K <- 2
if (par2 == 'Triple') K <- par1
nx <- length(x)
nxmK <- nx - K
x <- ts(x, frequency = par1)
if (par2 == 'Single') fit <- HoltWinters(x, gamma=0, beta=0)
if (par2 == 'Double') fit <- HoltWinters(x, gamma=0)
if (par2 == 'Triple') fit <- HoltWinters(x, seasonal=par3)
fit
myresid <- x - fit$fitted[,'xhat']
bitmap(file='test1.png')
op <- par(mfrow=c(2,1))
plot(fit,ylab='Observed (black) / Fitted (red)',main='Interpolation Fit of Exponential Smoothing')
plot(myresid,ylab='Residuals',main='Interpolation Prediction Errors')
par(op)
dev.off()
bitmap(file='test2.png')
p <- predict(fit, par1, prediction.interval=TRUE)
np <- length(p[,1])
plot(fit,p,ylab='Observed (black) / Fitted (red)',main='Extrapolation Fit of Exponential Smoothing')
dev.off()
bitmap(file='test3.png')
op <- par(mfrow = c(2,2))
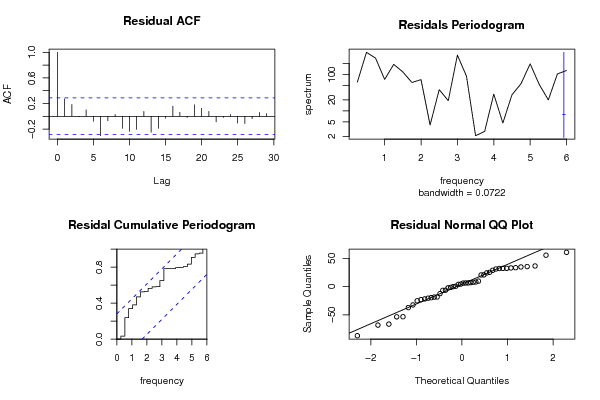
acf(as.numeric(myresid),lag.max = nx/2,main='Residual ACF')
spectrum(myresid,main='Residals Periodogram')
cpgram(myresid,main='Residal Cumulative Periodogram')
qqnorm(myresid,main='Residual Normal QQ Plot')
qqline(myresid)
par(op)
dev.off()
load(file='createtable')
a<-table.start()
a<-table.row.start(a)
a<-table.element(a,'Estimated Parameters of Exponential Smoothing',2,TRUE)
a<-table.row.end(a)
a<-table.row.start(a)
a<-table.element(a,'Parameter',header=TRUE)
a<-table.element(a,'Value',header=TRUE)
a<-table.row.end(a)
a<-table.row.start(a)
a<-table.element(a,'alpha',header=TRUE)
a<-table.element(a,fit$alpha)
a<-table.row.end(a)
a<-table.row.start(a)
a<-table.element(a,'beta',header=TRUE)
a<-table.element(a,fit$beta)
a<-table.row.end(a)
a<-table.row.start(a)
a<-table.element(a,'gamma',header=TRUE)
a<-table.element(a,fit$gamma)
a<-table.row.end(a)
a<-table.end(a)
table.save(a,file='mytable.tab')
a<-table.start()
a<-table.row.start(a)
a<-table.element(a,'Interpolation Forecasts of Exponential Smoothing',4,TRUE)
a<-table.row.end(a)
a<-table.row.start(a)
a<-table.element(a,'t',header=TRUE)
a<-table.element(a,'Observed',header=TRUE)
a<-table.element(a,'Fitted',header=TRUE)
a<-table.element(a,'Residuals',header=TRUE)
a<-table.row.end(a)
for (i in 1:nxmK) {
a<-table.row.start(a)
a<-table.element(a,i+K,header=TRUE)
a<-table.element(a,x[i+K])
a<-table.element(a,fit$fitted[i,'xhat'])
a<-table.element(a,myresid[i])
a<-table.row.end(a)
}
a<-table.end(a)
table.save(a,file='mytable1.tab')
a<-table.start()
a<-table.row.start(a)
a<-table.element(a,'Extrapolation Forecasts of Exponential Smoothing',4,TRUE)
a<-table.row.end(a)
a<-table.row.start(a)
a<-table.element(a,'t',header=TRUE)
a<-table.element(a,'Forecast',header=TRUE)
a<-table.element(a,'95% Lower Bound',header=TRUE)
a<-table.element(a,'95% Upper Bound',header=TRUE)
a<-table.row.end(a)
for (i in 1:np) {
a<-table.row.start(a)
a<-table.element(a,nx+i,header=TRUE)
a<-table.element(a,p[i,'fit'])
a<-table.element(a,p[i,'lwr'])
a<-table.element(a,p[i,'upr'])
a<-table.row.end(a)
}
a<-table.end(a)
table.save(a,file='mytable2.tab')