| Multiple Linear Regression - Estimated Regression Equation |
| Invoer[t] = + 1285771.56960543 + 0.919497215404327Uitvoer[t] + 10319.8527765871t + e[t] |
| Multiple Linear Regression - Ordinary Least Squares | |||||
| Variable | Parameter | S.D. | T-STAT H0: parameter = 0 | 2-tail p-value | 1-tail p-value |
| (Intercept) | 1285771.56960543 | 854689.596505 | 1.5044 | 0.138007 | 0.069003 |
| Uitvoer | 0.919497215404327 | 0.047135 | 19.5076 | 0 | 0 |
| t | 10319.8527765871 | 5369.232627 | 1.922 | 0.059605 | 0.029802 |
| Multiple Linear Regression - Regression Statistics | |
| Multiple R | 0.932786144104306 |
| R-squared | 0.87008999063298 |
| Adjusted R-squared | 0.865531744690277 |
| F-TEST (value) | 190.882633708248 |
| F-TEST (DF numerator) | 2 |
| F-TEST (DF denominator) | 57 |
| p-value | 0 |
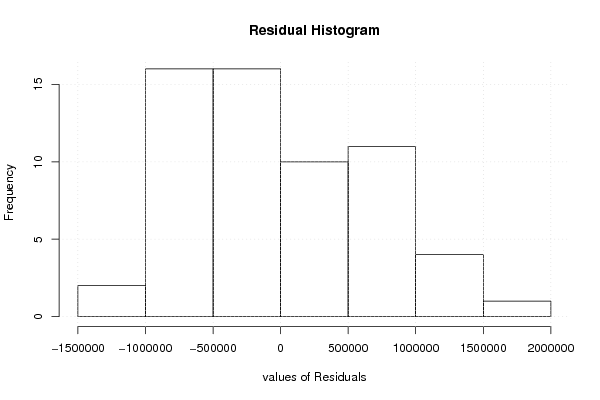
| Multiple Linear Regression - Residual Statistics | |
| Residual Standard Deviation | 711613.042257083 |
| Sum Squared Residuals | 28864407948891.7 |
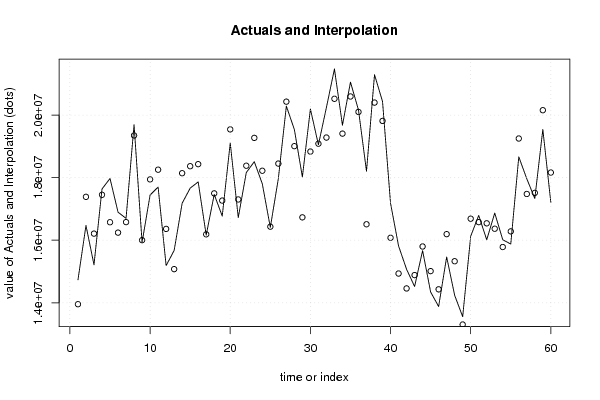
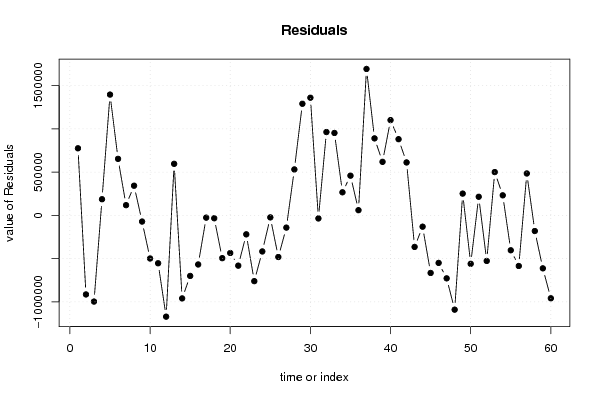
| Multiple Linear Regression - Actuals, Interpolation, and Residuals | |||
| Time or Index | Actuals | Interpolation Forecast | Residuals Prediction Error |
| 1 | 14731798.37 | 13955765.9926870 | 776032.377312977 |
| 2 | 16471559.62 | 17386147.0305214 | -914587.41052137 |
| 3 | 15213975.95 | 16210844.6092940 | -996868.65929395 |
| 4 | 17637387.4 | 17450587.6387733 | 186799.761226651 |
| 5 | 17972385.83 | 16575068.6740049 | 1397317.15599513 |
| 6 | 16896235.55 | 16242527.3889635 | 653708.161036486 |
| 7 | 16697955.94 | 16579586.2188172 | 118369.721182772 |
| 8 | 19691579.52 | 19348341.1135582 | 343238.406441784 |
| 9 | 15930700.75 | 16002115.4214819 | -71414.6714819439 |
| 10 | 17444615.98 | 17943397.1912938 | -498781.211293817 |
| 11 | 17699369.88 | 18253315.6540041 | -553945.774004134 |
| 12 | 15189796.81 | 16361308.9030466 | -1171512.09304655 |
| 13 | 15672722.75 | 15076255.5884276 | 596467.161572417 |
| 14 | 17180794.3 | 18141254.8316253 | -960460.531625309 |
| 15 | 17664893.45 | 18365342.8819335 | -700449.431933541 |
| 16 | 17862884.98 | 18430747.2290978 | -567862.249097826 |
| 17 | 16162288.88 | 16188358.8369623 | -26069.9569623104 |
| 18 | 17463628.82 | 17496947.8136144 | -33318.9936143708 |
| 19 | 16772112.17 | 17267033.4793636 | -494921.309363639 |
| 20 | 19106861.48 | 19541887.5617586 | -435026.081758638 |
| 21 | 16721314.25 | 17302787.5031498 | -581473.253149771 |
| 22 | 18161267.85 | 18380670.1413105 | -219402.291310472 |
| 23 | 18509941.2 | 19270749.1696036 | -760807.969603649 |
| 24 | 17802737.97 | 18219990.3566547 | -417252.38665468 |
| 25 | 16409869.75 | 16433102.8261052 | -23233.0761051595 |
| 26 | 17967742.04 | 18449316.3181646 | -481574.278164598 |
| 27 | 20286602.27 | 20428069.4660835 | -141467.196083544 |
| 28 | 19537280.81 | 19005835.8745649 | 531444.93543512 |
| 29 | 18021889.62 | 16730572.8364116 | 1291316.78358840 |
| 30 | 20194317.23 | 18833009.7523729 | 1361307.47762707 |
| 31 | 19049596.62 | 19084826.6480424 | -35230.028042414 |
| 32 | 20244720.94 | 19280632.0398166 | 964088.90018345 |
| 33 | 21473302.24 | 20519837.1174501 | 953465.122549919 |
| 34 | 19673603.19 | 19406623.5801833 | 266979.60981666 |
| 35 | 21053177.29 | 20593705.4409913 | 459471.849008733 |
| 36 | 20159479.84 | 20099563.8168337 | 59916.0231663276 |
| 37 | 18203628.31 | 16509624.1924681 | 1694004.11753189 |
| 38 | 21289464.94 | 20398699.1471136 | 890765.792886368 |
| 39 | 20432335.71 | 19812964.1709514 | 619371.53904862 |
| 40 | 17180395.07 | 16078197.0871948 | 1102197.98280524 |
| 41 | 15816786.32 | 14935380.3554680 | 881405.964531973 |
| 42 | 15071819.75 | 14459405.8262734 | 612413.923726607 |
| 43 | 14521120.61 | 14886000.7710369 | -364880.161036882 |
| 44 | 15668789.39 | 15799528.9276570 | -130739.537656962 |
| 45 | 14346884.11 | 15012767.9900596 | -665883.880059612 |
| 46 | 13881008.13 | 14430863.5565420 | -549855.426541984 |
| 47 | 15465943.69 | 16194358.8202956 | -728415.13029564 |
| 48 | 14238232.92 | 15328838.4774424 | -1090605.55744244 |
| 49 | 13557713.21 | 13305846.3413946 | 251866.868605382 |
| 50 | 16127590.29 | 16687857.3201623 | -560267.030162348 |
| 51 | 16793894.2 | 16578403.1714213 | 215491.028578742 |
| 52 | 16014007.43 | 16540909.1781918 | -526901.748191792 |
| 53 | 16867867.15 | 16367071.2735348 | 500795.876465208 |
| 54 | 16014583.21 | 15782576.4692418 | 232006.740758186 |
| 55 | 15878594.85 | 16282246.3403560 | -403651.490355965 |
| 56 | 18664899.14 | 19250335.8181842 | -585436.6781842 |
| 57 | 17962530.06 | 17477761.8893025 | 484768.170697477 |
| 58 | 17332692.2 | 17513456.5182544 | -180764.318254405 |
| 59 | 19542066.35 | 20154823.7446599 | -612757.394659859 |
| 60 | 17203555.19 | 18162749.4358258 | -959194.245825815 |
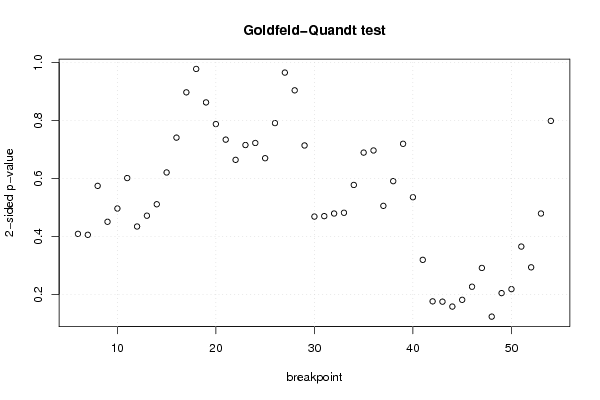
| Goldfeld-Quandt test for Heteroskedasticity | |||
| p-values | Alternative Hypothesis | ||
| breakpoint index | greater | 2-sided | less |
| 6 | 0.795690332014852 | 0.408619335970296 | 0.204309667985148 |
| 7 | 0.797300724296087 | 0.405398551407827 | 0.202699275703913 |
| 8 | 0.712942302455311 | 0.574115395089377 | 0.287057697544689 |
| 9 | 0.774853243317343 | 0.450293513365314 | 0.225146756682657 |
| 10 | 0.75197173661393 | 0.49605652677214 | 0.24802826338607 |
| 11 | 0.69946537172471 | 0.60106925655058 | 0.30053462827529 |
| 12 | 0.782991475769946 | 0.434017048460108 | 0.217008524230054 |
| 13 | 0.764367002339448 | 0.471265995321104 | 0.235632997660552 |
| 14 | 0.744629969532575 | 0.510740060934851 | 0.255370030467425 |
| 15 | 0.689816220493306 | 0.620367559013388 | 0.310183779506694 |
| 16 | 0.629823934622245 | 0.74035213075551 | 0.370176065377755 |
| 17 | 0.5517223681847 | 0.8965552636306 | 0.4482776318153 |
| 18 | 0.488600238266448 | 0.977200476532896 | 0.511399761733552 |
| 19 | 0.430918807917596 | 0.861837615835192 | 0.569081192082404 |
| 20 | 0.393598891581860 | 0.787197783163719 | 0.60640110841814 |
| 21 | 0.366728546760611 | 0.733457093521222 | 0.633271453239389 |
| 22 | 0.331926279903736 | 0.663852559807471 | 0.668073720096265 |
| 23 | 0.357472090915187 | 0.714944181830374 | 0.642527909084813 |
| 24 | 0.360992377495264 | 0.721984754990528 | 0.639007622504736 |
| 25 | 0.334710060665959 | 0.669420121331918 | 0.665289939334041 |
| 26 | 0.395269670193273 | 0.790539340386545 | 0.604730329806727 |
| 27 | 0.482334180916793 | 0.964668361833587 | 0.517665819083207 |
| 28 | 0.548251376600301 | 0.903497246799399 | 0.451748623399699 |
| 29 | 0.643283881364425 | 0.71343223727115 | 0.356716118635575 |
| 30 | 0.765894892599887 | 0.468210214800225 | 0.234105107400113 |
| 31 | 0.765129481263787 | 0.469741037472427 | 0.234870518736213 |
| 32 | 0.760616362122812 | 0.478767275754377 | 0.239383637877188 |
| 33 | 0.75930924280845 | 0.4813815143831 | 0.24069075719155 |
| 34 | 0.711380140773148 | 0.577239718453703 | 0.288619859226851 |
| 35 | 0.65559170521127 | 0.688816589577461 | 0.344408294788731 |
| 36 | 0.651905116103081 | 0.696189767793838 | 0.348094883896919 |
| 37 | 0.747403502112904 | 0.505192995774192 | 0.252596497887096 |
| 38 | 0.704825299797407 | 0.590349400405185 | 0.295174700202592 |
| 39 | 0.640420677742922 | 0.719158644514157 | 0.359579322257078 |
| 40 | 0.732487463982028 | 0.535025072035945 | 0.267512536017972 |
| 41 | 0.840459384440215 | 0.319081231119570 | 0.159540615559785 |
| 42 | 0.912025139206202 | 0.175949721587595 | 0.0879748607937976 |
| 43 | 0.912565386555537 | 0.174869226888927 | 0.0874346134444633 |
| 44 | 0.921032359047514 | 0.157935281904971 | 0.0789676409524857 |
| 45 | 0.90936449656753 | 0.181271006864940 | 0.0906355034324701 |
| 46 | 0.88682694754074 | 0.226346104918521 | 0.113173052459261 |
| 47 | 0.854412748165017 | 0.291174503669967 | 0.145587251834983 |
| 48 | 0.938386378884351 | 0.123227242231298 | 0.061613621115649 |
| 49 | 0.897828828486568 | 0.204342343026864 | 0.102171171513432 |
| 50 | 0.890969326597054 | 0.218061346805892 | 0.109030673402946 |
| 51 | 0.817583851016629 | 0.364832297966742 | 0.182416148983371 |
| 52 | 0.85334700860718 | 0.293305982785639 | 0.146652991392819 |
| 53 | 0.76059495363166 | 0.47881009273668 | 0.23940504636834 |
| 54 | 0.60097122550149 | 0.79805754899702 | 0.39902877449851 |
| Meta Analysis of Goldfeld-Quandt test for Heteroskedasticity | |||
| Description | # significant tests | % significant tests | OK/NOK |
| 1% type I error level | 0 | 0 | OK |
| 5% type I error level | 0 | 0 | OK |
| 10% type I error level | 0 | 0 | OK |