| Multiple Linear Regression - Estimated Regression Equation |
| suikerprijs[t] = + 0.959605263157894 + 0.00248245614035033M1[t] -0.00111403508771925M2[t] -0.000710526315789426M3[t] + 0.00369298245614038M4[t] + 0.00409649122807021M5[t] + 0.000500000000000024M6[t] + 0.00290350877192985M7[t] + 0.00838596491228074M8[t] + 0.00878947368421055M9[t] + 0.00669298245614037M10[t] -0.000403508771929817M11[t] -0.000403508771929818t + e[t] |
| Multiple Linear Regression - Ordinary Least Squares | |||||
| Variable | Parameter | S.D. | T-STAT H0: parameter = 0 | 2-tail p-value | 1-tail p-value |
| (Intercept) | 0.959605263157894 | 0.004791 | 200.3001 | 0 | 0 |
| M1 | 0.00248245614035033 | 0.005731 | 0.4332 | 0.66709 | 0.333545 |
| M2 | -0.00111403508771925 | 0.005726 | -0.1945 | 0.846688 | 0.423344 |
| M3 | -0.000710526315789426 | 0.005723 | -0.1241 | 0.901789 | 0.450895 |
| M4 | 0.00369298245614038 | 0.005721 | 0.6455 | 0.522094 | 0.261047 |
| M5 | 0.00409649122807021 | 0.005719 | 0.7162 | 0.477808 | 0.238904 |
| M6 | 0.000500000000000024 | 0.005719 | 0.0874 | 0.930747 | 0.465373 |
| M7 | 0.00290350877192985 | 0.005719 | 0.5077 | 0.614351 | 0.307175 |
| M8 | 0.00838596491228074 | 0.006035 | 1.3895 | 0.172013 | 0.086007 |
| M9 | 0.00878947368421055 | 0.006032 | 1.4571 | 0.152534 | 0.076267 |
| M10 | 0.00669298245614037 | 0.00603 | 1.1099 | 0.273344 | 0.136672 |
| M11 | -0.000403508771929817 | 0.006029 | -0.0669 | 0.946955 | 0.473477 |
| t | -0.000403508771929818 | 7.3e-05 | -5.5358 | 2e-06 | 1e-06 |
| Multiple Linear Regression - Regression Statistics | |
| Multiple R | 0.696861977056488 |
| R-squared | 0.485616615067078 |
| Adjusted R-squared | 0.338649933657671 |
| F-TEST (value) | 3.30426332288399 |
| F-TEST (DF numerator) | 12 |
| F-TEST (DF denominator) | 42 |
| p-value | 0.00198459704748566 |
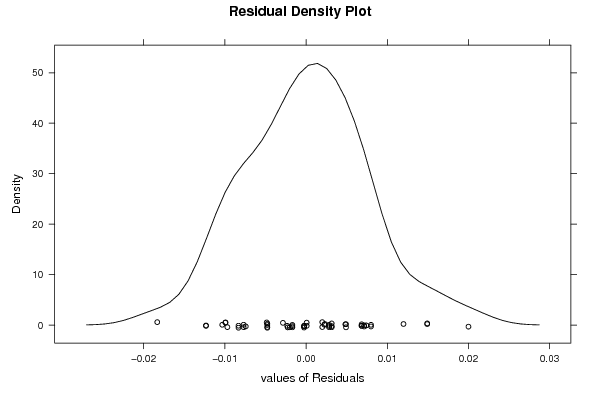
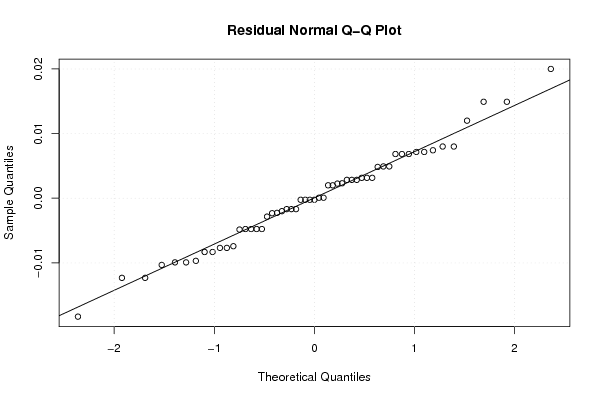
| Multiple Linear Regression - Residual Statistics | |
| Residual Standard Deviation | 0.00852535654742085 |
| Sum Squared Residuals | 0.00305263157894737 |
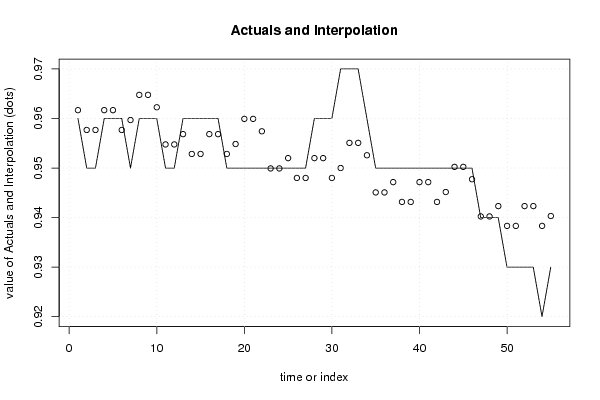
| Multiple Linear Regression - Actuals, Interpolation, and Residuals | |||
| Time or Index | Actuals | Interpolation Forecast | Residuals Prediction Error |
| 1 | 0.96 | 0.961684210526318 | -0.00168421052631794 |
| 2 | 0.95 | 0.957684210526316 | -0.00768421052631566 |
| 3 | 0.95 | 0.957684210526316 | -0.00768421052631567 |
| 4 | 0.96 | 0.961684210526316 | -0.00168421052631567 |
| 5 | 0.96 | 0.961684210526316 | -0.00168421052631566 |
| 6 | 0.96 | 0.957684210526316 | 0.00231578947368434 |
| 7 | 0.95 | 0.959684210526316 | -0.00968421052631567 |
| 8 | 0.96 | 0.964763157894737 | -0.00476315789473673 |
| 9 | 0.96 | 0.964763157894737 | -0.00476315789473674 |
| 10 | 0.96 | 0.962263157894737 | -0.00226315789473673 |
| 11 | 0.95 | 0.954763157894737 | -0.00476315789473674 |
| 12 | 0.95 | 0.954763157894737 | -0.00476315789473673 |
| 13 | 0.96 | 0.956842105263157 | 0.00315789473684274 |
| 14 | 0.96 | 0.952842105263158 | 0.00715789473684216 |
| 15 | 0.96 | 0.952842105263158 | 0.00715789473684216 |
| 16 | 0.96 | 0.956842105263158 | 0.00315789473684216 |
| 17 | 0.96 | 0.956842105263158 | 0.00315789473684216 |
| 18 | 0.95 | 0.952842105263158 | -0.00284210526315785 |
| 19 | 0.95 | 0.954842105263158 | -0.00484210526315785 |
| 20 | 0.95 | 0.959921052631579 | -0.00992105263157892 |
| 21 | 0.95 | 0.959921052631579 | -0.00992105263157892 |
| 22 | 0.95 | 0.957421052631579 | -0.00742105263157892 |
| 23 | 0.95 | 0.949921052631579 | 7.89473684210919e-05 |
| 24 | 0.95 | 0.949921052631579 | 7.89473684210923e-05 |
| 25 | 0.95 | 0.952 | -0.00199999999999942 |
| 26 | 0.95 | 0.948 | 0.00199999999999998 |
| 27 | 0.95 | 0.948 | 0.00199999999999998 |
| 28 | 0.96 | 0.952 | 0.00799999999999998 |
| 29 | 0.96 | 0.952 | 0.00799999999999998 |
| 30 | 0.96 | 0.948 | 0.0120000000000000 |
| 31 | 0.97 | 0.95 | 0.02 |
| 32 | 0.97 | 0.955078947368421 | 0.0149210526315789 |
| 33 | 0.97 | 0.955078947368421 | 0.0149210526315789 |
| 34 | 0.96 | 0.952578947368421 | 0.00742105263157891 |
| 35 | 0.95 | 0.945078947368421 | 0.00492105263157891 |
| 36 | 0.95 | 0.945078947368421 | 0.00492105263157892 |
| 37 | 0.95 | 0.947157894736842 | 0.0028421052631584 |
| 38 | 0.95 | 0.943157894736842 | 0.0068421052631578 |
| 39 | 0.95 | 0.943157894736842 | 0.0068421052631578 |
| 40 | 0.95 | 0.947157894736842 | 0.00284210526315780 |
| 41 | 0.95 | 0.947157894736842 | 0.0028421052631578 |
| 42 | 0.95 | 0.943157894736842 | 0.0068421052631578 |
| 43 | 0.95 | 0.945157894736842 | 0.0048421052631578 |
| 44 | 0.95 | 0.950236842105263 | -0.000236842105263269 |
| 45 | 0.95 | 0.950236842105263 | -0.000236842105263266 |
| 46 | 0.95 | 0.947736842105263 | 0.00226315789473673 |
| 47 | 0.94 | 0.940236842105263 | -0.000236842105263269 |
| 48 | 0.94 | 0.940236842105263 | -0.000236842105263267 |
| 49 | 0.94 | 0.942315789473684 | -0.00231578947368378 |
| 50 | 0.93 | 0.938315789473684 | -0.00831578947368428 |
| 51 | 0.93 | 0.938315789473684 | -0.00831578947368427 |
| 52 | 0.93 | 0.942315789473684 | -0.0123157894736843 |
| 53 | 0.93 | 0.942315789473684 | -0.0123157894736843 |
| 54 | 0.92 | 0.938315789473684 | -0.0183157894736843 |
| 55 | 0.93 | 0.940315789473684 | -0.0103157894736843 |
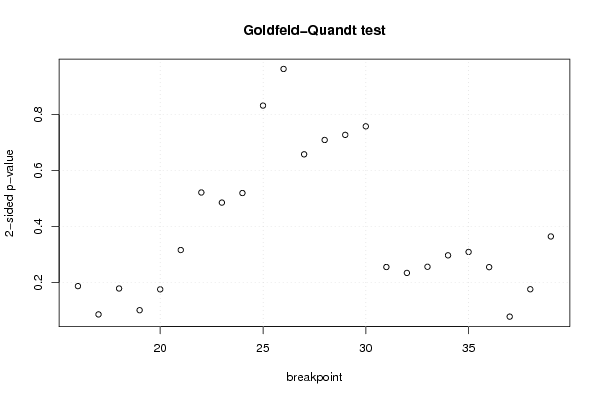
| Goldfeld-Quandt test for Heteroskedasticity | |||
| p-values | Alternative Hypothesis | ||
| breakpoint index | greater | 2-sided | less |
| 16 | 0.0937230185123164 | 0.187446037024633 | 0.906276981487684 |
| 17 | 0.0431269303608617 | 0.0862538607217234 | 0.956873069639138 |
| 18 | 0.0894455017044053 | 0.178891003408811 | 0.910554498295595 |
| 19 | 0.0506561951953621 | 0.101312390390724 | 0.949343804804638 |
| 20 | 0.0879282070011502 | 0.175856414002300 | 0.91207179299885 |
| 21 | 0.158128741589582 | 0.316257483179163 | 0.841871258410418 |
| 22 | 0.260897722450413 | 0.521795444900827 | 0.739102277549587 |
| 23 | 0.242814470291286 | 0.485628940582572 | 0.757185529708714 |
| 24 | 0.259909094336989 | 0.519818188673978 | 0.740090905663011 |
| 25 | 0.416111433547898 | 0.832222867095796 | 0.583888566452102 |
| 26 | 0.481526214610314 | 0.963052429220629 | 0.518473785389685 |
| 27 | 0.670945179396424 | 0.658109641207153 | 0.329054820603576 |
| 28 | 0.645316130170983 | 0.709367739658033 | 0.354683869829017 |
| 29 | 0.636188729673203 | 0.727622540653594 | 0.363811270326797 |
| 30 | 0.620952992777528 | 0.758094014444943 | 0.379047007222472 |
| 31 | 0.872218462009846 | 0.255563075980307 | 0.127781537990154 |
| 32 | 0.882774652936025 | 0.234450694127950 | 0.117225347063975 |
| 33 | 0.871783269682515 | 0.256433460634969 | 0.128216730317485 |
| 34 | 0.851332727402 | 0.297334545196001 | 0.148667272598001 |
| 35 | 0.845302240692474 | 0.309395518615051 | 0.154697759307526 |
| 36 | 0.872448651043774 | 0.255102697912451 | 0.127551348956226 |
| 37 | 0.960868217095329 | 0.0782635658093429 | 0.0391317829046714 |
| 38 | 0.911937011965794 | 0.176125976068413 | 0.0880629880342064 |
| 39 | 0.817642244893452 | 0.364715510213096 | 0.182357755106548 |
| Meta Analysis of Goldfeld-Quandt test for Heteroskedasticity | |||
| Description | # significant tests | % significant tests | OK/NOK |
| 1% type I error level | 0 | 0 | OK |
| 5% type I error level | 0 | 0 | OK |
| 10% type I error level | 2 | 0.0833333333333333 | OK |