Free Statistics

of Irreproducible Research!

Author's title

Author*The author of this computation has been verified*
R Software Modulerwasp_exponentialsmoothing.wasp
Title produced by softwareExponential Smoothing
Date of computationTue, 30 Nov 2010 15:01:36 +0000
Cite this page as followsStatistical Computations at FreeStatistics.org, Office for Research Development and Education, URL https://freestatistics.org/blog/index.php?v=date/2010/Nov/30/t1291129271sp4tzkyyj4bjx54.htm/, Retrieved Mon, 29 Apr 2024 12:38:50 +0000
Statistical Computations at FreeStatistics.org, Office for Research Development and Education, URL https://freestatistics.org/blog/index.php?pk=103581, Retrieved Mon, 29 Apr 2024 12:38:50 +0000
QR Codes:

Original text written by user:
IsPrivate?No (this computation is public)
User-defined keywords
Estimated Impact152
Family? (F = Feedback message, R = changed R code, M = changed R Module, P = changed Parameters, D = changed Data)
-     [Exponential Smoothing] [HPC Retail Sales] [2008-03-10 17:43:04] [74be16979710d4c4e7c6647856088456]
-  M D  [Exponential Smoothing] [single exponentia...] [2010-11-28 15:28:50] [26379b86c25fbf0febe6a7a428e65173]
-   PD      [Exponential Smoothing] [single exponentia...] [2010-11-30 15:01:36] [9be3691a9b6ce074cb51fd18377fce28] [Current]
Feedback Forum

Post a new message
Dataseries X:
149
134
123
116
117
111
105
102
95
93
124
130
124
115
106
105
105
101
95
93
84
87
116
120
117
109
105
107
109
109
108
107
99
103
131
137
135
124
118
121
121
118
113
107
100
102
130
136
133
120


Summary of computational transaction
Raw Inputview raw input (R code)
Raw Outputview raw output of R engine
Computing time3 seconds
R Server'Gwilym Jenkins' @ 72.249.127.135

\begin{tabular}{lllllllll}
\hline
Summary of computational transaction \tabularnewline
Raw Input & view raw input (R code)  \tabularnewline
Raw Output & view raw output of R engine  \tabularnewline
Computing time & 3 seconds \tabularnewline
R Server & 'Gwilym Jenkins' @ 72.249.127.135 \tabularnewline
\hline
\end{tabular}
%Source: https://freestatistics.org/blog/index.php?pk=103581&T=0

[TABLE]
[ROW][C]Summary of computational transaction[/C][/ROW]
[ROW][C]Raw Input[/C][C]view raw input (R code) [/C][/ROW]
[ROW][C]Raw Output[/C][C]view raw output of R engine [/C][/ROW]
[ROW][C]Computing time[/C][C]3 seconds[/C][/ROW]
[ROW][C]R Server[/C][C]'Gwilym Jenkins' @ 72.249.127.135[/C][/ROW]
[/TABLE]
Source: https://freestatistics.org/blog/index.php?pk=103581&T=0

Globally Unique Identifier (entire table): ba.freestatistics.org/blog/index.php?pk=103581&T=0

As an alternative you can also use a QR Code:  

The GUIDs for individual cells are displayed in the table below:

Summary of computational transaction
Raw Inputview raw input (R code)
Raw Outputview raw output of R engine
Computing time3 seconds
R Server'Gwilym Jenkins' @ 72.249.127.135


Estimated Parameters of Exponential Smoothing
ParameterValue
alpha0.622649335200591
beta0.363515429297754
gamma1

\begin{tabular}{lllllllll}
\hline
Estimated Parameters of Exponential Smoothing \tabularnewline
Parameter & Value \tabularnewline
alpha & 0.622649335200591 \tabularnewline
beta & 0.363515429297754 \tabularnewline
gamma & 1 \tabularnewline
\hline
\end{tabular}
%Source: https://freestatistics.org/blog/index.php?pk=103581&T=1

[TABLE]
[ROW][C]Estimated Parameters of Exponential Smoothing[/C][/ROW]
[ROW][C]Parameter[/C][C]Value[/C][/ROW]
[ROW][C]alpha[/C][C]0.622649335200591[/C][/ROW]
[ROW][C]beta[/C][C]0.363515429297754[/C][/ROW]
[ROW][C]gamma[/C][C]1[/C][/ROW]
[/TABLE]
Source: https://freestatistics.org/blog/index.php?pk=103581&T=1

Globally Unique Identifier (entire table): ba.freestatistics.org/blog/index.php?pk=103581&T=1

As an alternative you can also use a QR Code:  

The GUIDs for individual cells are displayed in the table below:

Estimated Parameters of Exponential Smoothing
ParameterValue
alpha0.622649335200591
beta0.363515429297754
gamma1


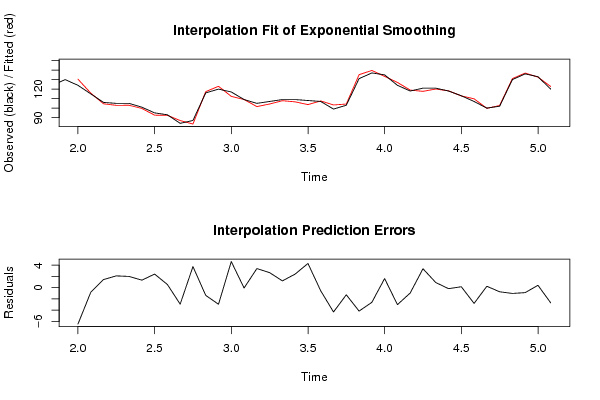
Interpolation Forecasts of Exponential Smoothing
tObservedFittedResiduals
13124130.470085470085-6.47008547008548
14115115.832221304801-0.83222130480091
15106104.5580690131331.44193098686662
16105102.9012866008412.09871339915868
17105103.0034776531161.99652234688365
1810199.66060432088171.33939567911834
199592.58673386035542.41326613964456
209392.43606649150550.563933508494543
218486.9282222552874-2.92822225528737
228783.24987466409733.75012533590265
23116117.370275697779-1.37027569777884
24120122.950643945718-2.95064394571752
25117112.3543160264094.64568397359085
26109109.066629190610-0.0666291906098024
27105101.6021104238983.39788957610195
28107104.3285436632602.67145633673979
29109107.7959290685841.20407093141627
30109106.5794418638712.42055813612944
31108103.6964680453214.30353195467852
32107107.565260112051-0.565260112051277
3399103.321305834355-4.3213058343546
34103104.265069281223-1.26506928122338
35131135.164858294000-4.16485829400025
36137139.610577641091-2.61057764109131
37135133.3711917798041.62880822019585
38124127.022727741909-3.02272774190858
39118118.951716471318-0.951716471317653
40121117.6380308476923.36196915230843
41121120.0802177508860.91978224911449
42118118.179987002091-0.179987002091053
43113112.8339390108080.166060989191777
44107109.798421611970-2.79842161196989
4510099.75031079397670.249689206023334
46102102.731751579039-0.731751579038601
47130131.028363149648-1.02836314964833
48136136.882440500291-0.882440500291096
49133132.5788768267580.421123173242137
50120122.709901360124-2.70990136012379

\begin{tabular}{lllllllll}
\hline
Interpolation Forecasts of Exponential Smoothing \tabularnewline
t & Observed & Fitted & Residuals \tabularnewline
13 & 124 & 130.470085470085 & -6.47008547008548 \tabularnewline
14 & 115 & 115.832221304801 & -0.83222130480091 \tabularnewline
15 & 106 & 104.558069013133 & 1.44193098686662 \tabularnewline
16 & 105 & 102.901286600841 & 2.09871339915868 \tabularnewline
17 & 105 & 103.003477653116 & 1.99652234688365 \tabularnewline
18 & 101 & 99.6606043208817 & 1.33939567911834 \tabularnewline
19 & 95 & 92.5867338603554 & 2.41326613964456 \tabularnewline
20 & 93 & 92.4360664915055 & 0.563933508494543 \tabularnewline
21 & 84 & 86.9282222552874 & -2.92822225528737 \tabularnewline
22 & 87 & 83.2498746640973 & 3.75012533590265 \tabularnewline
23 & 116 & 117.370275697779 & -1.37027569777884 \tabularnewline
24 & 120 & 122.950643945718 & -2.95064394571752 \tabularnewline
25 & 117 & 112.354316026409 & 4.64568397359085 \tabularnewline
26 & 109 & 109.066629190610 & -0.0666291906098024 \tabularnewline
27 & 105 & 101.602110423898 & 3.39788957610195 \tabularnewline
28 & 107 & 104.328543663260 & 2.67145633673979 \tabularnewline
29 & 109 & 107.795929068584 & 1.20407093141627 \tabularnewline
30 & 109 & 106.579441863871 & 2.42055813612944 \tabularnewline
31 & 108 & 103.696468045321 & 4.30353195467852 \tabularnewline
32 & 107 & 107.565260112051 & -0.565260112051277 \tabularnewline
33 & 99 & 103.321305834355 & -4.3213058343546 \tabularnewline
34 & 103 & 104.265069281223 & -1.26506928122338 \tabularnewline
35 & 131 & 135.164858294000 & -4.16485829400025 \tabularnewline
36 & 137 & 139.610577641091 & -2.61057764109131 \tabularnewline
37 & 135 & 133.371191779804 & 1.62880822019585 \tabularnewline
38 & 124 & 127.022727741909 & -3.02272774190858 \tabularnewline
39 & 118 & 118.951716471318 & -0.951716471317653 \tabularnewline
40 & 121 & 117.638030847692 & 3.36196915230843 \tabularnewline
41 & 121 & 120.080217750886 & 0.91978224911449 \tabularnewline
42 & 118 & 118.179987002091 & -0.179987002091053 \tabularnewline
43 & 113 & 112.833939010808 & 0.166060989191777 \tabularnewline
44 & 107 & 109.798421611970 & -2.79842161196989 \tabularnewline
45 & 100 & 99.7503107939767 & 0.249689206023334 \tabularnewline
46 & 102 & 102.731751579039 & -0.731751579038601 \tabularnewline
47 & 130 & 131.028363149648 & -1.02836314964833 \tabularnewline
48 & 136 & 136.882440500291 & -0.882440500291096 \tabularnewline
49 & 133 & 132.578876826758 & 0.421123173242137 \tabularnewline
50 & 120 & 122.709901360124 & -2.70990136012379 \tabularnewline
\hline
\end{tabular}
%Source: https://freestatistics.org/blog/index.php?pk=103581&T=2

[TABLE]
[ROW][C]Interpolation Forecasts of Exponential Smoothing[/C][/ROW]
[ROW][C]t[/C][C]Observed[/C][C]Fitted[/C][C]Residuals[/C][/ROW]
[ROW][C]13[/C][C]124[/C][C]130.470085470085[/C][C]-6.47008547008548[/C][/ROW]
[ROW][C]14[/C][C]115[/C][C]115.832221304801[/C][C]-0.83222130480091[/C][/ROW]
[ROW][C]15[/C][C]106[/C][C]104.558069013133[/C][C]1.44193098686662[/C][/ROW]
[ROW][C]16[/C][C]105[/C][C]102.901286600841[/C][C]2.09871339915868[/C][/ROW]
[ROW][C]17[/C][C]105[/C][C]103.003477653116[/C][C]1.99652234688365[/C][/ROW]
[ROW][C]18[/C][C]101[/C][C]99.6606043208817[/C][C]1.33939567911834[/C][/ROW]
[ROW][C]19[/C][C]95[/C][C]92.5867338603554[/C][C]2.41326613964456[/C][/ROW]
[ROW][C]20[/C][C]93[/C][C]92.4360664915055[/C][C]0.563933508494543[/C][/ROW]
[ROW][C]21[/C][C]84[/C][C]86.9282222552874[/C][C]-2.92822225528737[/C][/ROW]
[ROW][C]22[/C][C]87[/C][C]83.2498746640973[/C][C]3.75012533590265[/C][/ROW]
[ROW][C]23[/C][C]116[/C][C]117.370275697779[/C][C]-1.37027569777884[/C][/ROW]
[ROW][C]24[/C][C]120[/C][C]122.950643945718[/C][C]-2.95064394571752[/C][/ROW]
[ROW][C]25[/C][C]117[/C][C]112.354316026409[/C][C]4.64568397359085[/C][/ROW]
[ROW][C]26[/C][C]109[/C][C]109.066629190610[/C][C]-0.0666291906098024[/C][/ROW]
[ROW][C]27[/C][C]105[/C][C]101.602110423898[/C][C]3.39788957610195[/C][/ROW]
[ROW][C]28[/C][C]107[/C][C]104.328543663260[/C][C]2.67145633673979[/C][/ROW]
[ROW][C]29[/C][C]109[/C][C]107.795929068584[/C][C]1.20407093141627[/C][/ROW]
[ROW][C]30[/C][C]109[/C][C]106.579441863871[/C][C]2.42055813612944[/C][/ROW]
[ROW][C]31[/C][C]108[/C][C]103.696468045321[/C][C]4.30353195467852[/C][/ROW]
[ROW][C]32[/C][C]107[/C][C]107.565260112051[/C][C]-0.565260112051277[/C][/ROW]
[ROW][C]33[/C][C]99[/C][C]103.321305834355[/C][C]-4.3213058343546[/C][/ROW]
[ROW][C]34[/C][C]103[/C][C]104.265069281223[/C][C]-1.26506928122338[/C][/ROW]
[ROW][C]35[/C][C]131[/C][C]135.164858294000[/C][C]-4.16485829400025[/C][/ROW]
[ROW][C]36[/C][C]137[/C][C]139.610577641091[/C][C]-2.61057764109131[/C][/ROW]
[ROW][C]37[/C][C]135[/C][C]133.371191779804[/C][C]1.62880822019585[/C][/ROW]
[ROW][C]38[/C][C]124[/C][C]127.022727741909[/C][C]-3.02272774190858[/C][/ROW]
[ROW][C]39[/C][C]118[/C][C]118.951716471318[/C][C]-0.951716471317653[/C][/ROW]
[ROW][C]40[/C][C]121[/C][C]117.638030847692[/C][C]3.36196915230843[/C][/ROW]
[ROW][C]41[/C][C]121[/C][C]120.080217750886[/C][C]0.91978224911449[/C][/ROW]
[ROW][C]42[/C][C]118[/C][C]118.179987002091[/C][C]-0.179987002091053[/C][/ROW]
[ROW][C]43[/C][C]113[/C][C]112.833939010808[/C][C]0.166060989191777[/C][/ROW]
[ROW][C]44[/C][C]107[/C][C]109.798421611970[/C][C]-2.79842161196989[/C][/ROW]
[ROW][C]45[/C][C]100[/C][C]99.7503107939767[/C][C]0.249689206023334[/C][/ROW]
[ROW][C]46[/C][C]102[/C][C]102.731751579039[/C][C]-0.731751579038601[/C][/ROW]
[ROW][C]47[/C][C]130[/C][C]131.028363149648[/C][C]-1.02836314964833[/C][/ROW]
[ROW][C]48[/C][C]136[/C][C]136.882440500291[/C][C]-0.882440500291096[/C][/ROW]
[ROW][C]49[/C][C]133[/C][C]132.578876826758[/C][C]0.421123173242137[/C][/ROW]
[ROW][C]50[/C][C]120[/C][C]122.709901360124[/C][C]-2.70990136012379[/C][/ROW]
[/TABLE]
Source: https://freestatistics.org/blog/index.php?pk=103581&T=2

Globally Unique Identifier (entire table): ba.freestatistics.org/blog/index.php?pk=103581&T=2

As an alternative you can also use a QR Code:  

The GUIDs for individual cells are displayed in the table below:

Interpolation Forecasts of Exponential Smoothing
tObservedFittedResiduals
13124130.470085470085-6.47008547008548
14115115.832221304801-0.83222130480091
15106104.5580690131331.44193098686662
16105102.9012866008412.09871339915868
17105103.0034776531161.99652234688365
1810199.66060432088171.33939567911834
199592.58673386035542.41326613964456
209392.43606649150550.563933508494543
218486.9282222552874-2.92822225528737
228783.24987466409733.75012533590265
23116117.370275697779-1.37027569777884
24120122.950643945718-2.95064394571752
25117112.3543160264094.64568397359085
26109109.066629190610-0.0666291906098024
27105101.6021104238983.39788957610195
28107104.3285436632602.67145633673979
29109107.7959290685841.20407093141627
30109106.5794418638712.42055813612944
31108103.6964680453214.30353195467852
32107107.565260112051-0.565260112051277
3399103.321305834355-4.3213058343546
34103104.265069281223-1.26506928122338
35131135.164858294000-4.16485829400025
36137139.610577641091-2.61057764109131
37135133.3711917798041.62880822019585
38124127.022727741909-3.02272774190858
39118118.951716471318-0.951716471317653
40121117.6380308476923.36196915230843
41121120.0802177508860.91978224911449
42118118.179987002091-0.179987002091053
43113112.8339390108080.166060989191777
44107109.798421611970-2.79842161196989
4510099.75031079397670.249689206023334
46102102.731751579039-0.731751579038601
47130131.028363149648-1.02836314964833
48136136.882440500291-0.882440500291096
49133132.5788768267580.421123173242137
50120122.709901360124-2.70990136012379


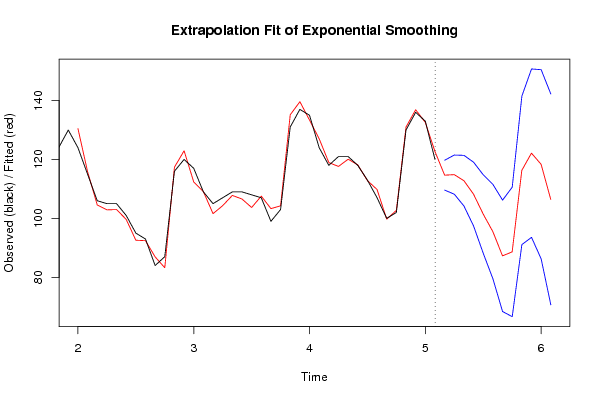
Extrapolation Forecasts of Exponential Smoothing
tForecast95% Lower Bound95% Upper Bound
51114.672687707702109.601425126943119.743950288461
52114.852292868824108.199872209566121.504713528083
53112.791567106821104.189635502630121.393498711012
54108.20742599510997.3645310319048119.050320958313
55101.44855706496688.121321074667114.775793055264
5695.497934572890479.4739257695044111.521943376276
5787.282810042944468.3707933581374106.194826727751
5888.622263651188566.6464392766377110.598088025739
59116.31202884119391.1084300777474141.515627604638
60122.14369782115393.5578085909214150.729587051384
61118.36343765921686.2485351801843150.478340138247
62106.43738971051670.6533405820786142.221438838954

\begin{tabular}{lllllllll}
\hline
Extrapolation Forecasts of Exponential Smoothing \tabularnewline
t & Forecast & 95% Lower Bound & 95% Upper Bound \tabularnewline
51 & 114.672687707702 & 109.601425126943 & 119.743950288461 \tabularnewline
52 & 114.852292868824 & 108.199872209566 & 121.504713528083 \tabularnewline
53 & 112.791567106821 & 104.189635502630 & 121.393498711012 \tabularnewline
54 & 108.207425995109 & 97.3645310319048 & 119.050320958313 \tabularnewline
55 & 101.448557064966 & 88.121321074667 & 114.775793055264 \tabularnewline
56 & 95.4979345728904 & 79.4739257695044 & 111.521943376276 \tabularnewline
57 & 87.2828100429444 & 68.3707933581374 & 106.194826727751 \tabularnewline
58 & 88.6222636511885 & 66.6464392766377 & 110.598088025739 \tabularnewline
59 & 116.312028841193 & 91.1084300777474 & 141.515627604638 \tabularnewline
60 & 122.143697821153 & 93.5578085909214 & 150.729587051384 \tabularnewline
61 & 118.363437659216 & 86.2485351801843 & 150.478340138247 \tabularnewline
62 & 106.437389710516 & 70.6533405820786 & 142.221438838954 \tabularnewline
\hline
\end{tabular}
%Source: https://freestatistics.org/blog/index.php?pk=103581&T=3

[TABLE]
[ROW][C]Extrapolation Forecasts of Exponential Smoothing[/C][/ROW]
[ROW][C]t[/C][C]Forecast[/C][C]95% Lower Bound[/C][C]95% Upper Bound[/C][/ROW]
[ROW][C]51[/C][C]114.672687707702[/C][C]109.601425126943[/C][C]119.743950288461[/C][/ROW]
[ROW][C]52[/C][C]114.852292868824[/C][C]108.199872209566[/C][C]121.504713528083[/C][/ROW]
[ROW][C]53[/C][C]112.791567106821[/C][C]104.189635502630[/C][C]121.393498711012[/C][/ROW]
[ROW][C]54[/C][C]108.207425995109[/C][C]97.3645310319048[/C][C]119.050320958313[/C][/ROW]
[ROW][C]55[/C][C]101.448557064966[/C][C]88.121321074667[/C][C]114.775793055264[/C][/ROW]
[ROW][C]56[/C][C]95.4979345728904[/C][C]79.4739257695044[/C][C]111.521943376276[/C][/ROW]
[ROW][C]57[/C][C]87.2828100429444[/C][C]68.3707933581374[/C][C]106.194826727751[/C][/ROW]
[ROW][C]58[/C][C]88.6222636511885[/C][C]66.6464392766377[/C][C]110.598088025739[/C][/ROW]
[ROW][C]59[/C][C]116.312028841193[/C][C]91.1084300777474[/C][C]141.515627604638[/C][/ROW]
[ROW][C]60[/C][C]122.143697821153[/C][C]93.5578085909214[/C][C]150.729587051384[/C][/ROW]
[ROW][C]61[/C][C]118.363437659216[/C][C]86.2485351801843[/C][C]150.478340138247[/C][/ROW]
[ROW][C]62[/C][C]106.437389710516[/C][C]70.6533405820786[/C][C]142.221438838954[/C][/ROW]
[/TABLE]
Source: https://freestatistics.org/blog/index.php?pk=103581&T=3

Globally Unique Identifier (entire table): ba.freestatistics.org/blog/index.php?pk=103581&T=3

As an alternative you can also use a QR Code:  

The GUIDs for individual cells are displayed in the table below:

Extrapolation Forecasts of Exponential Smoothing
tForecast95% Lower Bound95% Upper Bound
51114.672687707702109.601425126943119.743950288461
52114.852292868824108.199872209566121.504713528083
53112.791567106821104.189635502630121.393498711012
54108.20742599510997.3645310319048119.050320958313
55101.44855706496688.121321074667114.775793055264
5695.497934572890479.4739257695044111.521943376276
5787.282810042944468.3707933581374106.194826727751
5888.622263651188566.6464392766377110.598088025739
59116.31202884119391.1084300777474141.515627604638
60122.14369782115393.5578085909214150.729587051384
61118.36343765921686.2485351801843150.478340138247
62106.43738971051670.6533405820786142.221438838954


Parameters (Session):
par1 = 12 ; par2 = Triple ; par3 = additive ;
Parameters (R input):
par1 = 12 ; par2 = Triple ; par3 = additive ;
R code (references can be found in the software module):
par1 <- as.numeric(par1)
if (par2 == 'Single') K <- 1
if (par2 == 'Double') K <- 2
if (par2 == 'Triple') K <- par1
nx <- length(x)
nxmK <- nx - K
x <- ts(x, frequency = par1)
if (par2 == 'Single') fit <- HoltWinters(x, gamma=0, beta=0)
if (par2 == 'Double') fit <- HoltWinters(x, gamma=0)
if (par2 == 'Triple') fit <- HoltWinters(x, seasonal=par3)
fit
myresid <- x - fit$fitted[,'xhat']
bitmap(file='test1.png')
op <- par(mfrow=c(2,1))
plot(fit,ylab='Observed (black) / Fitted (red)',main='Interpolation Fit of Exponential Smoothing')
plot(myresid,ylab='Residuals',main='Interpolation Prediction Errors')
par(op)
dev.off()
bitmap(file='test2.png')
p <- predict(fit, par1, prediction.interval=TRUE)
np <- length(p[,1])
plot(fit,p,ylab='Observed (black) / Fitted (red)',main='Extrapolation Fit of Exponential Smoothing')
dev.off()
bitmap(file='test3.png')
op <- par(mfrow = c(2,2))
acf(as.numeric(myresid),lag.max = nx/2,main='Residual ACF')
spectrum(myresid,main='Residals Periodogram')
cpgram(myresid,main='Residal Cumulative Periodogram')
qqnorm(myresid,main='Residual Normal QQ Plot')
qqline(myresid)
par(op)
dev.off()
load(file='createtable')
a<-table.start()
a<-table.row.start(a)
a<-table.element(a,'Estimated Parameters of Exponential Smoothing',2,TRUE)
a<-table.row.end(a)
a<-table.row.start(a)
a<-table.element(a,'Parameter',header=TRUE)
a<-table.element(a,'Value',header=TRUE)
a<-table.row.end(a)
a<-table.row.start(a)
a<-table.element(a,'alpha',header=TRUE)
a<-table.element(a,fit$alpha)
a<-table.row.end(a)
a<-table.row.start(a)
a<-table.element(a,'beta',header=TRUE)
a<-table.element(a,fit$beta)
a<-table.row.end(a)
a<-table.row.start(a)
a<-table.element(a,'gamma',header=TRUE)
a<-table.element(a,fit$gamma)
a<-table.row.end(a)
a<-table.end(a)
table.save(a,file='mytable.tab')
a<-table.start()
a<-table.row.start(a)
a<-table.element(a,'Interpolation Forecasts of Exponential Smoothing',4,TRUE)
a<-table.row.end(a)
a<-table.row.start(a)
a<-table.element(a,'t',header=TRUE)
a<-table.element(a,'Observed',header=TRUE)
a<-table.element(a,'Fitted',header=TRUE)
a<-table.element(a,'Residuals',header=TRUE)
a<-table.row.end(a)
for (i in 1:nxmK) {
a<-table.row.start(a)
a<-table.element(a,i+K,header=TRUE)
a<-table.element(a,x[i+K])
a<-table.element(a,fit$fitted[i,'xhat'])
a<-table.element(a,myresid[i])
a<-table.row.end(a)
}
a<-table.end(a)
table.save(a,file='mytable1.tab')
a<-table.start()
a<-table.row.start(a)
a<-table.element(a,'Extrapolation Forecasts of Exponential Smoothing',4,TRUE)
a<-table.row.end(a)
a<-table.row.start(a)
a<-table.element(a,'t',header=TRUE)
a<-table.element(a,'Forecast',header=TRUE)
a<-table.element(a,'95% Lower Bound',header=TRUE)
a<-table.element(a,'95% Upper Bound',header=TRUE)
a<-table.row.end(a)
for (i in 1:np) {
a<-table.row.start(a)
a<-table.element(a,nx+i,header=TRUE)
a<-table.element(a,p[i,'fit'])
a<-table.element(a,p[i,'lwr'])
a<-table.element(a,p[i,'upr'])
a<-table.row.end(a)
}
a<-table.end(a)
table.save(a,file='mytable2.tab')