Free Statistics

of Irreproducible Research!

Author's title

Author*The author of this computation has been verified*
R Software Modulerwasp_logisticregression.wasp
Title produced by softwareBias-Reduced Logistic Regression
Date of computationTue, 30 Nov 2010 14:56:19 +0000
Cite this page as followsStatistical Computations at FreeStatistics.org, Office for Research Development and Education, URL https://freestatistics.org/blog/index.php?v=date/2010/Nov/30/t1291129001epuq2l9or3su95f.htm/, Retrieved Mon, 29 Apr 2024 14:44:27 +0000
Statistical Computations at FreeStatistics.org, Office for Research Development and Education, URL https://freestatistics.org/blog/index.php?pk=103573, Retrieved Mon, 29 Apr 2024 14:44:27 +0000
QR Codes:

Original text written by user:
IsPrivate?No (this computation is public)
User-defined keywords
Estimated Impact125
Family? (F = Feedback message, R = changed R code, M = changed R Module, P = changed Parameters, D = changed Data)
-     [Quasi Random-Walk Identification] [] [2010-11-30 13:40:02] [7d64bf19f34ddcdf2626356c9d5bd60d]
-    D  [Quasi Random-Walk Identification] [] [2010-11-30 13:44:04] [7d64bf19f34ddcdf2626356c9d5bd60d]
-    D    [Quasi Random-Walk Identification] [] [2010-11-30 13:45:23] [7d64bf19f34ddcdf2626356c9d5bd60d]
-    D      [Quasi Random-Walk Identification] [] [2010-11-30 13:46:48] [7d64bf19f34ddcdf2626356c9d5bd60d]
-    D        [Quasi Random-Walk Identification] [] [2010-11-30 14:01:52] [7d64bf19f34ddcdf2626356c9d5bd60d]
-    D          [Quasi Random-Walk Identification] [] [2010-11-30 14:03:28] [7d64bf19f34ddcdf2626356c9d5bd60d]
-    D            [Quasi Random-Walk Identification] [] [2010-11-30 14:04:50] [7d64bf19f34ddcdf2626356c9d5bd60d]
- RM D                [Bias-Reduced Logistic Regression] [] [2010-11-30 14:56:19] [5842cf9dd57f9603e676e11284d3404a] [Current]
-    D                  [Bias-Reduced Logistic Regression] [] [2010-11-30 20:56:05] [7d64bf19f34ddcdf2626356c9d5bd60d]
Feedback Forum

Post a new message
Dataseries X:
1 0.841400
1 0.197000
1 0.000000
1 0.254200
1 0.582400
1 0.756600
1 0.660000
1 0.447200
1 0.003000
1 0.944200
0 0.010400
0 0.002000
0 0.015000
0 0.004000
0 0.003200
0 0.002400
0 0.005000
0 0.002200
0 0.003200
0 0.056200


Summary of computational transaction
Raw Inputview raw input (R code)
Raw Outputview raw output of R engine
Computing time2 seconds
R Server'Gwilym Jenkins' @ 72.249.127.135

\begin{tabular}{lllllllll}
\hline
Summary of computational transaction \tabularnewline
Raw Input & view raw input (R code)  \tabularnewline
Raw Output & view raw output of R engine  \tabularnewline
Computing time & 2 seconds \tabularnewline
R Server & 'Gwilym Jenkins' @ 72.249.127.135 \tabularnewline
\hline
\end{tabular}
%Source: https://freestatistics.org/blog/index.php?pk=103573&T=0

[TABLE]
[ROW][C]Summary of computational transaction[/C][/ROW]
[ROW][C]Raw Input[/C][C]view raw input (R code) [/C][/ROW]
[ROW][C]Raw Output[/C][C]view raw output of R engine [/C][/ROW]
[ROW][C]Computing time[/C][C]2 seconds[/C][/ROW]
[ROW][C]R Server[/C][C]'Gwilym Jenkins' @ 72.249.127.135[/C][/ROW]
[/TABLE]
Source: https://freestatistics.org/blog/index.php?pk=103573&T=0

Globally Unique Identifier (entire table): ba.freestatistics.org/blog/index.php?pk=103573&T=0

As an alternative you can also use a QR Code:  

The GUIDs for individual cells are displayed in the table below:

Summary of computational transaction
Raw Inputview raw input (R code)
Raw Outputview raw output of R engine
Computing time2 seconds
R Server'Gwilym Jenkins' @ 72.249.127.135


Coefficients of Bias-Reduced Logistic Regression
VariableParameterS.E.t-stat2-sided p-value
(Intercept)-1.329477202244730.699616878327928-1.900293208222980.0735337626023451
P9.02543994238355.074843573992971.778466628732390.0922226035616822

\begin{tabular}{lllllllll}
\hline
Coefficients of Bias-Reduced Logistic Regression \tabularnewline
Variable & Parameter & S.E. & t-stat & 2-sided p-value \tabularnewline
(Intercept) & -1.32947720224473 & 0.699616878327928 & -1.90029320822298 & 0.0735337626023451 \tabularnewline
P & 9.0254399423835 & 5.07484357399297 & 1.77846662873239 & 0.0922226035616822 \tabularnewline
\hline
\end{tabular}
%Source: https://freestatistics.org/blog/index.php?pk=103573&T=1

[TABLE]
[ROW][C]Coefficients of Bias-Reduced Logistic Regression[/C][/ROW]
[ROW][C]Variable[/C][C]Parameter[/C][C]S.E.[/C][C]t-stat[/C][C]2-sided p-value[/C][/ROW]
[ROW][C](Intercept)[/C][C]-1.32947720224473[/C][C]0.699616878327928[/C][C]-1.90029320822298[/C][C]0.0735337626023451[/C][/ROW]
[ROW][C]P[/C][C]9.0254399423835[/C][C]5.07484357399297[/C][C]1.77846662873239[/C][C]0.0922226035616822[/C][/ROW]
[/TABLE]
Source: https://freestatistics.org/blog/index.php?pk=103573&T=1

Globally Unique Identifier (entire table): ba.freestatistics.org/blog/index.php?pk=103573&T=1

As an alternative you can also use a QR Code:  

The GUIDs for individual cells are displayed in the table below:

Coefficients of Bias-Reduced Logistic Regression
VariableParameterS.E.t-stat2-sided p-value
(Intercept)-1.329477202244730.699616878327928-1.900293208222980.0735337626023451
P9.02543994238355.074843573992971.778466628732390.0922226035616822


Summary of Bias-Reduced Logistic Regression
Deviance13.1878373939968
Penalized deviance15.4780628985594
Residual Degrees of Freedom18
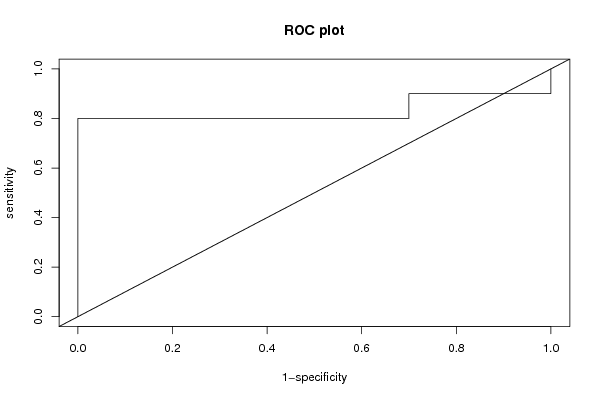
ROC Area0.83
Hosmer–Lemeshow test
Chi-square4.47748980314667
Degrees of Freedom8
P(>Chi)0.811680935800227

\begin{tabular}{lllllllll}
\hline
Summary of Bias-Reduced Logistic Regression \tabularnewline
Deviance & 13.1878373939968 \tabularnewline
Penalized deviance & 15.4780628985594 \tabularnewline
Residual Degrees of Freedom & 18 \tabularnewline
ROC Area & 0.83 \tabularnewline
Hosmer–Lemeshow test \tabularnewline
Chi-square & 4.47748980314667 \tabularnewline
Degrees of Freedom & 8 \tabularnewline
P(>Chi) & 0.811680935800227 \tabularnewline
\hline
\end{tabular}
%Source: https://freestatistics.org/blog/index.php?pk=103573&T=2

[TABLE]
[ROW][C]Summary of Bias-Reduced Logistic Regression[/C][/ROW]
[ROW][C]Deviance[/C][C]13.1878373939968[/C][/ROW]
[ROW][C]Penalized deviance[/C][C]15.4780628985594[/C][/ROW]
[ROW][C]Residual Degrees of Freedom[/C][C]18[/C][/ROW]
[ROW][C]ROC Area[/C][C]0.83[/C][/ROW]
[ROW][C]Hosmer–Lemeshow test[/C][/ROW]
[ROW][C]Chi-square[/C][C]4.47748980314667[/C][/ROW]
[ROW][C]Degrees of Freedom[/C][C]8[/C][/ROW]
[ROW][C]P(>Chi)[/C][C]0.811680935800227[/C][/ROW]
[/TABLE]
Source: https://freestatistics.org/blog/index.php?pk=103573&T=2

Globally Unique Identifier (entire table): ba.freestatistics.org/blog/index.php?pk=103573&T=2

As an alternative you can also use a QR Code:  

The GUIDs for individual cells are displayed in the table below:

Summary of Bias-Reduced Logistic Regression
Deviance13.1878373939968
Penalized deviance15.4780628985594
Residual Degrees of Freedom18
ROC Area0.83
Hosmer–Lemeshow test
Chi-square4.47748980314667
Degrees of Freedom8
P(>Chi)0.811680935800227


Fit of Logistic Regression
IndexActualFittedError
110.9981010017504170.00189899824958328
210.6102907337605510.389709266239449
310.2092458552405820.790754144759418
410.7240797435156560.275920256484344
510.9806768477760570.0193231522239428
610.995926499104440.00407350089556091
710.9903137375462610.00968626245373894
810.9374208129196730.0625791870803267
910.2137612296735640.786238770326436
1010.9992482413522830.000751758647717038
1100.225200594719172-0.225200594719172
1200.212248266657792-0.212248266657792
1300.232527240787173-0.232527240787173
1400.215282030154283-0.215282030154283
1500.214064762806792-0.214064762806792
1600.21285251130805-0.21285251130805
1700.216810666735283-0.216810666735283
1800.212550232220111-0.212550232220111
1900.214064762806792-0.214064762806792
2000.305286791176809-0.305286791176809

\begin{tabular}{lllllllll}
\hline
Fit of Logistic Regression \tabularnewline
Index & Actual & Fitted & Error \tabularnewline
1 & 1 & 0.998101001750417 & 0.00189899824958328 \tabularnewline
2 & 1 & 0.610290733760551 & 0.389709266239449 \tabularnewline
3 & 1 & 0.209245855240582 & 0.790754144759418 \tabularnewline
4 & 1 & 0.724079743515656 & 0.275920256484344 \tabularnewline
5 & 1 & 0.980676847776057 & 0.0193231522239428 \tabularnewline
6 & 1 & 0.99592649910444 & 0.00407350089556091 \tabularnewline
7 & 1 & 0.990313737546261 & 0.00968626245373894 \tabularnewline
8 & 1 & 0.937420812919673 & 0.0625791870803267 \tabularnewline
9 & 1 & 0.213761229673564 & 0.786238770326436 \tabularnewline
10 & 1 & 0.999248241352283 & 0.000751758647717038 \tabularnewline
11 & 0 & 0.225200594719172 & -0.225200594719172 \tabularnewline
12 & 0 & 0.212248266657792 & -0.212248266657792 \tabularnewline
13 & 0 & 0.232527240787173 & -0.232527240787173 \tabularnewline
14 & 0 & 0.215282030154283 & -0.215282030154283 \tabularnewline
15 & 0 & 0.214064762806792 & -0.214064762806792 \tabularnewline
16 & 0 & 0.21285251130805 & -0.21285251130805 \tabularnewline
17 & 0 & 0.216810666735283 & -0.216810666735283 \tabularnewline
18 & 0 & 0.212550232220111 & -0.212550232220111 \tabularnewline
19 & 0 & 0.214064762806792 & -0.214064762806792 \tabularnewline
20 & 0 & 0.305286791176809 & -0.305286791176809 \tabularnewline
\hline
\end{tabular}
%Source: https://freestatistics.org/blog/index.php?pk=103573&T=3

[TABLE]
[ROW][C]Fit of Logistic Regression[/C][/ROW]
[ROW][C]Index[/C][C]Actual[/C][C]Fitted[/C][C]Error[/C][/ROW]
[ROW][C]1[/C][C]1[/C][C]0.998101001750417[/C][C]0.00189899824958328[/C][/ROW]
[ROW][C]2[/C][C]1[/C][C]0.610290733760551[/C][C]0.389709266239449[/C][/ROW]
[ROW][C]3[/C][C]1[/C][C]0.209245855240582[/C][C]0.790754144759418[/C][/ROW]
[ROW][C]4[/C][C]1[/C][C]0.724079743515656[/C][C]0.275920256484344[/C][/ROW]
[ROW][C]5[/C][C]1[/C][C]0.980676847776057[/C][C]0.0193231522239428[/C][/ROW]
[ROW][C]6[/C][C]1[/C][C]0.99592649910444[/C][C]0.00407350089556091[/C][/ROW]
[ROW][C]7[/C][C]1[/C][C]0.990313737546261[/C][C]0.00968626245373894[/C][/ROW]
[ROW][C]8[/C][C]1[/C][C]0.937420812919673[/C][C]0.0625791870803267[/C][/ROW]
[ROW][C]9[/C][C]1[/C][C]0.213761229673564[/C][C]0.786238770326436[/C][/ROW]
[ROW][C]10[/C][C]1[/C][C]0.999248241352283[/C][C]0.000751758647717038[/C][/ROW]
[ROW][C]11[/C][C]0[/C][C]0.225200594719172[/C][C]-0.225200594719172[/C][/ROW]
[ROW][C]12[/C][C]0[/C][C]0.212248266657792[/C][C]-0.212248266657792[/C][/ROW]
[ROW][C]13[/C][C]0[/C][C]0.232527240787173[/C][C]-0.232527240787173[/C][/ROW]
[ROW][C]14[/C][C]0[/C][C]0.215282030154283[/C][C]-0.215282030154283[/C][/ROW]
[ROW][C]15[/C][C]0[/C][C]0.214064762806792[/C][C]-0.214064762806792[/C][/ROW]
[ROW][C]16[/C][C]0[/C][C]0.21285251130805[/C][C]-0.21285251130805[/C][/ROW]
[ROW][C]17[/C][C]0[/C][C]0.216810666735283[/C][C]-0.216810666735283[/C][/ROW]
[ROW][C]18[/C][C]0[/C][C]0.212550232220111[/C][C]-0.212550232220111[/C][/ROW]
[ROW][C]19[/C][C]0[/C][C]0.214064762806792[/C][C]-0.214064762806792[/C][/ROW]
[ROW][C]20[/C][C]0[/C][C]0.305286791176809[/C][C]-0.305286791176809[/C][/ROW]
[/TABLE]
Source: https://freestatistics.org/blog/index.php?pk=103573&T=3

Globally Unique Identifier (entire table): ba.freestatistics.org/blog/index.php?pk=103573&T=3

As an alternative you can also use a QR Code:  

The GUIDs for individual cells are displayed in the table below:

Fit of Logistic Regression
IndexActualFittedError
110.9981010017504170.00189899824958328
210.6102907337605510.389709266239449
310.2092458552405820.790754144759418
410.7240797435156560.275920256484344
510.9806768477760570.0193231522239428
610.995926499104440.00407350089556091
710.9903137375462610.00968626245373894
810.9374208129196730.0625791870803267
910.2137612296735640.786238770326436
1010.9992482413522830.000751758647717038
1100.225200594719172-0.225200594719172
1200.212248266657792-0.212248266657792
1300.232527240787173-0.232527240787173
1400.215282030154283-0.215282030154283
1500.214064762806792-0.214064762806792
1600.21285251130805-0.21285251130805
1700.216810666735283-0.216810666735283
1800.212550232220111-0.212550232220111
1900.214064762806792-0.214064762806792
2000.305286791176809-0.305286791176809


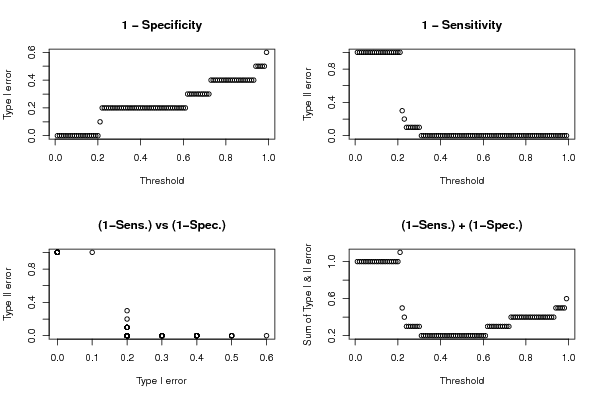
Type I & II errors for various threshold values
ThresholdType IType II
0.0101
0.0201
0.0301
0.0401
0.0501
0.0601
0.0701
0.0801
0.0901
0.101
0.1101
0.1201
0.1301
0.1401
0.1501
0.1601
0.1701
0.1801
0.1901
0.201
0.210.11
0.220.20.3
0.230.20.2
0.240.20.1
0.250.20.1
0.260.20.1
0.270.20.1
0.280.20.1
0.290.20.1
0.30.20.1
0.310.20
0.320.20
0.330.20
0.340.20
0.350.20
0.360.20
0.370.20
0.380.20
0.390.20
0.40.20
0.410.20
0.420.20
0.430.20
0.440.20
0.450.20
0.460.20
0.470.20
0.480.20
0.490.20
0.50.20
0.510.20
0.520.20
0.530.20
0.540.20
0.550.20
0.560.20
0.570.20
0.580.20
0.590.20
0.60.20
0.610.20
0.620.30
0.630.30
0.640.30
0.650.30
0.660.30
0.670.30
0.680.30
0.690.30
0.70.30
0.710.30
0.720.30
0.730.40
0.740.40
0.750.40
0.760.40
0.770.40
0.780.40
0.790.40
0.80.40
0.810.40
0.820.40
0.830.40
0.840.40
0.850.40
0.860.40
0.870.40
0.880.40
0.890.40
0.90.40
0.910.40
0.920.40
0.930.40
0.940.50
0.950.50
0.960.50
0.970.50
0.980.50
0.990.60

\begin{tabular}{lllllllll}
\hline
Type I & II errors for various threshold values \tabularnewline
Threshold & Type I & Type II \tabularnewline
0.01 & 0 & 1 \tabularnewline
0.02 & 0 & 1 \tabularnewline
0.03 & 0 & 1 \tabularnewline
0.04 & 0 & 1 \tabularnewline
0.05 & 0 & 1 \tabularnewline
0.06 & 0 & 1 \tabularnewline
0.07 & 0 & 1 \tabularnewline
0.08 & 0 & 1 \tabularnewline
0.09 & 0 & 1 \tabularnewline
0.1 & 0 & 1 \tabularnewline
0.11 & 0 & 1 \tabularnewline
0.12 & 0 & 1 \tabularnewline
0.13 & 0 & 1 \tabularnewline
0.14 & 0 & 1 \tabularnewline
0.15 & 0 & 1 \tabularnewline
0.16 & 0 & 1 \tabularnewline
0.17 & 0 & 1 \tabularnewline
0.18 & 0 & 1 \tabularnewline
0.19 & 0 & 1 \tabularnewline
0.2 & 0 & 1 \tabularnewline
0.21 & 0.1 & 1 \tabularnewline
0.22 & 0.2 & 0.3 \tabularnewline
0.23 & 0.2 & 0.2 \tabularnewline
0.24 & 0.2 & 0.1 \tabularnewline
0.25 & 0.2 & 0.1 \tabularnewline
0.26 & 0.2 & 0.1 \tabularnewline
0.27 & 0.2 & 0.1 \tabularnewline
0.28 & 0.2 & 0.1 \tabularnewline
0.29 & 0.2 & 0.1 \tabularnewline
0.3 & 0.2 & 0.1 \tabularnewline
0.31 & 0.2 & 0 \tabularnewline
0.32 & 0.2 & 0 \tabularnewline
0.33 & 0.2 & 0 \tabularnewline
0.34 & 0.2 & 0 \tabularnewline
0.35 & 0.2 & 0 \tabularnewline
0.36 & 0.2 & 0 \tabularnewline
0.37 & 0.2 & 0 \tabularnewline
0.38 & 0.2 & 0 \tabularnewline
0.39 & 0.2 & 0 \tabularnewline
0.4 & 0.2 & 0 \tabularnewline
0.41 & 0.2 & 0 \tabularnewline
0.42 & 0.2 & 0 \tabularnewline
0.43 & 0.2 & 0 \tabularnewline
0.44 & 0.2 & 0 \tabularnewline
0.45 & 0.2 & 0 \tabularnewline
0.46 & 0.2 & 0 \tabularnewline
0.47 & 0.2 & 0 \tabularnewline
0.48 & 0.2 & 0 \tabularnewline
0.49 & 0.2 & 0 \tabularnewline
0.5 & 0.2 & 0 \tabularnewline
0.51 & 0.2 & 0 \tabularnewline
0.52 & 0.2 & 0 \tabularnewline
0.53 & 0.2 & 0 \tabularnewline
0.54 & 0.2 & 0 \tabularnewline
0.55 & 0.2 & 0 \tabularnewline
0.56 & 0.2 & 0 \tabularnewline
0.57 & 0.2 & 0 \tabularnewline
0.58 & 0.2 & 0 \tabularnewline
0.59 & 0.2 & 0 \tabularnewline
0.6 & 0.2 & 0 \tabularnewline
0.61 & 0.2 & 0 \tabularnewline
0.62 & 0.3 & 0 \tabularnewline
0.63 & 0.3 & 0 \tabularnewline
0.64 & 0.3 & 0 \tabularnewline
0.65 & 0.3 & 0 \tabularnewline
0.66 & 0.3 & 0 \tabularnewline
0.67 & 0.3 & 0 \tabularnewline
0.68 & 0.3 & 0 \tabularnewline
0.69 & 0.3 & 0 \tabularnewline
0.7 & 0.3 & 0 \tabularnewline
0.71 & 0.3 & 0 \tabularnewline
0.72 & 0.3 & 0 \tabularnewline
0.73 & 0.4 & 0 \tabularnewline
0.74 & 0.4 & 0 \tabularnewline
0.75 & 0.4 & 0 \tabularnewline
0.76 & 0.4 & 0 \tabularnewline
0.77 & 0.4 & 0 \tabularnewline
0.78 & 0.4 & 0 \tabularnewline
0.79 & 0.4 & 0 \tabularnewline
0.8 & 0.4 & 0 \tabularnewline
0.81 & 0.4 & 0 \tabularnewline
0.82 & 0.4 & 0 \tabularnewline
0.83 & 0.4 & 0 \tabularnewline
0.84 & 0.4 & 0 \tabularnewline
0.85 & 0.4 & 0 \tabularnewline
0.86 & 0.4 & 0 \tabularnewline
0.87 & 0.4 & 0 \tabularnewline
0.88 & 0.4 & 0 \tabularnewline
0.89 & 0.4 & 0 \tabularnewline
0.9 & 0.4 & 0 \tabularnewline
0.91 & 0.4 & 0 \tabularnewline
0.92 & 0.4 & 0 \tabularnewline
0.93 & 0.4 & 0 \tabularnewline
0.94 & 0.5 & 0 \tabularnewline
0.95 & 0.5 & 0 \tabularnewline
0.96 & 0.5 & 0 \tabularnewline
0.97 & 0.5 & 0 \tabularnewline
0.98 & 0.5 & 0 \tabularnewline
0.99 & 0.6 & 0 \tabularnewline
\hline
\end{tabular}
%Source: https://freestatistics.org/blog/index.php?pk=103573&T=4

[TABLE]
[ROW][C]Type I & II errors for various threshold values[/C][/ROW]
[ROW][C]Threshold[/C][C]Type I[/C][C]Type II[/C][/ROW]
[ROW][C]0.01[/C][C]0[/C][C]1[/C][/ROW]
[ROW][C]0.02[/C][C]0[/C][C]1[/C][/ROW]
[ROW][C]0.03[/C][C]0[/C][C]1[/C][/ROW]
[ROW][C]0.04[/C][C]0[/C][C]1[/C][/ROW]
[ROW][C]0.05[/C][C]0[/C][C]1[/C][/ROW]
[ROW][C]0.06[/C][C]0[/C][C]1[/C][/ROW]
[ROW][C]0.07[/C][C]0[/C][C]1[/C][/ROW]
[ROW][C]0.08[/C][C]0[/C][C]1[/C][/ROW]
[ROW][C]0.09[/C][C]0[/C][C]1[/C][/ROW]
[ROW][C]0.1[/C][C]0[/C][C]1[/C][/ROW]
[ROW][C]0.11[/C][C]0[/C][C]1[/C][/ROW]
[ROW][C]0.12[/C][C]0[/C][C]1[/C][/ROW]
[ROW][C]0.13[/C][C]0[/C][C]1[/C][/ROW]
[ROW][C]0.14[/C][C]0[/C][C]1[/C][/ROW]
[ROW][C]0.15[/C][C]0[/C][C]1[/C][/ROW]
[ROW][C]0.16[/C][C]0[/C][C]1[/C][/ROW]
[ROW][C]0.17[/C][C]0[/C][C]1[/C][/ROW]
[ROW][C]0.18[/C][C]0[/C][C]1[/C][/ROW]
[ROW][C]0.19[/C][C]0[/C][C]1[/C][/ROW]
[ROW][C]0.2[/C][C]0[/C][C]1[/C][/ROW]
[ROW][C]0.21[/C][C]0.1[/C][C]1[/C][/ROW]
[ROW][C]0.22[/C][C]0.2[/C][C]0.3[/C][/ROW]
[ROW][C]0.23[/C][C]0.2[/C][C]0.2[/C][/ROW]
[ROW][C]0.24[/C][C]0.2[/C][C]0.1[/C][/ROW]
[ROW][C]0.25[/C][C]0.2[/C][C]0.1[/C][/ROW]
[ROW][C]0.26[/C][C]0.2[/C][C]0.1[/C][/ROW]
[ROW][C]0.27[/C][C]0.2[/C][C]0.1[/C][/ROW]
[ROW][C]0.28[/C][C]0.2[/C][C]0.1[/C][/ROW]
[ROW][C]0.29[/C][C]0.2[/C][C]0.1[/C][/ROW]
[ROW][C]0.3[/C][C]0.2[/C][C]0.1[/C][/ROW]
[ROW][C]0.31[/C][C]0.2[/C][C]0[/C][/ROW]
[ROW][C]0.32[/C][C]0.2[/C][C]0[/C][/ROW]
[ROW][C]0.33[/C][C]0.2[/C][C]0[/C][/ROW]
[ROW][C]0.34[/C][C]0.2[/C][C]0[/C][/ROW]
[ROW][C]0.35[/C][C]0.2[/C][C]0[/C][/ROW]
[ROW][C]0.36[/C][C]0.2[/C][C]0[/C][/ROW]
[ROW][C]0.37[/C][C]0.2[/C][C]0[/C][/ROW]
[ROW][C]0.38[/C][C]0.2[/C][C]0[/C][/ROW]
[ROW][C]0.39[/C][C]0.2[/C][C]0[/C][/ROW]
[ROW][C]0.4[/C][C]0.2[/C][C]0[/C][/ROW]
[ROW][C]0.41[/C][C]0.2[/C][C]0[/C][/ROW]
[ROW][C]0.42[/C][C]0.2[/C][C]0[/C][/ROW]
[ROW][C]0.43[/C][C]0.2[/C][C]0[/C][/ROW]
[ROW][C]0.44[/C][C]0.2[/C][C]0[/C][/ROW]
[ROW][C]0.45[/C][C]0.2[/C][C]0[/C][/ROW]
[ROW][C]0.46[/C][C]0.2[/C][C]0[/C][/ROW]
[ROW][C]0.47[/C][C]0.2[/C][C]0[/C][/ROW]
[ROW][C]0.48[/C][C]0.2[/C][C]0[/C][/ROW]
[ROW][C]0.49[/C][C]0.2[/C][C]0[/C][/ROW]
[ROW][C]0.5[/C][C]0.2[/C][C]0[/C][/ROW]
[ROW][C]0.51[/C][C]0.2[/C][C]0[/C][/ROW]
[ROW][C]0.52[/C][C]0.2[/C][C]0[/C][/ROW]
[ROW][C]0.53[/C][C]0.2[/C][C]0[/C][/ROW]
[ROW][C]0.54[/C][C]0.2[/C][C]0[/C][/ROW]
[ROW][C]0.55[/C][C]0.2[/C][C]0[/C][/ROW]
[ROW][C]0.56[/C][C]0.2[/C][C]0[/C][/ROW]
[ROW][C]0.57[/C][C]0.2[/C][C]0[/C][/ROW]
[ROW][C]0.58[/C][C]0.2[/C][C]0[/C][/ROW]
[ROW][C]0.59[/C][C]0.2[/C][C]0[/C][/ROW]
[ROW][C]0.6[/C][C]0.2[/C][C]0[/C][/ROW]
[ROW][C]0.61[/C][C]0.2[/C][C]0[/C][/ROW]
[ROW][C]0.62[/C][C]0.3[/C][C]0[/C][/ROW]
[ROW][C]0.63[/C][C]0.3[/C][C]0[/C][/ROW]
[ROW][C]0.64[/C][C]0.3[/C][C]0[/C][/ROW]
[ROW][C]0.65[/C][C]0.3[/C][C]0[/C][/ROW]
[ROW][C]0.66[/C][C]0.3[/C][C]0[/C][/ROW]
[ROW][C]0.67[/C][C]0.3[/C][C]0[/C][/ROW]
[ROW][C]0.68[/C][C]0.3[/C][C]0[/C][/ROW]
[ROW][C]0.69[/C][C]0.3[/C][C]0[/C][/ROW]
[ROW][C]0.7[/C][C]0.3[/C][C]0[/C][/ROW]
[ROW][C]0.71[/C][C]0.3[/C][C]0[/C][/ROW]
[ROW][C]0.72[/C][C]0.3[/C][C]0[/C][/ROW]
[ROW][C]0.73[/C][C]0.4[/C][C]0[/C][/ROW]
[ROW][C]0.74[/C][C]0.4[/C][C]0[/C][/ROW]
[ROW][C]0.75[/C][C]0.4[/C][C]0[/C][/ROW]
[ROW][C]0.76[/C][C]0.4[/C][C]0[/C][/ROW]
[ROW][C]0.77[/C][C]0.4[/C][C]0[/C][/ROW]
[ROW][C]0.78[/C][C]0.4[/C][C]0[/C][/ROW]
[ROW][C]0.79[/C][C]0.4[/C][C]0[/C][/ROW]
[ROW][C]0.8[/C][C]0.4[/C][C]0[/C][/ROW]
[ROW][C]0.81[/C][C]0.4[/C][C]0[/C][/ROW]
[ROW][C]0.82[/C][C]0.4[/C][C]0[/C][/ROW]
[ROW][C]0.83[/C][C]0.4[/C][C]0[/C][/ROW]
[ROW][C]0.84[/C][C]0.4[/C][C]0[/C][/ROW]
[ROW][C]0.85[/C][C]0.4[/C][C]0[/C][/ROW]
[ROW][C]0.86[/C][C]0.4[/C][C]0[/C][/ROW]
[ROW][C]0.87[/C][C]0.4[/C][C]0[/C][/ROW]
[ROW][C]0.88[/C][C]0.4[/C][C]0[/C][/ROW]
[ROW][C]0.89[/C][C]0.4[/C][C]0[/C][/ROW]
[ROW][C]0.9[/C][C]0.4[/C][C]0[/C][/ROW]
[ROW][C]0.91[/C][C]0.4[/C][C]0[/C][/ROW]
[ROW][C]0.92[/C][C]0.4[/C][C]0[/C][/ROW]
[ROW][C]0.93[/C][C]0.4[/C][C]0[/C][/ROW]
[ROW][C]0.94[/C][C]0.5[/C][C]0[/C][/ROW]
[ROW][C]0.95[/C][C]0.5[/C][C]0[/C][/ROW]
[ROW][C]0.96[/C][C]0.5[/C][C]0[/C][/ROW]
[ROW][C]0.97[/C][C]0.5[/C][C]0[/C][/ROW]
[ROW][C]0.98[/C][C]0.5[/C][C]0[/C][/ROW]
[ROW][C]0.99[/C][C]0.6[/C][C]0[/C][/ROW]
[/TABLE]
Source: https://freestatistics.org/blog/index.php?pk=103573&T=4

Globally Unique Identifier (entire table): ba.freestatistics.org/blog/index.php?pk=103573&T=4

As an alternative you can also use a QR Code:  

The GUIDs for individual cells are displayed in the table below:

Type I & II errors for various threshold values
ThresholdType IType II
0.0101
0.0201
0.0301
0.0401
0.0501
0.0601
0.0701
0.0801
0.0901
0.101
0.1101
0.1201
0.1301
0.1401
0.1501
0.1601
0.1701
0.1801
0.1901
0.201
0.210.11
0.220.20.3
0.230.20.2
0.240.20.1
0.250.20.1
0.260.20.1
0.270.20.1
0.280.20.1
0.290.20.1
0.30.20.1
0.310.20
0.320.20
0.330.20
0.340.20
0.350.20
0.360.20
0.370.20
0.380.20
0.390.20
0.40.20
0.410.20
0.420.20
0.430.20
0.440.20
0.450.20
0.460.20
0.470.20
0.480.20
0.490.20
0.50.20
0.510.20
0.520.20
0.530.20
0.540.20
0.550.20
0.560.20
0.570.20
0.580.20
0.590.20
0.60.20
0.610.20
0.620.30
0.630.30
0.640.30
0.650.30
0.660.30
0.670.30
0.680.30
0.690.30
0.70.30
0.710.30
0.720.30
0.730.40
0.740.40
0.750.40
0.760.40
0.770.40
0.780.40
0.790.40
0.80.40
0.810.40
0.820.40
0.830.40
0.840.40
0.850.40
0.860.40
0.870.40
0.880.40
0.890.40
0.90.40
0.910.40
0.920.40
0.930.40
0.940.50
0.950.50
0.960.50
0.970.50
0.980.50
0.990.60


Parameters (Session):
Parameters (R input):
R code (references can be found in the software module):
library(brglm)
roc.plot <- function (sd, sdc, newplot = TRUE, ...)
{
sall <- sort(c(sd, sdc))
sens <- 0
specc <- 0
for (i in length(sall):1) {
sens <- c(sens, mean(sd >= sall[i], na.rm = T))
specc <- c(specc, mean(sdc >= sall[i], na.rm = T))
}
if (newplot) {
plot(specc, sens, xlim = c(0, 1), ylim = c(0, 1), type = 'l',
xlab = '1-specificity', ylab = 'sensitivity', main = 'ROC plot', ...)
abline(0, 1)
}
else lines(specc, sens, ...)
npoints <- length(sens)
area <- sum(0.5 * (sens[-1] + sens[-npoints]) * (specc[-1] -
specc[-npoints]))
lift <- (sens - specc)[-1]
cutoff <- sall[lift == max(lift)][1]
sensopt <- sens[-1][lift == max(lift)][1]
specopt <- 1 - specc[-1][lift == max(lift)][1]
list(area = area, cutoff = cutoff, sensopt = sensopt, specopt = specopt)
}
roc.analysis <- function (object, newdata = NULL, newplot = TRUE, ...)
{
if (is.null(newdata)) {
sd <- object$fitted[object$y == 1]
sdc <- object$fitted[object$y == 0]
}
else {
sd <- predict(object, newdata, type = 'response')[newdata$y ==
1]
sdc <- predict(object, newdata, type = 'response')[newdata$y ==
0]
}
roc.plot(sd, sdc, newplot, ...)
}
hosmerlem <- function (y, yhat, g = 10)
{
cutyhat <- cut(yhat, breaks = quantile(yhat, probs = seq(0,
1, 1/g)), include.lowest = T)
obs <- xtabs(cbind(1 - y, y) ~ cutyhat)
expect <- xtabs(cbind(1 - yhat, yhat) ~ cutyhat)
chisq <- sum((obs - expect)^2/expect)
P <- 1 - pchisq(chisq, g - 2)
c('X^2' = chisq, Df = g - 2, 'P(>Chi)' = P)
}
x <- as.data.frame(t(y))
r <- brglm(x)
summary(r)
rc <- summary(r)$coeff
try(hm <- hosmerlem(y[1,],r$fitted.values),silent=T)
try(hm,silent=T)
bitmap(file='test0.png')
ra <- roc.analysis(r)
dev.off()
te <- array(0,dim=c(2,99))
for (i in 1:99) {
threshold <- i / 100
numcorr1 <- 0
numfaul1 <- 0
numcorr0 <- 0
numfaul0 <- 0
for (j in 1:length(r$fitted.values)) {
if (y[1,j] > 0.99) {
if (r$fitted.values[j] >= threshold) numcorr1 = numcorr1 + 1 else numfaul1 = numfaul1 + 1
} else {
if (r$fitted.values[j] < threshold) numcorr0 = numcorr0 + 1 else numfaul0 = numfaul0 + 1
}
}
te[1,i] <- numfaul1 / (numfaul1 + numcorr1)
te[2,i] <- numfaul0 / (numfaul0 + numcorr0)
}
bitmap(file='test1.png')
op <- par(mfrow=c(2,2))
plot((1:99)/100,te[1,],xlab='Threshold',ylab='Type I error', main='1 - Specificity')
plot((1:99)/100,te[2,],xlab='Threshold',ylab='Type II error', main='1 - Sensitivity')
plot(te[1,],te[2,],xlab='Type I error',ylab='Type II error', main='(1-Sens.) vs (1-Spec.)')
plot((1:99)/100,te[1,]+te[2,],xlab='Threshold',ylab='Sum of Type I & II error', main='(1-Sens.) + (1-Spec.)')
par(op)
dev.off()
load(file='createtable')
a<-table.start()
a<-table.row.start(a)
a<-table.element(a,'Coefficients of Bias-Reduced Logistic Regression',5,TRUE)
a<-table.row.end(a)
a<-table.row.start(a)
a<-table.element(a,'Variable',header=TRUE)
a<-table.element(a,'Parameter',header=TRUE)
a<-table.element(a,'S.E.',header=TRUE)
a<-table.element(a,'t-stat',header=TRUE)
a<-table.element(a,'2-sided p-value',header=TRUE)
a<-table.row.end(a)
for (i in 1:length(rc[,1])) {
a<-table.row.start(a)
a<-table.element(a,labels(rc)[[1]][i],header=TRUE)
a<-table.element(a,rc[i,1])
a<-table.element(a,rc[i,2])
a<-table.element(a,rc[i,3])
a<-table.element(a,2*(1-pt(abs(rc[i,3]),r$df.residual)))
a<-table.row.end(a)
}
a<-table.end(a)
table.save(a,file='mytable.tab')
a<-table.start()
a<-table.row.start(a)
a<-table.element(a,'Summary of Bias-Reduced Logistic Regression',2,TRUE)
a<-table.row.end(a)
a<-table.row.start(a)
a<-table.element(a,'Deviance',1,TRUE)
a<-table.element(a,r$deviance)
a<-table.row.end(a)
a<-table.row.start(a)
a<-table.element(a,'Penalized deviance',1,TRUE)
a<-table.element(a,r$penalized.deviance)
a<-table.row.end(a)
a<-table.row.start(a)
a<-table.element(a,'Residual Degrees of Freedom',1,TRUE)
a<-table.element(a,r$df.residual)
a<-table.row.end(a)
a<-table.row.start(a)
a<-table.element(a,'ROC Area',1,TRUE)
a<-table.element(a,ra$area)
a<-table.row.end(a)
a<-table.row.start(a)
a<-table.element(a,'Hosmer–Lemeshow test',2,TRUE)
a<-table.row.end(a)
a<-table.row.start(a)
a<-table.element(a,'Chi-square',1,TRUE)
phm <- array('NA',dim=3)
for (i in 1:3) { try(phm[i] <- hm[i],silent=T) }
a<-table.element(a,phm[1])
a<-table.row.end(a)
a<-table.row.start(a)
a<-table.element(a,'Degrees of Freedom',1,TRUE)
a<-table.element(a,phm[2])
a<-table.row.end(a)
a<-table.row.start(a)
a<-table.element(a,'P(>Chi)',1,TRUE)
a<-table.element(a,phm[3])
a<-table.row.end(a)
a<-table.end(a)
table.save(a,file='mytable1.tab')
a<-table.start()
a<-table.row.start(a)
a<-table.element(a,'Fit of Logistic Regression',4,TRUE)
a<-table.row.end(a)
a<-table.row.start(a)
a<-table.element(a,'Index',1,TRUE)
a<-table.element(a,'Actual',1,TRUE)
a<-table.element(a,'Fitted',1,TRUE)
a<-table.element(a,'Error',1,TRUE)
a<-table.row.end(a)
for (i in 1:length(r$fitted.values)) {
a<-table.row.start(a)
a<-table.element(a,i,1,TRUE)
a<-table.element(a,y[1,i])
a<-table.element(a,r$fitted.values[i])
a<-table.element(a,y[1,i]-r$fitted.values[i])
a<-table.row.end(a)
}
a<-table.end(a)
table.save(a,file='mytable2.tab')
a<-table.start()
a<-table.row.start(a)
a<-table.element(a,'Type I & II errors for various threshold values',3,TRUE)
a<-table.row.end(a)
a<-table.row.start(a)
a<-table.element(a,'Threshold',1,TRUE)
a<-table.element(a,'Type I',1,TRUE)
a<-table.element(a,'Type II',1,TRUE)
a<-table.row.end(a)
for (i in 1:99) {
a<-table.row.start(a)
a<-table.element(a,i/100,1,TRUE)
a<-table.element(a,te[1,i])
a<-table.element(a,te[2,i])
a<-table.row.end(a)
}
a<-table.end(a)
table.save(a,file='mytable3.tab')