| Multiple Linear Regression - Estimated Regression Equation |
| -25[t] = + 130.75 + 0.849999999999999M1[t] -10.3500000000000M2[t] -17.75M3[t] -18.5M4[t] -17.7500000000000M5[t] -21M6[t] -25.5M7[t] -28.5M8[t] -36.2500M9[t] -34.5M10[t] -5.50000000000001M11[t] + e[t] |
| Multiple Linear Regression - Ordinary Least Squares | |||||
| Variable | Parameter | S.D. | T-STAT H0: parameter = 0 | 2-tail p-value | 1-tail p-value |
| (Intercept) | 130.75 | 4.15541 | 31.465 | 0 | 0 |
| M1 | 0.849999999999999 | 5.575068 | 0.1525 | 0.879627 | 0.439814 |
| M2 | -10.3500000000000 | 5.575068 | -1.8565 | 0.071151 | 0.035575 |
| M3 | -17.75 | 5.876638 | -3.0204 | 0.004496 | 0.002248 |
| M4 | -18.5 | 5.876638 | -3.1481 | 0.003194 | 0.001597 |
| M5 | -17.7500000000000 | 5.876638 | -3.0204 | 0.004496 | 0.002248 |
| M6 | -21 | 5.876638 | -3.5735 | 0.000978 | 0.000489 |
| M7 | -25.5 | 5.876638 | -4.3392 | 0.000102 | 5.1e-05 |
| M8 | -28.5 | 5.876638 | -4.8497 | 2.1e-05 | 1.1e-05 |
| M9 | -36.2500 | 5.876638 | -6.1685 | 0 | 0 |
| M10 | -34.5 | 5.876638 | -5.8707 | 1e-06 | 0 |
| M11 | -5.50000000000001 | 5.876638 | -0.9359 | 0.35523 | 0.177615 |
| Multiple Linear Regression - Regression Statistics | |
| Multiple R | 0.854381746061913 |
| R-squared | 0.729968168003803 |
| Adjusted R-squared | 0.651801058741746 |
| F-TEST (value) | 9.3385590806047 |
| F-TEST (DF numerator) | 11 |
| F-TEST (DF denominator) | 38 |
| p-value | 8.22244993203824e-08 |
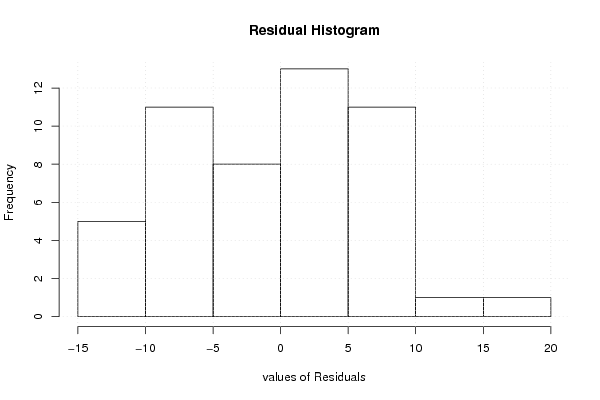
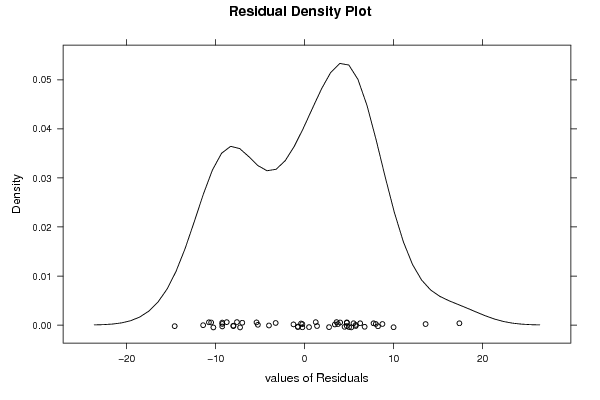
| Multiple Linear Regression - Residual Statistics | |
| Residual Standard Deviation | 8.31082046744515 |
| Sum Squared Residuals | 2624.65000000000 |
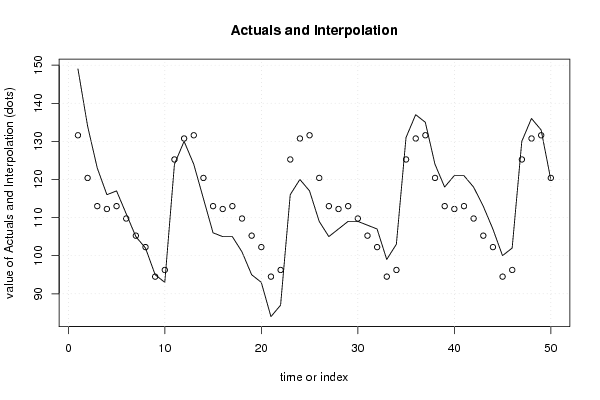
| Multiple Linear Regression - Actuals, Interpolation, and Residuals | |||
| Time or Index | Actuals | Interpolation Forecast | Residuals Prediction Error |
| 1 | 149 | 131.6 | 17.4000000000000 |
| 2 | 134 | 120.4 | 13.6000000000000 |
| 3 | 123 | 113 | 10 |
| 4 | 116 | 112.25 | 3.74999999999998 |
| 5 | 117 | 113 | 3.99999999999997 |
| 6 | 111 | 109.75 | 1.25000000000003 |
| 7 | 105 | 105.25 | -0.249999999999993 |
| 8 | 102 | 102.25 | -0.249999999999989 |
| 9 | 95 | 94.5 | 0.499999999999975 |
| 10 | 93 | 96.25 | -3.24999999999998 |
| 11 | 124 | 125.25 | -1.25000000000001 |
| 12 | 130 | 130.75 | -0.750000000000004 |
| 13 | 124 | 131.6 | -7.59999999999999 |
| 14 | 115 | 120.4 | -5.39999999999999 |
| 15 | 106 | 113 | -7 |
| 16 | 105 | 112.25 | -7.24999999999999 |
| 17 | 105 | 113 | -8 |
| 18 | 101 | 109.75 | -8.75000000000001 |
| 19 | 95 | 105.25 | -10.25 |
| 20 | 93 | 102.25 | -9.25 |
| 21 | 84 | 94.5 | -10.5000000000000 |
| 22 | 87 | 96.25 | -9.25 |
| 23 | 116 | 125.25 | -9.25 |
| 24 | 120 | 130.75 | -10.7500000000000 |
| 25 | 117 | 131.6 | -14.6 |
| 26 | 109 | 120.4 | -11.4 |
| 27 | 105 | 113 | -8 |
| 28 | 107 | 112.25 | -5.24999999999999 |
| 29 | 109 | 113 | -3.99999999999999 |
| 30 | 109 | 109.75 | -0.750000000000009 |
| 31 | 108 | 105.25 | 2.75 |
| 32 | 107 | 102.25 | 4.75 |
| 33 | 99 | 94.5 | 4.50000000000001 |
| 34 | 103 | 96.25 | 6.74999999999999 |
| 35 | 131 | 125.25 | 5.75 |
| 36 | 137 | 130.75 | 6.25 |
| 37 | 135 | 131.6 | 3.40000000000001 |
| 38 | 124 | 120.4 | 3.60000000000001 |
| 39 | 118 | 113 | 5 |
| 40 | 121 | 112.25 | 8.75 |
| 41 | 121 | 113 | 8.00000000000001 |
| 42 | 118 | 109.75 | 8.25 |
| 43 | 113 | 105.25 | 7.75 |
| 44 | 107 | 102.25 | 4.75 |
| 45 | 100 | 94.5 | 5.50000000000001 |
| 46 | 102 | 96.25 | 5.74999999999999 |
| 47 | 130 | 125.25 | 4.75 |
| 48 | 136 | 130.75 | 5.25 |
| 49 | 133 | 131.6 | 1.40000000000001 |
| 50 | 120 | 120.4 | -0.399999999999992 |
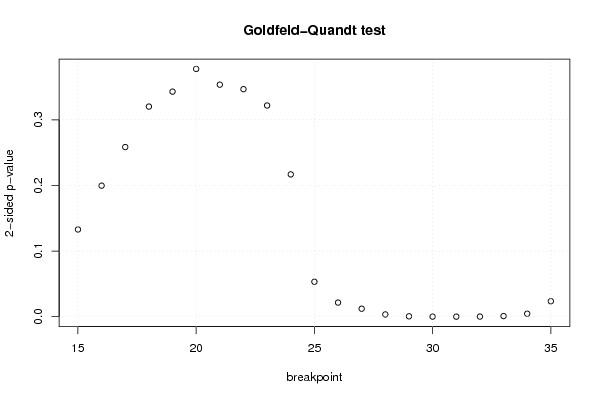
| Goldfeld-Quandt test for Heteroskedasticity | |||
| p-values | Alternative Hypothesis | ||
| breakpoint index | greater | 2-sided | less |
| 15 | 0.933580489295275 | 0.132839021409449 | 0.0664195107047246 |
| 16 | 0.900203685480256 | 0.199592629039488 | 0.0997963145197438 |
| 17 | 0.87081374589031 | 0.258372508219379 | 0.129186254109690 |
| 18 | 0.839952047915267 | 0.320095904169465 | 0.160047952084733 |
| 19 | 0.828577718162307 | 0.342844563675385 | 0.171422281837693 |
| 20 | 0.811280635923186 | 0.377438728153629 | 0.188719364076814 |
| 21 | 0.823258949784569 | 0.353482100430862 | 0.176741050215431 |
| 22 | 0.826679388163797 | 0.346641223672405 | 0.173320611836202 |
| 23 | 0.839128794200305 | 0.321742411599389 | 0.160871205799695 |
| 24 | 0.891614511568641 | 0.216770976862718 | 0.108385488431359 |
| 25 | 0.97339483888869 | 0.0532103222226203 | 0.0266051611113102 |
| 26 | 0.98927539047292 | 0.0214492190541610 | 0.0107246095270805 |
| 27 | 0.993954653730276 | 0.0120906925394488 | 0.00604534626972441 |
| 28 | 0.99829525476385 | 0.00340949047229817 | 0.00170474523614908 |
| 29 | 0.99973665876129 | 0.000526682477419352 | 0.000263341238709676 |
| 30 | 0.999974487413131 | 5.10251737383911e-05 | 2.55125868691955e-05 |
| 31 | 0.999988412167878 | 2.31756642438758e-05 | 1.15878321219379e-05 |
| 32 | 0.99992313179195 | 0.000153736416100947 | 7.68682080504737e-05 |
| 33 | 0.999565830899065 | 0.000868338201869905 | 0.000434169100934952 |
| 34 | 0.997753313452828 | 0.00449337309434398 | 0.00224668654717199 |
| 35 | 0.988244192041298 | 0.0235116159174033 | 0.0117558079587016 |
| Meta Analysis of Goldfeld-Quandt test for Heteroskedasticity | |||
| Description | # significant tests | % significant tests | OK/NOK |
| 1% type I error level | 7 | 0.333333333333333 | NOK |
| 5% type I error level | 10 | 0.476190476190476 | NOK |
| 10% type I error level | 11 | 0.523809523809524 | NOK |