| Multiple Linear Regression - Estimated Regression Equation |
| CVI[t] = + 0.112887779893211 + 26.0887388895069Maand[t] + 0.250165293372729Econ.Sit.[t] -0.253625189537363Werkloos[t] + 0.283963060245982Fin.Sit.[t] + 0.221586511866371`Spaarverm. `[t] -0.00248839513129872t + e[t] |
| Multiple Linear Regression - Ordinary Least Squares | |||||
| Variable | Parameter | S.D. | T-STAT H0: parameter = 0 | 2-tail p-value | 1-tail p-value |
| (Intercept) | 0.112887779893211 | 0.130251 | 0.8667 | 0.389943 | 0.194971 |
| Maand | 26.0887388895069 | 10.273489 | 2.5394 | 0.014016 | 0.007008 |
| Econ.Sit. | 0.250165293372729 | 0.009522 | 26.2726 | 0 | 0 |
| Werkloos | -0.253625189537363 | 0.001967 | -128.9521 | 0 | 0 |
| Fin.Sit. | 0.283963060245982 | 0.039338 | 7.2185 | 0 | 0 |
| `Spaarverm. ` | 0.221586511866371 | 0.014498 | 15.2841 | 0 | 0 |
| t | -0.00248839513129872 | 0.004826 | -0.5156 | 0.608216 | 0.304108 |
| Multiple Linear Regression - Regression Statistics | |
| Multiple R | 0.999268451452004 |
| R-squared | 0.998537438067286 |
| Adjusted R-squared | 0.998374931185873 |
| F-TEST (value) | 6144.58556700532 |
| F-TEST (DF numerator) | 6 |
| F-TEST (DF denominator) | 54 |
| p-value | 0 |
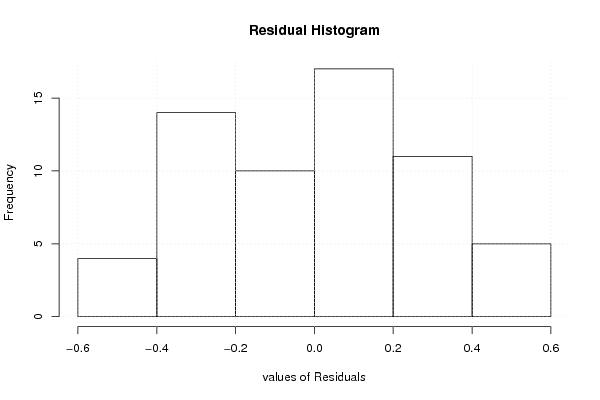
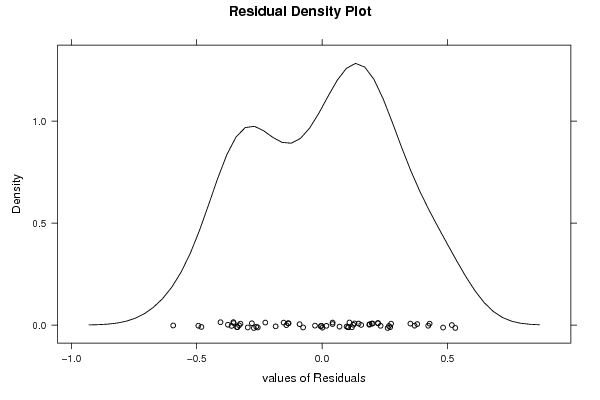
| Multiple Linear Regression - Residual Statistics | |
| Residual Standard Deviation | 0.298237209437717 |
| Sum Squared Residuals | 4.80305338703263 |
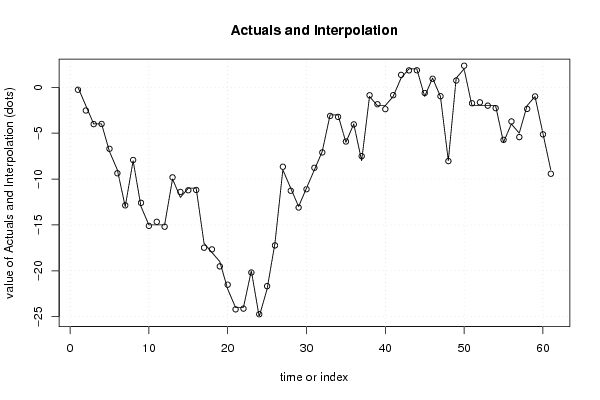
| Multiple Linear Regression - Actuals, Interpolation, and Residuals | |||
| Time or Index | Actuals | Interpolation Forecast | Residuals Prediction Error |
| 1 | 0 | -0.267062738471258 | 0.267062738471258 |
| 2 | -2 | -2.53174136234659 | 0.531741362346592 |
| 3 | -4 | -4.01751205961998 | 0.0175120596199833 |
| 4 | -4 | -3.99477081435981 | -0.00522918564018951 |
| 5 | -7 | -6.70379337870002 | -0.29620662129998 |
| 6 | -9 | -9.36933185401417 | 0.369331854014165 |
| 7 | -13 | -12.8646374522423 | -0.135362547757653 |
| 8 | -8 | -7.92472151129115 | -0.0752784887088516 |
| 9 | -13 | -12.5951221585565 | -0.404877841443459 |
| 10 | -15 | -15.1045284266713 | 0.104528426671263 |
| 11 | -15 | -14.6630201953003 | -0.336979804699709 |
| 12 | -15 | -15.1987541809688 | 0.198754180968771 |
| 13 | -10 | -9.81512895108416 | -0.184871048915843 |
| 14 | -12 | -11.4064250320034 | -0.593574967996582 |
| 15 | -11 | -11.2233136165341 | 0.223313616534104 |
| 16 | -11 | -11.1901891832542 | 0.190189183254206 |
| 17 | -17 | -17.4829573967792 | 0.482957396779183 |
| 18 | -18 | -17.6692156178298 | -0.330784382170161 |
| 19 | -19 | -19.5180092292789 | 0.518009229278944 |
| 20 | -22 | -21.5188361257189 | -0.481163874281108 |
| 21 | -24 | -24.2018924051051 | 0.201892405105070 |
| 22 | -24 | -24.1246687535851 | 0.124668753585052 |
| 23 | -20 | -20.1885559882424 | 0.188555988242437 |
| 24 | -25 | -24.7376144947333 | -0.262385505266719 |
| 25 | -22 | -21.6747723150419 | -0.325227684958059 |
| 26 | -17 | -17.2336185804617 | 0.233618580461749 |
| 27 | -9 | -8.66074137233554 | -0.339258627664461 |
| 28 | -11 | -11.2755545078526 | 0.275554507852613 |
| 29 | -13 | -13.1043424658444 | 0.104342465844365 |
| 30 | -11 | -11.1094218684338 | 0.109421868433836 |
| 31 | -9 | -8.7737180312451 | -0.226281968754900 |
| 32 | -7 | -7.09813115798608 | 0.0981311579860777 |
| 33 | -3 | -3.11922023479383 | 0.119220234793828 |
| 34 | -3 | -3.22326541565164 | 0.223265415651644 |
| 35 | -6 | -5.91046900338362 | -0.089530996616384 |
| 36 | -4 | -4.04187474889146 | 0.0418747488914551 |
| 37 | -8 | -7.50670720829633 | -0.493292791703674 |
| 38 | -1 | -0.866744910674749 | -0.133255089325251 |
| 39 | -2 | -1.84690322662507 | -0.153096773374927 |
| 40 | -2 | -2.37993881512127 | 0.379938815121274 |
| 41 | -1 | -0.85774135905496 | -0.142258640945040 |
| 42 | 1 | 1.35366702850198 | -0.353667028501977 |
| 43 | 2 | 1.84374807204215 | 0.156251927957854 |
| 44 | 2 | 1.85392265181642 | 0.146077348183579 |
| 45 | -1 | -0.62475164913857 | -0.37524835086143 |
| 46 | 1 | 0.930093133253654 | 0.069906866746346 |
| 47 | -1 | -0.972088642562461 | -0.0279113574375386 |
| 48 | -8 | -8.04219359755118 | 0.0421935975511818 |
| 49 | 1 | 0.738137820891522 | 0.261862179108478 |
| 50 | 2 | 2.35221991790006 | -0.352219917900064 |
| 51 | -2 | -1.7434524848397 | -0.256547515160301 |
| 52 | -2 | -1.63926210213684 | -0.360737897863158 |
| 53 | -2 | -2.00159180858946 | 0.00159180858946454 |
| 54 | -2 | -2.27193275192973 | 0.27193275192973 |
| 55 | -6 | -5.72824882259733 | -0.271751177402674 |
| 56 | -4 | -3.72026903362548 | -0.279730966374522 |
| 57 | -5 | -5.42924657659096 | 0.429246576590963 |
| 58 | -2 | -2.35262689698665 | 0.352626896986646 |
| 59 | -1 | -0.997512943741537 | -0.00248705625846306 |
| 60 | -5 | -5.12981204412866 | 0.129812044128662 |
| 61 | -9 | -9.4238311216023 | 0.423831121602302 |
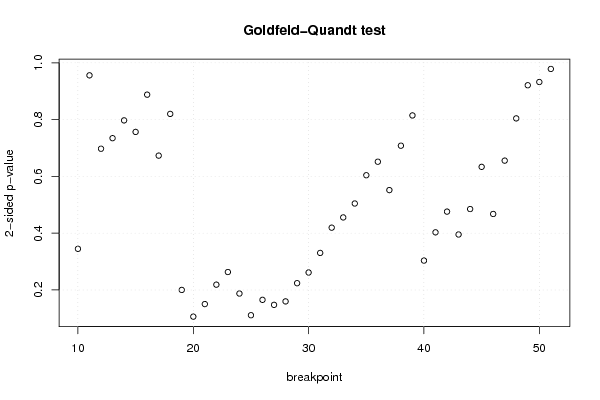
| Goldfeld-Quandt test for Heteroskedasticity | |||
| p-values | Alternative Hypothesis | ||
| breakpoint index | greater | 2-sided | less |
| 10 | 0.172391022280015 | 0.34478204456003 | 0.827608977719985 |
| 11 | 0.478033753366605 | 0.95606750673321 | 0.521966246633395 |
| 12 | 0.348732765077211 | 0.697465530154422 | 0.651267234922789 |
| 13 | 0.367347213468127 | 0.734694426936254 | 0.632652786531873 |
| 14 | 0.601320559748423 | 0.797358880503153 | 0.398679440251577 |
| 15 | 0.621659972983107 | 0.756680054033786 | 0.378340027016893 |
| 16 | 0.556044862698056 | 0.887910274603888 | 0.443955137301944 |
| 17 | 0.663398378883833 | 0.673203242232334 | 0.336601621116167 |
| 18 | 0.589909785524931 | 0.820180428950137 | 0.410090214475069 |
| 19 | 0.899976993614495 | 0.200046012771011 | 0.100023006385506 |
| 20 | 0.94704747482644 | 0.105905050347120 | 0.0529525251735599 |
| 21 | 0.924876240831386 | 0.150247518337229 | 0.0751237591686143 |
| 22 | 0.890712495242581 | 0.218575009514838 | 0.109287504757419 |
| 23 | 0.868429693130618 | 0.263140613738765 | 0.131570306869382 |
| 24 | 0.906330540613905 | 0.187338918772190 | 0.0936694593860952 |
| 25 | 0.944550971813936 | 0.110898056372129 | 0.0554490281860645 |
| 26 | 0.917443064140408 | 0.165113871719184 | 0.0825569358595918 |
| 27 | 0.926259820515012 | 0.147480358969976 | 0.0737401794849882 |
| 28 | 0.920161183242529 | 0.159677633514943 | 0.0798388167574714 |
| 29 | 0.888113919536646 | 0.223772160926708 | 0.111886080463354 |
| 30 | 0.869285131097911 | 0.261429737804178 | 0.130714868902089 |
| 31 | 0.834807369943865 | 0.330385260112271 | 0.165192630056136 |
| 32 | 0.79031783706558 | 0.419364325868838 | 0.209682162934419 |
| 33 | 0.772271210146567 | 0.455457579706866 | 0.227728789853433 |
| 34 | 0.747738514563861 | 0.504522970872278 | 0.252261485436139 |
| 35 | 0.697963669946869 | 0.604072660106261 | 0.302036330053131 |
| 36 | 0.674167503946457 | 0.651664992107086 | 0.325832496053543 |
| 37 | 0.724107370497969 | 0.551785259004062 | 0.275892629502031 |
| 38 | 0.645926565847062 | 0.708146868305876 | 0.354073434152938 |
| 39 | 0.592622663763586 | 0.814754672472829 | 0.407377336236414 |
| 40 | 0.848285424124717 | 0.303429151750565 | 0.151714575875283 |
| 41 | 0.798502926416181 | 0.402994147167638 | 0.201497073583819 |
| 42 | 0.762017169310401 | 0.475965661379198 | 0.237982830689599 |
| 43 | 0.802337056806706 | 0.395325886386588 | 0.197662943193294 |
| 44 | 0.75749825516923 | 0.485003489661542 | 0.242501744830771 |
| 45 | 0.683179884181721 | 0.633640231636559 | 0.316820115818279 |
| 46 | 0.766198284006976 | 0.467603431986048 | 0.233801715993024 |
| 47 | 0.672220975385235 | 0.65555804922953 | 0.327779024614765 |
| 48 | 0.597794302916177 | 0.804411394167647 | 0.402205697083823 |
| 49 | 0.539424648677848 | 0.921150702644305 | 0.460575351322152 |
| 50 | 0.466266428664613 | 0.932532857329227 | 0.533733571335387 |
| 51 | 0.489269816332315 | 0.97853963266463 | 0.510730183667685 |
| Meta Analysis of Goldfeld-Quandt test for Heteroskedasticity | |||
| Description | # significant tests | % significant tests | OK/NOK |
| 1% type I error level | 0 | 0 | OK |
| 5% type I error level | 0 | 0 | OK |
| 10% type I error level | 0 | 0 | OK |