| Multiple Linear Regression - Estimated Regression Equation |
| Wealth[t] = + 281385.616456098 + 9.22576570117291Costs[t] -138.707662852302Orders[t] + 0.755073191162331Dividends[t] + e[t] |
| Multiple Linear Regression - Ordinary Least Squares | |||||
| Variable | Parameter | S.D. | T-STAT H0: parameter = 0 | 2-tail p-value | 1-tail p-value |
| (Intercept) | 281385.616456098 | 39429.959907 | 7.1363 | 0 | 0 |
| Costs | 9.22576570117291 | 7.325235 | 1.2594 | 0.214087 | 0.107043 |
| Orders | -138.707662852302 | 456.693876 | -0.3037 | 0.762681 | 0.38134 |
| Dividends | 0.755073191162331 | 0.401226 | 1.8819 | 0.066048 | 0.033024 |
| Multiple Linear Regression - Regression Statistics | |
| Multiple R | 0.346675455408413 |
| R-squared | 0.120183871382630 |
| Adjusted R-squared | 0.0640253950879047 |
| F-TEST (value) | 2.14008426353829 |
| F-TEST (DF numerator) | 3 |
| F-TEST (DF denominator) | 47 |
| p-value | 0.107746189670541 |
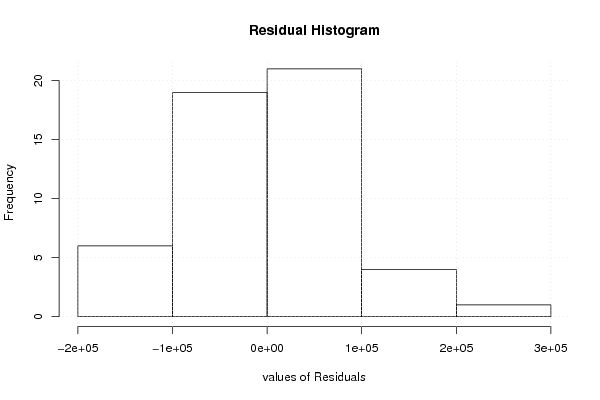
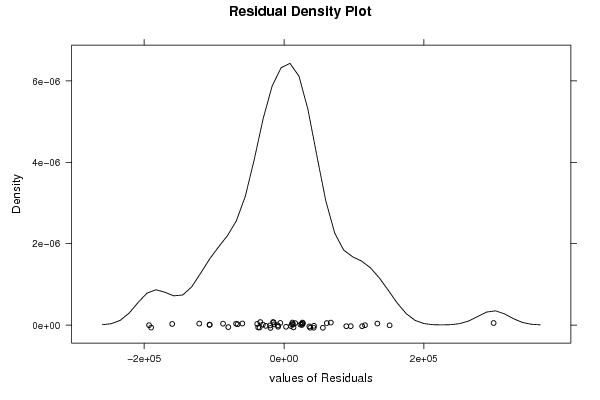
| Multiple Linear Regression - Residual Statistics | |
| Residual Standard Deviation | 88335.758374865 |
| Sum Squared Residuals | 366750691760.139 |
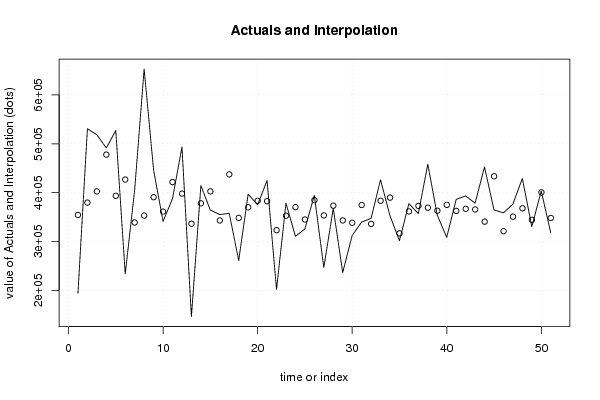
| Multiple Linear Regression - Actuals, Interpolation, and Residuals | |||
| Time or Index | Actuals | Interpolation Forecast | Residuals Prediction Error |
| 1 | 194493 | 354460.108165008 | -159967.108165008 |
| 2 | 530670 | 379674.227940598 | 150995.772059402 |
| 3 | 518365 | 402561.210135897 | 115803.789864103 |
| 4 | 491303 | 477753.615126872 | 13549.3848731278 |
| 5 | 527021 | 393512.833720524 | 133508.166279476 |
| 6 | 233773 | 426797.061848549 | -193024.061848549 |
| 7 | 405972 | 339021.581979494 | 66950.4180205063 |
| 8 | 652925 | 353149.475502004 | 299775.524497996 |
| 9 | 446211 | 390652.964211799 | 55558.0357882009 |
| 10 | 341340 | 361288.111292187 | -19948.1112921870 |
| 11 | 387699 | 421651.925106712 | -33952.9251067117 |
| 12 | 493408 | 398007.504032598 | 95400.4959674021 |
| 13 | 146494 | 336594.486566275 | -190100.486566275 |
| 14 | 414462 | 378203.54441119 | 36258.4555888099 |
| 15 | 364304 | 402698.048664594 | -38394.0486645942 |
| 16 | 355178 | 343136.480435539 | 12041.5195644615 |
| 17 | 357760 | 437421.608797898 | -79661.608797898 |
| 18 | 261216 | 348426.793517542 | -87210.7935175415 |
| 19 | 397144 | 370049.691351199 | 27094.3086488005 |
| 20 | 374943 | 383399.623958790 | -8456.62395879042 |
| 21 | 424898 | 382541.089288242 | 42356.9107117581 |
| 22 | 202055 | 323317.547850873 | -121262.547850873 |
| 23 | 378525 | 352818.722201801 | 25706.2777981992 |
| 24 | 310768 | 370438.917012032 | -59670.9170120316 |
| 25 | 325738 | 345114.299650183 | -19376.2996501825 |
| 26 | 394510 | 384654.299217505 | 9855.70078249468 |
| 27 | 247060 | 353505.985979216 | -106445.985979216 |
| 28 | 368078 | 373357.809126287 | -5279.80912628667 |
| 29 | 236761 | 343219.444626553 | -106458.444626553 |
| 30 | 312378 | 338432.957309371 | -26054.957309371 |
| 31 | 339836 | 374726.498765112 | -34890.4987651121 |
| 32 | 347385 | 336140.524244461 | 11244.4757555388 |
| 33 | 426280 | 383435.318684884 | 42844.6813151162 |
| 34 | 352850 | 389823.31078522 | -36973.3107852198 |
| 35 | 301881 | 316734.549993876 | -14853.5499938756 |
| 36 | 377516 | 361611.938645867 | 15904.0613541332 |
| 37 | 357312 | 372971.700480295 | -15659.7004802946 |
| 38 | 458343 | 369269.505235234 | 89073.4947647661 |
| 39 | 354228 | 363061.739270887 | -8833.73927088741 |
| 40 | 308636 | 375007.761817514 | -66371.7618175136 |
| 41 | 386212 | 362707.757269402 | 23504.2427305981 |
| 42 | 393343 | 367000.896250214 | 26342.103749786 |
| 43 | 378509 | 365641.925761696 | 12867.0742383044 |
| 44 | 452469 | 340756.51495247 | 111712.485047530 |
| 45 | 364839 | 433461.360249555 | -68622.3602495552 |
| 46 | 358649 | 321184.290007713 | 37464.7099922865 |
| 47 | 376641 | 350899.995335569 | 25741.0046644309 |
| 48 | 429112 | 367966.150996534 | 61145.8490034660 |
| 49 | 330546 | 344373.337423343 | -13827.3374233429 |
| 50 | 403560 | 400670.259217577 | 2889.74078242265 |
| 51 | 317892 | 348183.695585246 | -30291.6955852465 |
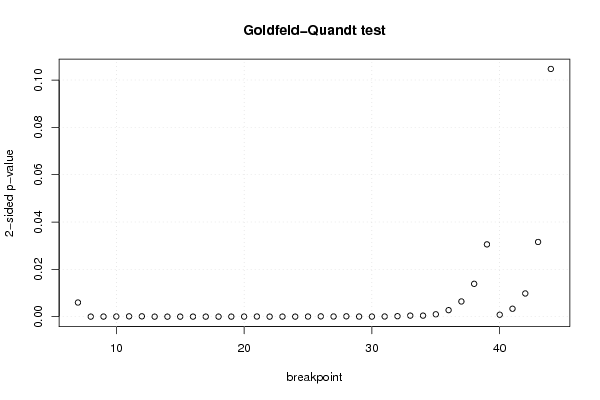
| Goldfeld-Quandt test for Heteroskedasticity | |||
| p-values | Alternative Hypothesis | ||
| breakpoint index | greater | 2-sided | less |
| 7 | 0.997014403183511 | 0.00597119363297793 | 0.00298559681648897 |
| 8 | 0.999993775048847 | 1.24499023059513e-05 | 6.22495115297566e-06 |
| 9 | 0.999985168234437 | 2.96635311260023e-05 | 1.48317655630012e-05 |
| 10 | 0.999967894567776 | 6.4210864447534e-05 | 3.2105432223767e-05 |
| 11 | 0.999934956509957 | 0.000130086980085241 | 6.50434900426207e-05 |
| 12 | 0.999929893098663 | 0.000140213802673930 | 7.01069013369652e-05 |
| 13 | 0.999999533011842 | 9.33976316914071e-07 | 4.66988158457036e-07 |
| 14 | 0.999998969354279 | 2.06129144223396e-06 | 1.03064572111698e-06 |
| 15 | 0.999997320881894 | 5.35823621150409e-06 | 2.67911810575204e-06 |
| 16 | 0.999992496947504 | 1.50061049929911e-05 | 7.50305249649556e-06 |
| 17 | 0.999997270561781 | 5.45887643803713e-06 | 2.72943821901856e-06 |
| 18 | 0.999997514266527 | 4.97146694639639e-06 | 2.48573347319819e-06 |
| 19 | 0.999993416262209 | 1.31674755824159e-05 | 6.58373779120795e-06 |
| 20 | 0.99998767406572 | 2.46518685592314e-05 | 1.23259342796157e-05 |
| 21 | 0.99996907494527 | 6.18501094599347e-05 | 3.09250547299674e-05 |
| 22 | 0.999996047608897 | 7.90478220588834e-06 | 3.95239110294417e-06 |
| 23 | 0.999991787606252 | 1.64247874955791e-05 | 8.21239374778954e-06 |
| 24 | 0.999990939233894 | 1.81215322110067e-05 | 9.06076610550336e-06 |
| 25 | 0.999975744775143 | 4.85104497149074e-05 | 2.42552248574537e-05 |
| 26 | 0.99993740724187 | 0.000125185516260524 | 6.25927581302621e-05 |
| 27 | 0.99997338292368 | 5.32341526420876e-05 | 2.66170763210438e-05 |
| 28 | 0.99992879929751 | 0.000142401404981044 | 7.12007024905222e-05 |
| 29 | 0.999980143098715 | 3.97138025707882e-05 | 1.98569012853941e-05 |
| 30 | 0.999985330531563 | 2.93389368732703e-05 | 1.46694684366351e-05 |
| 31 | 0.99996573925228 | 6.85214954388671e-05 | 3.42607477194336e-05 |
| 32 | 0.99990311896725 | 0.000193762065501712 | 9.68810327508558e-05 |
| 33 | 0.999780899596397 | 0.000438200807206086 | 0.000219100403603043 |
| 34 | 0.9997829349054 | 0.000434130189198895 | 0.000217065094599448 |
| 35 | 0.999499383642325 | 0.00100123271535058 | 0.000500616357675290 |
| 36 | 0.99862736626319 | 0.00274526747361843 | 0.00137263373680922 |
| 37 | 0.99679047322029 | 0.00641905355942069 | 0.00320952677971035 |
| 38 | 0.993063438873858 | 0.0138731222522838 | 0.00693656112614191 |
| 39 | 0.984729829877842 | 0.0305403402443167 | 0.0152701701221583 |
| 40 | 0.99959273378154 | 0.00081453243692044 | 0.00040726621846022 |
| 41 | 0.998327743049988 | 0.00334451390002361 | 0.00167225695001181 |
| 42 | 0.99509839635481 | 0.0098032072903816 | 0.0049016036451908 |
| 43 | 0.984219865255467 | 0.0315602694890658 | 0.0157801347445329 |
| 44 | 0.947661516276428 | 0.104676967447145 | 0.0523384837235724 |
| Meta Analysis of Goldfeld-Quandt test for Heteroskedasticity | |||
| Description | # significant tests | % significant tests | OK/NOK |
| 1% type I error level | 34 | 0.894736842105263 | NOK |
| 5% type I error level | 37 | 0.973684210526316 | NOK |
| 10% type I error level | 37 | 0.973684210526316 | NOK |