Free Statistics

of Irreproducible Research!

Author's title

Author*The author of this computation has been verified*
R Software Modulerwasp_multipleregression.wasp
Title produced by softwareMultiple Regression
Date of computationTue, 30 Nov 2010 13:02:25 +0000
Cite this page as followsStatistical Computations at FreeStatistics.org, Office for Research Development and Education, URL https://freestatistics.org/blog/index.php?v=date/2010/Nov/30/t1291122381039j728zuhw8wg8.htm/, Retrieved Mon, 29 Apr 2024 16:33:19 +0000
Statistical Computations at FreeStatistics.org, Office for Research Development and Education, URL https://freestatistics.org/blog/index.php?pk=103375, Retrieved Mon, 29 Apr 2024 16:33:19 +0000
QR Codes:

Original text written by user:
IsPrivate?No (this computation is public)
User-defined keywords
Estimated Impact110
Family? (F = Feedback message, R = changed R code, M = changed R Module, P = changed Parameters, D = changed Data)
-     [Multiple Regression] [Competence to learn] [2010-11-17 07:43:53] [b98453cac15ba1066b407e146608df68]
-   PD    [Multiple Regression] [mini tutorial mul...] [2010-11-30 13:02:25] [36a5183bc8f6439b2481209b0fbe6bda] [Current]
-   PD      [Multiple Regression] [mini tutorial mul...] [2010-11-30 13:18:26] [1df589bc3feb749f1946d8c1ee38b85f]
Feedback Forum

Post a new message
Dataseries X:
2284	33	41	76403	194493
3160	108	90	108094	530670
4150	150	136	134759	518365
7285	115	97	188873	491303
1134	162	63	146216	527021
4658	158	114	156608	233773
2384	97	77	61348	405972
3748	9	6	50350	652925
5371	66	47	87720	446211
1285	107	51	99489	341340
9327	101	85	87419	387699
5565	47	43	94355	493408
1528	38	32	60326	146494
3122	34	25	94670	414462
7561	87	77	82425	364304
2675	79	54	59017	355178
13253	947	251	90829	357760
880	74	15	80791	261216
2053	53	44	100423	397144
1424	94	73	131116	374943
4036	63	85	100269	424898
3045	58	49	27330	202055
5119	49	38	39039	378525
1431	34	35	106885	310768
554	11	9	79285	325738
1975	35	34	118881	394510
1765	20	20	77623	247060
1012	47	29	114768	368078
810	43	11	74015	236761
1280	117	52	69465	312378
666	171	13	117869	339836
1380	26	29	60982	347385
4677	75	66	90131	426280
876	59	33	138971	352850
814	18	15	39625	301881
514	15	15	102725	377516
5692	72	68	64239	357312
3642	86	100	90262	458343
540	14	13	103960	354228
2099	64	45	106611	308636
567	11	14	103345	386212
2001	52	36	95551	393343
2949	41	40	82903	378509
2253	99	68	63593	452469
6533	75	29	126910	364839
1889	45	43	37527	358649
3055	43	30	60247	376641
272	8	9	112995	429112
1414	198	22	70184	330546
2564	22	19	130140	403560
1383	11	9	73221	317892


Summary of computational transaction
Raw Inputview raw input (R code)
Raw Outputview raw output of R engine
Computing time6 seconds
R Server'Gwilym Jenkins' @ 72.249.127.135

\begin{tabular}{lllllllll}
\hline
Summary of computational transaction \tabularnewline
Raw Input & view raw input (R code)  \tabularnewline
Raw Output & view raw output of R engine  \tabularnewline
Computing time & 6 seconds \tabularnewline
R Server & 'Gwilym Jenkins' @ 72.249.127.135 \tabularnewline
\hline
\end{tabular}
%Source: https://freestatistics.org/blog/index.php?pk=103375&T=0

[TABLE]
[ROW][C]Summary of computational transaction[/C][/ROW]
[ROW][C]Raw Input[/C][C]view raw input (R code) [/C][/ROW]
[ROW][C]Raw Output[/C][C]view raw output of R engine [/C][/ROW]
[ROW][C]Computing time[/C][C]6 seconds[/C][/ROW]
[ROW][C]R Server[/C][C]'Gwilym Jenkins' @ 72.249.127.135[/C][/ROW]
[/TABLE]
Source: https://freestatistics.org/blog/index.php?pk=103375&T=0

Globally Unique Identifier (entire table): ba.freestatistics.org/blog/index.php?pk=103375&T=0

As an alternative you can also use a QR Code:  

The GUIDs for individual cells are displayed in the table below:

Summary of computational transaction
Raw Inputview raw input (R code)
Raw Outputview raw output of R engine
Computing time6 seconds
R Server'Gwilym Jenkins' @ 72.249.127.135


Multiple Linear Regression - Estimated Regression Equation
Wealth[t] = + 277356.379214211 + 9.68627414559874Costs[t] -215.764818638136Trades[t] + 397.451574439388Orders[t] + 0.693364216186951Dividends[t] + e[t]

\begin{tabular}{lllllllll}
\hline
Multiple Linear Regression - Estimated Regression Equation \tabularnewline
Wealth[t] =  +  277356.379214211 +  9.68627414559874Costs[t] -215.764818638136Trades[t] +  397.451574439388Orders[t] +  0.693364216186951Dividends[t]  + e[t] \tabularnewline
\hline
\end{tabular}
%Source: https://freestatistics.org/blog/index.php?pk=103375&T=1

[TABLE]
[ROW][C]Multiple Linear Regression - Estimated Regression Equation[/C][/ROW]
[ROW][C]Wealth[t] =  +  277356.379214211 +  9.68627414559874Costs[t] -215.764818638136Trades[t] +  397.451574439388Orders[t] +  0.693364216186951Dividends[t]  + e[t][/C][/ROW]
[/TABLE]
Source: https://freestatistics.org/blog/index.php?pk=103375&T=1

Globally Unique Identifier (entire table): ba.freestatistics.org/blog/index.php?pk=103375&T=1

As an alternative you can also use a QR Code:  

The GUIDs for individual cells are displayed in the table below:

Multiple Linear Regression - Estimated Regression Equation
Wealth[t] = + 277356.379214211 + 9.68627414559874Costs[t] -215.764818638136Trades[t] + 397.451574439388Orders[t] + 0.693364216186951Dividends[t] + e[t]


Multiple Linear Regression - Ordinary Least Squares
VariableParameterS.D.T-STATH0: parameter = 02-tail p-value1-tail p-value
(Intercept)277356.37921421139187.2961177.077700
Costs9.686274145598747.2672581.33290.189140.09457
Trades-215.764818638136158.358849-1.36250.1796720.089836
Orders397.451574439388599.738890.66270.5108250.255412
Dividends0.6933642161869510.4001911.73260.089870.044935

\begin{tabular}{lllllllll}
\hline
Multiple Linear Regression - Ordinary Least Squares \tabularnewline
Variable & Parameter & S.D. & T-STATH0: parameter = 0 & 2-tail p-value & 1-tail p-value \tabularnewline
(Intercept) & 277356.379214211 & 39187.296117 & 7.0777 & 0 & 0 \tabularnewline
Costs & 9.68627414559874 & 7.267258 & 1.3329 & 0.18914 & 0.09457 \tabularnewline
Trades & -215.764818638136 & 158.358849 & -1.3625 & 0.179672 & 0.089836 \tabularnewline
Orders & 397.451574439388 & 599.73889 & 0.6627 & 0.510825 & 0.255412 \tabularnewline
Dividends & 0.693364216186951 & 0.400191 & 1.7326 & 0.08987 & 0.044935 \tabularnewline
\hline
\end{tabular}
%Source: https://freestatistics.org/blog/index.php?pk=103375&T=2

[TABLE]
[ROW][C]Multiple Linear Regression - Ordinary Least Squares[/C][/ROW]
[ROW][C]Variable[/C][C]Parameter[/C][C]S.D.[/C][C]T-STATH0: parameter = 0[/C][C]2-tail p-value[/C][C]1-tail p-value[/C][/ROW]
[ROW][C](Intercept)[/C][C]277356.379214211[/C][C]39187.296117[/C][C]7.0777[/C][C]0[/C][C]0[/C][/ROW]
[ROW][C]Costs[/C][C]9.68627414559874[/C][C]7.267258[/C][C]1.3329[/C][C]0.18914[/C][C]0.09457[/C][/ROW]
[ROW][C]Trades[/C][C]-215.764818638136[/C][C]158.358849[/C][C]-1.3625[/C][C]0.179672[/C][C]0.089836[/C][/ROW]
[ROW][C]Orders[/C][C]397.451574439388[/C][C]599.73889[/C][C]0.6627[/C][C]0.510825[/C][C]0.255412[/C][/ROW]
[ROW][C]Dividends[/C][C]0.693364216186951[/C][C]0.400191[/C][C]1.7326[/C][C]0.08987[/C][C]0.044935[/C][/ROW]
[/TABLE]
Source: https://freestatistics.org/blog/index.php?pk=103375&T=2

Globally Unique Identifier (entire table): ba.freestatistics.org/blog/index.php?pk=103375&T=2

As an alternative you can also use a QR Code:  

The GUIDs for individual cells are displayed in the table below:

Multiple Linear Regression - Ordinary Least Squares
VariableParameterS.D.T-STATH0: parameter = 02-tail p-value1-tail p-value
(Intercept)277356.37921421139187.2961177.077700
Costs9.686274145598747.2672581.33290.189140.09457
Trades-215.764818638136158.358849-1.36250.1796720.089836
Orders397.451574439388599.738890.66270.5108250.255412
Dividends0.6933642161869510.4001911.73260.089870.044935


Multiple Linear Regression - Regression Statistics
Multiple R0.392827243240654
R-squared0.154313243032052
Adjusted R-squared0.080775264165274
F-TEST (value)2.09841561340171
F-TEST (DF numerator)4
F-TEST (DF denominator)46
p-value0.0963284682016443
Multiple Linear Regression - Residual Statistics
Residual Standard Deviation87541.7774609282
Sum Squared Residuals352523888846.859

\begin{tabular}{lllllllll}
\hline
Multiple Linear Regression - Regression Statistics \tabularnewline
Multiple R & 0.392827243240654 \tabularnewline
R-squared & 0.154313243032052 \tabularnewline
Adjusted R-squared & 0.080775264165274 \tabularnewline
F-TEST (value) & 2.09841561340171 \tabularnewline
F-TEST (DF numerator) & 4 \tabularnewline
F-TEST (DF denominator) & 46 \tabularnewline
p-value & 0.0963284682016443 \tabularnewline
Multiple Linear Regression - Residual Statistics \tabularnewline
Residual Standard Deviation & 87541.7774609282 \tabularnewline
Sum Squared Residuals & 352523888846.859 \tabularnewline
\hline
\end{tabular}
%Source: https://freestatistics.org/blog/index.php?pk=103375&T=3

[TABLE]
[ROW][C]Multiple Linear Regression - Regression Statistics[/C][/ROW]
[ROW][C]Multiple R[/C][C]0.392827243240654[/C][/ROW]
[ROW][C]R-squared[/C][C]0.154313243032052[/C][/ROW]
[ROW][C]Adjusted R-squared[/C][C]0.080775264165274[/C][/ROW]
[ROW][C]F-TEST (value)[/C][C]2.09841561340171[/C][/ROW]
[ROW][C]F-TEST (DF numerator)[/C][C]4[/C][/ROW]
[ROW][C]F-TEST (DF denominator)[/C][C]46[/C][/ROW]
[ROW][C]p-value[/C][C]0.0963284682016443[/C][/ROW]
[ROW][C]Multiple Linear Regression - Residual Statistics[/C][/ROW]
[ROW][C]Residual Standard Deviation[/C][C]87541.7774609282[/C][/ROW]
[ROW][C]Sum Squared Residuals[/C][C]352523888846.859[/C][/ROW]
[/TABLE]
Source: https://freestatistics.org/blog/index.php?pk=103375&T=3

Globally Unique Identifier (entire table): ba.freestatistics.org/blog/index.php?pk=103375&T=3

As an alternative you can also use a QR Code:  

The GUIDs for individual cells are displayed in the table below:

Multiple Linear Regression - Regression Statistics
Multiple R0.392827243240654
R-squared0.154313243032052
Adjusted R-squared0.080775264165274
F-TEST (value)2.09841561340171
F-TEST (DF numerator)4
F-TEST (DF denominator)46
p-value0.0963284682016443
Multiple Linear Regression - Residual Statistics
Residual Standard Deviation87541.7774609282
Sum Squared Residuals352523888846.859


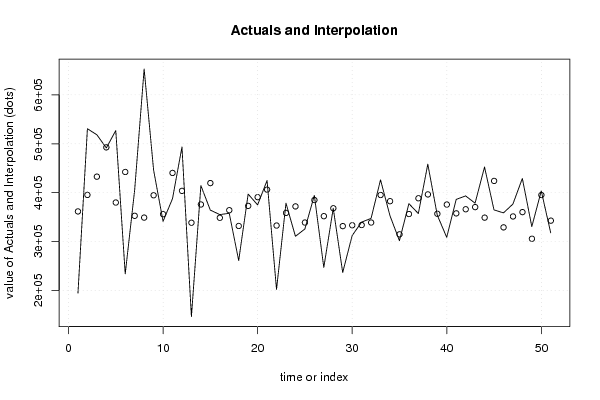
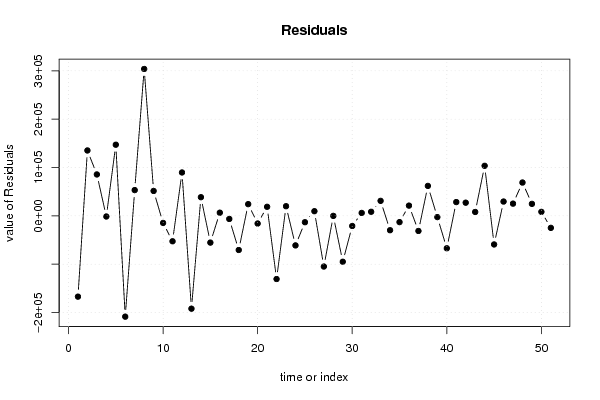
Multiple Linear Regression - Actuals, Interpolation, and Residuals
Time or IndexActualsInterpolationForecastResidualsPrediction Error
1194493361630.211109046-167137.211109046
2530670395381.558385441135288.441614559
3518365432680.17665561985684.8233443808
4491303492618.514546011-1315.51454601063
5527021379807.104899615147213.895100385
6233773442280.06549428-208507.065494281
7405972352659.54853588953312.451464111
8652925349014.249075821303910.750924179
9446211394643.01266267551567.9873373248
10341340355968.548697657-14628.548697657
11387699440304.601729954-52605.6017299535
12493408403632.34667768989775.6533223111
13146494338504.283088191-192010.283088191
14414462375838.00297047738623.9970295232
15364304419577.075558607-55273.0755586073
16355178348604.4028477076573.59715229306
17357760364137.210791847-6377.21079184654
18261216331893.065889666-70677.0658896664
19397144372924.34860477924219.6513952209
20374943390792.848149202-15849.8481492023
21424898406163.31851184218734.6814881579
22202055332761.495682466-130706.495682466
23378525358539.34591668119985.6540833188
24310768371902.473035387-61134.4730353869
25325738338899.60813619-13161.6081361900
26394510384876.1869148949633.81308510628
27247060351907.398750297-104847.398750297
28368078368120.062195651-42.0621956506366
29236761331615.693850616-94854.6938506164
30312378333342.35348819-20964.35348819
31339836333804.671073516031.32892648994
32347385338922.3845408008462.61545919952
33426280395202.13607746231077.8639225384
34352850382584.851510322-29734.8515103219
35301881314793.570316241-12912.5703162405
36377516356286.26456987221229.7354301281
37357312388523.315654525-31211.315654525
38458343396407.61357500761935.3864249929
39354228356815.274174408-2587.27417440775
40308636375684.493554661-67048.4935546614
41386212357695.13061373828516.8693862623
42393343366078.74411106827264.2558889318
43378509370454.880697548054.11930245974
44452469348938.655480924103530.344519076
45364839423975.395144575-59136.3951445753
46358649329054.63087827229594.3691217279
47376641351366.72069337225274.279306628
48429112360188.68101070868923.3189892923
49330546305738.34555226824807.6544477320
50403560395231.1591224058328.84087759478
51317892342724.968795934-24832.9687959336

\begin{tabular}{lllllllll}
\hline
Multiple Linear Regression - Actuals, Interpolation, and Residuals \tabularnewline
Time or Index & Actuals & InterpolationForecast & ResidualsPrediction Error \tabularnewline
1 & 194493 & 361630.211109046 & -167137.211109046 \tabularnewline
2 & 530670 & 395381.558385441 & 135288.441614559 \tabularnewline
3 & 518365 & 432680.176655619 & 85684.8233443808 \tabularnewline
4 & 491303 & 492618.514546011 & -1315.51454601063 \tabularnewline
5 & 527021 & 379807.104899615 & 147213.895100385 \tabularnewline
6 & 233773 & 442280.06549428 & -208507.065494281 \tabularnewline
7 & 405972 & 352659.548535889 & 53312.451464111 \tabularnewline
8 & 652925 & 349014.249075821 & 303910.750924179 \tabularnewline
9 & 446211 & 394643.012662675 & 51567.9873373248 \tabularnewline
10 & 341340 & 355968.548697657 & -14628.548697657 \tabularnewline
11 & 387699 & 440304.601729954 & -52605.6017299535 \tabularnewline
12 & 493408 & 403632.346677689 & 89775.6533223111 \tabularnewline
13 & 146494 & 338504.283088191 & -192010.283088191 \tabularnewline
14 & 414462 & 375838.002970477 & 38623.9970295232 \tabularnewline
15 & 364304 & 419577.075558607 & -55273.0755586073 \tabularnewline
16 & 355178 & 348604.402847707 & 6573.59715229306 \tabularnewline
17 & 357760 & 364137.210791847 & -6377.21079184654 \tabularnewline
18 & 261216 & 331893.065889666 & -70677.0658896664 \tabularnewline
19 & 397144 & 372924.348604779 & 24219.6513952209 \tabularnewline
20 & 374943 & 390792.848149202 & -15849.8481492023 \tabularnewline
21 & 424898 & 406163.318511842 & 18734.6814881579 \tabularnewline
22 & 202055 & 332761.495682466 & -130706.495682466 \tabularnewline
23 & 378525 & 358539.345916681 & 19985.6540833188 \tabularnewline
24 & 310768 & 371902.473035387 & -61134.4730353869 \tabularnewline
25 & 325738 & 338899.60813619 & -13161.6081361900 \tabularnewline
26 & 394510 & 384876.186914894 & 9633.81308510628 \tabularnewline
27 & 247060 & 351907.398750297 & -104847.398750297 \tabularnewline
28 & 368078 & 368120.062195651 & -42.0621956506366 \tabularnewline
29 & 236761 & 331615.693850616 & -94854.6938506164 \tabularnewline
30 & 312378 & 333342.35348819 & -20964.35348819 \tabularnewline
31 & 339836 & 333804.67107351 & 6031.32892648994 \tabularnewline
32 & 347385 & 338922.384540800 & 8462.61545919952 \tabularnewline
33 & 426280 & 395202.136077462 & 31077.8639225384 \tabularnewline
34 & 352850 & 382584.851510322 & -29734.8515103219 \tabularnewline
35 & 301881 & 314793.570316241 & -12912.5703162405 \tabularnewline
36 & 377516 & 356286.264569872 & 21229.7354301281 \tabularnewline
37 & 357312 & 388523.315654525 & -31211.315654525 \tabularnewline
38 & 458343 & 396407.613575007 & 61935.3864249929 \tabularnewline
39 & 354228 & 356815.274174408 & -2587.27417440775 \tabularnewline
40 & 308636 & 375684.493554661 & -67048.4935546614 \tabularnewline
41 & 386212 & 357695.130613738 & 28516.8693862623 \tabularnewline
42 & 393343 & 366078.744111068 & 27264.2558889318 \tabularnewline
43 & 378509 & 370454.88069754 & 8054.11930245974 \tabularnewline
44 & 452469 & 348938.655480924 & 103530.344519076 \tabularnewline
45 & 364839 & 423975.395144575 & -59136.3951445753 \tabularnewline
46 & 358649 & 329054.630878272 & 29594.3691217279 \tabularnewline
47 & 376641 & 351366.720693372 & 25274.279306628 \tabularnewline
48 & 429112 & 360188.681010708 & 68923.3189892923 \tabularnewline
49 & 330546 & 305738.345552268 & 24807.6544477320 \tabularnewline
50 & 403560 & 395231.159122405 & 8328.84087759478 \tabularnewline
51 & 317892 & 342724.968795934 & -24832.9687959336 \tabularnewline
\hline
\end{tabular}
%Source: https://freestatistics.org/blog/index.php?pk=103375&T=4

[TABLE]
[ROW][C]Multiple Linear Regression - Actuals, Interpolation, and Residuals[/C][/ROW]
[ROW][C]Time or Index[/C][C]Actuals[/C][C]InterpolationForecast[/C][C]ResidualsPrediction Error[/C][/ROW]
[ROW][C]1[/C][C]194493[/C][C]361630.211109046[/C][C]-167137.211109046[/C][/ROW]
[ROW][C]2[/C][C]530670[/C][C]395381.558385441[/C][C]135288.441614559[/C][/ROW]
[ROW][C]3[/C][C]518365[/C][C]432680.176655619[/C][C]85684.8233443808[/C][/ROW]
[ROW][C]4[/C][C]491303[/C][C]492618.514546011[/C][C]-1315.51454601063[/C][/ROW]
[ROW][C]5[/C][C]527021[/C][C]379807.104899615[/C][C]147213.895100385[/C][/ROW]
[ROW][C]6[/C][C]233773[/C][C]442280.06549428[/C][C]-208507.065494281[/C][/ROW]
[ROW][C]7[/C][C]405972[/C][C]352659.548535889[/C][C]53312.451464111[/C][/ROW]
[ROW][C]8[/C][C]652925[/C][C]349014.249075821[/C][C]303910.750924179[/C][/ROW]
[ROW][C]9[/C][C]446211[/C][C]394643.012662675[/C][C]51567.9873373248[/C][/ROW]
[ROW][C]10[/C][C]341340[/C][C]355968.548697657[/C][C]-14628.548697657[/C][/ROW]
[ROW][C]11[/C][C]387699[/C][C]440304.601729954[/C][C]-52605.6017299535[/C][/ROW]
[ROW][C]12[/C][C]493408[/C][C]403632.346677689[/C][C]89775.6533223111[/C][/ROW]
[ROW][C]13[/C][C]146494[/C][C]338504.283088191[/C][C]-192010.283088191[/C][/ROW]
[ROW][C]14[/C][C]414462[/C][C]375838.002970477[/C][C]38623.9970295232[/C][/ROW]
[ROW][C]15[/C][C]364304[/C][C]419577.075558607[/C][C]-55273.0755586073[/C][/ROW]
[ROW][C]16[/C][C]355178[/C][C]348604.402847707[/C][C]6573.59715229306[/C][/ROW]
[ROW][C]17[/C][C]357760[/C][C]364137.210791847[/C][C]-6377.21079184654[/C][/ROW]
[ROW][C]18[/C][C]261216[/C][C]331893.065889666[/C][C]-70677.0658896664[/C][/ROW]
[ROW][C]19[/C][C]397144[/C][C]372924.348604779[/C][C]24219.6513952209[/C][/ROW]
[ROW][C]20[/C][C]374943[/C][C]390792.848149202[/C][C]-15849.8481492023[/C][/ROW]
[ROW][C]21[/C][C]424898[/C][C]406163.318511842[/C][C]18734.6814881579[/C][/ROW]
[ROW][C]22[/C][C]202055[/C][C]332761.495682466[/C][C]-130706.495682466[/C][/ROW]
[ROW][C]23[/C][C]378525[/C][C]358539.345916681[/C][C]19985.6540833188[/C][/ROW]
[ROW][C]24[/C][C]310768[/C][C]371902.473035387[/C][C]-61134.4730353869[/C][/ROW]
[ROW][C]25[/C][C]325738[/C][C]338899.60813619[/C][C]-13161.6081361900[/C][/ROW]
[ROW][C]26[/C][C]394510[/C][C]384876.186914894[/C][C]9633.81308510628[/C][/ROW]
[ROW][C]27[/C][C]247060[/C][C]351907.398750297[/C][C]-104847.398750297[/C][/ROW]
[ROW][C]28[/C][C]368078[/C][C]368120.062195651[/C][C]-42.0621956506366[/C][/ROW]
[ROW][C]29[/C][C]236761[/C][C]331615.693850616[/C][C]-94854.6938506164[/C][/ROW]
[ROW][C]30[/C][C]312378[/C][C]333342.35348819[/C][C]-20964.35348819[/C][/ROW]
[ROW][C]31[/C][C]339836[/C][C]333804.67107351[/C][C]6031.32892648994[/C][/ROW]
[ROW][C]32[/C][C]347385[/C][C]338922.384540800[/C][C]8462.61545919952[/C][/ROW]
[ROW][C]33[/C][C]426280[/C][C]395202.136077462[/C][C]31077.8639225384[/C][/ROW]
[ROW][C]34[/C][C]352850[/C][C]382584.851510322[/C][C]-29734.8515103219[/C][/ROW]
[ROW][C]35[/C][C]301881[/C][C]314793.570316241[/C][C]-12912.5703162405[/C][/ROW]
[ROW][C]36[/C][C]377516[/C][C]356286.264569872[/C][C]21229.7354301281[/C][/ROW]
[ROW][C]37[/C][C]357312[/C][C]388523.315654525[/C][C]-31211.315654525[/C][/ROW]
[ROW][C]38[/C][C]458343[/C][C]396407.613575007[/C][C]61935.3864249929[/C][/ROW]
[ROW][C]39[/C][C]354228[/C][C]356815.274174408[/C][C]-2587.27417440775[/C][/ROW]
[ROW][C]40[/C][C]308636[/C][C]375684.493554661[/C][C]-67048.4935546614[/C][/ROW]
[ROW][C]41[/C][C]386212[/C][C]357695.130613738[/C][C]28516.8693862623[/C][/ROW]
[ROW][C]42[/C][C]393343[/C][C]366078.744111068[/C][C]27264.2558889318[/C][/ROW]
[ROW][C]43[/C][C]378509[/C][C]370454.88069754[/C][C]8054.11930245974[/C][/ROW]
[ROW][C]44[/C][C]452469[/C][C]348938.655480924[/C][C]103530.344519076[/C][/ROW]
[ROW][C]45[/C][C]364839[/C][C]423975.395144575[/C][C]-59136.3951445753[/C][/ROW]
[ROW][C]46[/C][C]358649[/C][C]329054.630878272[/C][C]29594.3691217279[/C][/ROW]
[ROW][C]47[/C][C]376641[/C][C]351366.720693372[/C][C]25274.279306628[/C][/ROW]
[ROW][C]48[/C][C]429112[/C][C]360188.681010708[/C][C]68923.3189892923[/C][/ROW]
[ROW][C]49[/C][C]330546[/C][C]305738.345552268[/C][C]24807.6544477320[/C][/ROW]
[ROW][C]50[/C][C]403560[/C][C]395231.159122405[/C][C]8328.84087759478[/C][/ROW]
[ROW][C]51[/C][C]317892[/C][C]342724.968795934[/C][C]-24832.9687959336[/C][/ROW]
[/TABLE]
Source: https://freestatistics.org/blog/index.php?pk=103375&T=4

Globally Unique Identifier (entire table): ba.freestatistics.org/blog/index.php?pk=103375&T=4

As an alternative you can also use a QR Code:  

The GUIDs for individual cells are displayed in the table below:

Multiple Linear Regression - Actuals, Interpolation, and Residuals
Time or IndexActualsInterpolationForecastResidualsPrediction Error
1194493361630.211109046-167137.211109046
2530670395381.558385441135288.441614559
3518365432680.17665561985684.8233443808
4491303492618.514546011-1315.51454601063
5527021379807.104899615147213.895100385
6233773442280.06549428-208507.065494281
7405972352659.54853588953312.451464111
8652925349014.249075821303910.750924179
9446211394643.01266267551567.9873373248
10341340355968.548697657-14628.548697657
11387699440304.601729954-52605.6017299535
12493408403632.34667768989775.6533223111
13146494338504.283088191-192010.283088191
14414462375838.00297047738623.9970295232
15364304419577.075558607-55273.0755586073
16355178348604.4028477076573.59715229306
17357760364137.210791847-6377.21079184654
18261216331893.065889666-70677.0658896664
19397144372924.34860477924219.6513952209
20374943390792.848149202-15849.8481492023
21424898406163.31851184218734.6814881579
22202055332761.495682466-130706.495682466
23378525358539.34591668119985.6540833188
24310768371902.473035387-61134.4730353869
25325738338899.60813619-13161.6081361900
26394510384876.1869148949633.81308510628
27247060351907.398750297-104847.398750297
28368078368120.062195651-42.0621956506366
29236761331615.693850616-94854.6938506164
30312378333342.35348819-20964.35348819
31339836333804.671073516031.32892648994
32347385338922.3845408008462.61545919952
33426280395202.13607746231077.8639225384
34352850382584.851510322-29734.8515103219
35301881314793.570316241-12912.5703162405
36377516356286.26456987221229.7354301281
37357312388523.315654525-31211.315654525
38458343396407.61357500761935.3864249929
39354228356815.274174408-2587.27417440775
40308636375684.493554661-67048.4935546614
41386212357695.13061373828516.8693862623
42393343366078.74411106827264.2558889318
43378509370454.880697548054.11930245974
44452469348938.655480924103530.344519076
45364839423975.395144575-59136.3951445753
46358649329054.63087827229594.3691217279
47376641351366.72069337225274.279306628
48429112360188.68101070868923.3189892923
49330546305738.34555226824807.6544477320
50403560395231.1591224058328.84087759478
51317892342724.968795934-24832.9687959336


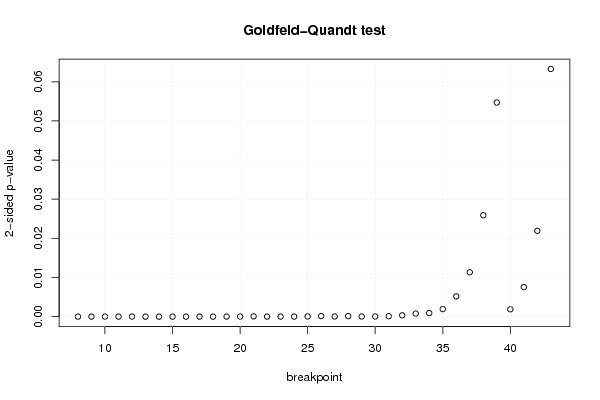
Goldfeld-Quandt test for Heteroskedasticity
p-valuesAlternative Hypothesis
breakpoint indexgreater2-sidedless
80.9999935704256121.28591487766904e-056.4295743883452e-06
90.999994076201861.18475962781424e-055.92379813907118e-06
100.9999870468918842.59062162319417e-051.29531081159708e-05
110.9999886800227132.26399545730839e-051.13199772865420e-05
120.9999860597774232.78804451542394e-051.39402225771197e-05
130.999999942243591.15512819688027e-075.77564098440133e-08
140.9999998691273922.61745215367267e-071.30872607683633e-07
150.9999997073236525.85352695286271e-072.92676347643136e-07
160.9999990556950011.88860999721066e-069.44304998605331e-07
170.9999977631885654.47362287066488e-062.23681143533244e-06
180.9999976448591254.71028174992513e-062.35514087496257e-06
190.9999935186244441.29627511124401e-056.48137555622007e-06
200.9999871997683832.56004632332140e-051.28002316166070e-05
210.9999665900756686.68198486631992e-053.34099243315996e-05
220.999995747193828.50561236124415e-064.25280618062207e-06
230.9999908289200141.83421599728057e-059.17107998640285e-06
240.9999904929639151.90140721705425e-059.50703608527126e-06
250.999973605430555.27891388995116e-052.63945694497558e-05
260.9999292274047590.0001415451904828317.07725952414156e-05
270.99997505788474.98842306005752e-052.49421153002876e-05
280.9999314959800780.0001370080398438676.85040199219335e-05
290.9999814698110383.70603779240903e-051.85301889620451e-05
300.9999801818129393.96363741228884e-051.98181870614442e-05
310.999939106974310.0001217860513806256.08930256903127e-05
320.9998315948973940.0003368102052117610.000168405102605880
330.999607834838450.0007843303230989810.000392165161549490
340.999544992230790.0009100155384186320.000455007769209316
350.9990364656794340.001927068641131880.00096353432056594
360.9974090710588280.005181857882344510.00259092894117226
370.9943300040345050.01133999193099030.00566999596549516
380.9870433840672420.02591323186551580.0129566159327579
390.9726463569962450.05470728600751030.0273536430037552
400.9990584765210620.001883046957875670.000941523478937834
410.9962261845283260.007547630943347860.00377381547167393
420.989035847548140.02192830490372010.0109641524518600
430.9683556760902080.06328864781958380.0316443239097919

\begin{tabular}{lllllllll}
\hline
Goldfeld-Quandt test for Heteroskedasticity \tabularnewline
p-values & Alternative Hypothesis \tabularnewline
breakpoint index & greater & 2-sided & less \tabularnewline
8 & 0.999993570425612 & 1.28591487766904e-05 & 6.4295743883452e-06 \tabularnewline
9 & 0.99999407620186 & 1.18475962781424e-05 & 5.92379813907118e-06 \tabularnewline
10 & 0.999987046891884 & 2.59062162319417e-05 & 1.29531081159708e-05 \tabularnewline
11 & 0.999988680022713 & 2.26399545730839e-05 & 1.13199772865420e-05 \tabularnewline
12 & 0.999986059777423 & 2.78804451542394e-05 & 1.39402225771197e-05 \tabularnewline
13 & 0.99999994224359 & 1.15512819688027e-07 & 5.77564098440133e-08 \tabularnewline
14 & 0.999999869127392 & 2.61745215367267e-07 & 1.30872607683633e-07 \tabularnewline
15 & 0.999999707323652 & 5.85352695286271e-07 & 2.92676347643136e-07 \tabularnewline
16 & 0.999999055695001 & 1.88860999721066e-06 & 9.44304998605331e-07 \tabularnewline
17 & 0.999997763188565 & 4.47362287066488e-06 & 2.23681143533244e-06 \tabularnewline
18 & 0.999997644859125 & 4.71028174992513e-06 & 2.35514087496257e-06 \tabularnewline
19 & 0.999993518624444 & 1.29627511124401e-05 & 6.48137555622007e-06 \tabularnewline
20 & 0.999987199768383 & 2.56004632332140e-05 & 1.28002316166070e-05 \tabularnewline
21 & 0.999966590075668 & 6.68198486631992e-05 & 3.34099243315996e-05 \tabularnewline
22 & 0.99999574719382 & 8.50561236124415e-06 & 4.25280618062207e-06 \tabularnewline
23 & 0.999990828920014 & 1.83421599728057e-05 & 9.17107998640285e-06 \tabularnewline
24 & 0.999990492963915 & 1.90140721705425e-05 & 9.50703608527126e-06 \tabularnewline
25 & 0.99997360543055 & 5.27891388995116e-05 & 2.63945694497558e-05 \tabularnewline
26 & 0.999929227404759 & 0.000141545190482831 & 7.07725952414156e-05 \tabularnewline
27 & 0.9999750578847 & 4.98842306005752e-05 & 2.49421153002876e-05 \tabularnewline
28 & 0.999931495980078 & 0.000137008039843867 & 6.85040199219335e-05 \tabularnewline
29 & 0.999981469811038 & 3.70603779240903e-05 & 1.85301889620451e-05 \tabularnewline
30 & 0.999980181812939 & 3.96363741228884e-05 & 1.98181870614442e-05 \tabularnewline
31 & 0.99993910697431 & 0.000121786051380625 & 6.08930256903127e-05 \tabularnewline
32 & 0.999831594897394 & 0.000336810205211761 & 0.000168405102605880 \tabularnewline
33 & 0.99960783483845 & 0.000784330323098981 & 0.000392165161549490 \tabularnewline
34 & 0.99954499223079 & 0.000910015538418632 & 0.000455007769209316 \tabularnewline
35 & 0.999036465679434 & 0.00192706864113188 & 0.00096353432056594 \tabularnewline
36 & 0.997409071058828 & 0.00518185788234451 & 0.00259092894117226 \tabularnewline
37 & 0.994330004034505 & 0.0113399919309903 & 0.00566999596549516 \tabularnewline
38 & 0.987043384067242 & 0.0259132318655158 & 0.0129566159327579 \tabularnewline
39 & 0.972646356996245 & 0.0547072860075103 & 0.0273536430037552 \tabularnewline
40 & 0.999058476521062 & 0.00188304695787567 & 0.000941523478937834 \tabularnewline
41 & 0.996226184528326 & 0.00754763094334786 & 0.00377381547167393 \tabularnewline
42 & 0.98903584754814 & 0.0219283049037201 & 0.0109641524518600 \tabularnewline
43 & 0.968355676090208 & 0.0632886478195838 & 0.0316443239097919 \tabularnewline
\hline
\end{tabular}
%Source: https://freestatistics.org/blog/index.php?pk=103375&T=5

[TABLE]
[ROW][C]Goldfeld-Quandt test for Heteroskedasticity[/C][/ROW]
[ROW][C]p-values[/C][C]Alternative Hypothesis[/C][/ROW]
[ROW][C]breakpoint index[/C][C]greater[/C][C]2-sided[/C][C]less[/C][/ROW]
[ROW][C]8[/C][C]0.999993570425612[/C][C]1.28591487766904e-05[/C][C]6.4295743883452e-06[/C][/ROW]
[ROW][C]9[/C][C]0.99999407620186[/C][C]1.18475962781424e-05[/C][C]5.92379813907118e-06[/C][/ROW]
[ROW][C]10[/C][C]0.999987046891884[/C][C]2.59062162319417e-05[/C][C]1.29531081159708e-05[/C][/ROW]
[ROW][C]11[/C][C]0.999988680022713[/C][C]2.26399545730839e-05[/C][C]1.13199772865420e-05[/C][/ROW]
[ROW][C]12[/C][C]0.999986059777423[/C][C]2.78804451542394e-05[/C][C]1.39402225771197e-05[/C][/ROW]
[ROW][C]13[/C][C]0.99999994224359[/C][C]1.15512819688027e-07[/C][C]5.77564098440133e-08[/C][/ROW]
[ROW][C]14[/C][C]0.999999869127392[/C][C]2.61745215367267e-07[/C][C]1.30872607683633e-07[/C][/ROW]
[ROW][C]15[/C][C]0.999999707323652[/C][C]5.85352695286271e-07[/C][C]2.92676347643136e-07[/C][/ROW]
[ROW][C]16[/C][C]0.999999055695001[/C][C]1.88860999721066e-06[/C][C]9.44304998605331e-07[/C][/ROW]
[ROW][C]17[/C][C]0.999997763188565[/C][C]4.47362287066488e-06[/C][C]2.23681143533244e-06[/C][/ROW]
[ROW][C]18[/C][C]0.999997644859125[/C][C]4.71028174992513e-06[/C][C]2.35514087496257e-06[/C][/ROW]
[ROW][C]19[/C][C]0.999993518624444[/C][C]1.29627511124401e-05[/C][C]6.48137555622007e-06[/C][/ROW]
[ROW][C]20[/C][C]0.999987199768383[/C][C]2.56004632332140e-05[/C][C]1.28002316166070e-05[/C][/ROW]
[ROW][C]21[/C][C]0.999966590075668[/C][C]6.68198486631992e-05[/C][C]3.34099243315996e-05[/C][/ROW]
[ROW][C]22[/C][C]0.99999574719382[/C][C]8.50561236124415e-06[/C][C]4.25280618062207e-06[/C][/ROW]
[ROW][C]23[/C][C]0.999990828920014[/C][C]1.83421599728057e-05[/C][C]9.17107998640285e-06[/C][/ROW]
[ROW][C]24[/C][C]0.999990492963915[/C][C]1.90140721705425e-05[/C][C]9.50703608527126e-06[/C][/ROW]
[ROW][C]25[/C][C]0.99997360543055[/C][C]5.27891388995116e-05[/C][C]2.63945694497558e-05[/C][/ROW]
[ROW][C]26[/C][C]0.999929227404759[/C][C]0.000141545190482831[/C][C]7.07725952414156e-05[/C][/ROW]
[ROW][C]27[/C][C]0.9999750578847[/C][C]4.98842306005752e-05[/C][C]2.49421153002876e-05[/C][/ROW]
[ROW][C]28[/C][C]0.999931495980078[/C][C]0.000137008039843867[/C][C]6.85040199219335e-05[/C][/ROW]
[ROW][C]29[/C][C]0.999981469811038[/C][C]3.70603779240903e-05[/C][C]1.85301889620451e-05[/C][/ROW]
[ROW][C]30[/C][C]0.999980181812939[/C][C]3.96363741228884e-05[/C][C]1.98181870614442e-05[/C][/ROW]
[ROW][C]31[/C][C]0.99993910697431[/C][C]0.000121786051380625[/C][C]6.08930256903127e-05[/C][/ROW]
[ROW][C]32[/C][C]0.999831594897394[/C][C]0.000336810205211761[/C][C]0.000168405102605880[/C][/ROW]
[ROW][C]33[/C][C]0.99960783483845[/C][C]0.000784330323098981[/C][C]0.000392165161549490[/C][/ROW]
[ROW][C]34[/C][C]0.99954499223079[/C][C]0.000910015538418632[/C][C]0.000455007769209316[/C][/ROW]
[ROW][C]35[/C][C]0.999036465679434[/C][C]0.00192706864113188[/C][C]0.00096353432056594[/C][/ROW]
[ROW][C]36[/C][C]0.997409071058828[/C][C]0.00518185788234451[/C][C]0.00259092894117226[/C][/ROW]
[ROW][C]37[/C][C]0.994330004034505[/C][C]0.0113399919309903[/C][C]0.00566999596549516[/C][/ROW]
[ROW][C]38[/C][C]0.987043384067242[/C][C]0.0259132318655158[/C][C]0.0129566159327579[/C][/ROW]
[ROW][C]39[/C][C]0.972646356996245[/C][C]0.0547072860075103[/C][C]0.0273536430037552[/C][/ROW]
[ROW][C]40[/C][C]0.999058476521062[/C][C]0.00188304695787567[/C][C]0.000941523478937834[/C][/ROW]
[ROW][C]41[/C][C]0.996226184528326[/C][C]0.00754763094334786[/C][C]0.00377381547167393[/C][/ROW]
[ROW][C]42[/C][C]0.98903584754814[/C][C]0.0219283049037201[/C][C]0.0109641524518600[/C][/ROW]
[ROW][C]43[/C][C]0.968355676090208[/C][C]0.0632886478195838[/C][C]0.0316443239097919[/C][/ROW]
[/TABLE]
Source: https://freestatistics.org/blog/index.php?pk=103375&T=5

Globally Unique Identifier (entire table): ba.freestatistics.org/blog/index.php?pk=103375&T=5

As an alternative you can also use a QR Code:  

The GUIDs for individual cells are displayed in the table below:

Goldfeld-Quandt test for Heteroskedasticity
p-valuesAlternative Hypothesis
breakpoint indexgreater2-sidedless
80.9999935704256121.28591487766904e-056.4295743883452e-06
90.999994076201861.18475962781424e-055.92379813907118e-06
100.9999870468918842.59062162319417e-051.29531081159708e-05
110.9999886800227132.26399545730839e-051.13199772865420e-05
120.9999860597774232.78804451542394e-051.39402225771197e-05
130.999999942243591.15512819688027e-075.77564098440133e-08
140.9999998691273922.61745215367267e-071.30872607683633e-07
150.9999997073236525.85352695286271e-072.92676347643136e-07
160.9999990556950011.88860999721066e-069.44304998605331e-07
170.9999977631885654.47362287066488e-062.23681143533244e-06
180.9999976448591254.71028174992513e-062.35514087496257e-06
190.9999935186244441.29627511124401e-056.48137555622007e-06
200.9999871997683832.56004632332140e-051.28002316166070e-05
210.9999665900756686.68198486631992e-053.34099243315996e-05
220.999995747193828.50561236124415e-064.25280618062207e-06
230.9999908289200141.83421599728057e-059.17107998640285e-06
240.9999904929639151.90140721705425e-059.50703608527126e-06
250.999973605430555.27891388995116e-052.63945694497558e-05
260.9999292274047590.0001415451904828317.07725952414156e-05
270.99997505788474.98842306005752e-052.49421153002876e-05
280.9999314959800780.0001370080398438676.85040199219335e-05
290.9999814698110383.70603779240903e-051.85301889620451e-05
300.9999801818129393.96363741228884e-051.98181870614442e-05
310.999939106974310.0001217860513806256.08930256903127e-05
320.9998315948973940.0003368102052117610.000168405102605880
330.999607834838450.0007843303230989810.000392165161549490
340.999544992230790.0009100155384186320.000455007769209316
350.9990364656794340.001927068641131880.00096353432056594
360.9974090710588280.005181857882344510.00259092894117226
370.9943300040345050.01133999193099030.00566999596549516
380.9870433840672420.02591323186551580.0129566159327579
390.9726463569962450.05470728600751030.0273536430037552
400.9990584765210620.001883046957875670.000941523478937834
410.9962261845283260.007547630943347860.00377381547167393
420.989035847548140.02192830490372010.0109641524518600
430.9683556760902080.06328864781958380.0316443239097919


Meta Analysis of Goldfeld-Quandt test for Heteroskedasticity
Description# significant tests% significant testsOK/NOK
1% type I error level310.861111111111111NOK
5% type I error level340.944444444444444NOK
10% type I error level361NOK

\begin{tabular}{lllllllll}
\hline
Meta Analysis of Goldfeld-Quandt test for Heteroskedasticity \tabularnewline
Description & # significant tests & % significant tests & OK/NOK \tabularnewline
1% type I error level & 31 & 0.861111111111111 & NOK \tabularnewline
5% type I error level & 34 & 0.944444444444444 & NOK \tabularnewline
10% type I error level & 36 & 1 & NOK \tabularnewline
\hline
\end{tabular}
%Source: https://freestatistics.org/blog/index.php?pk=103375&T=6

[TABLE]
[ROW][C]Meta Analysis of Goldfeld-Quandt test for Heteroskedasticity[/C][/ROW]
[ROW][C]Description[/C][C]# significant tests[/C][C]% significant tests[/C][C]OK/NOK[/C][/ROW]
[ROW][C]1% type I error level[/C][C]31[/C][C]0.861111111111111[/C][C]NOK[/C][/ROW]
[ROW][C]5% type I error level[/C][C]34[/C][C]0.944444444444444[/C][C]NOK[/C][/ROW]
[ROW][C]10% type I error level[/C][C]36[/C][C]1[/C][C]NOK[/C][/ROW]
[/TABLE]
Source: https://freestatistics.org/blog/index.php?pk=103375&T=6

Globally Unique Identifier (entire table): ba.freestatistics.org/blog/index.php?pk=103375&T=6

As an alternative you can also use a QR Code:  

The GUIDs for individual cells are displayed in the table below:

Meta Analysis of Goldfeld-Quandt test for Heteroskedasticity
Description# significant tests% significant testsOK/NOK
1% type I error level310.861111111111111NOK
5% type I error level340.944444444444444NOK
10% type I error level361NOK


Parameters (Session):
par1 = 5 ; par2 = Do not include Seasonal Dummies ; par3 = No Linear Trend ;
Parameters (R input):
par1 = 5 ; par2 = Do not include Seasonal Dummies ; par3 = No Linear Trend ;
R code (references can be found in the software module):
library(lattice)
library(lmtest)
n25 <- 25 #minimum number of obs. for Goldfeld-Quandt test
par1 <- as.numeric(par1)
x <- t(y)
k <- length(x[1,])
n <- length(x[,1])
x1 <- cbind(x[,par1], x[,1:k!=par1])
mycolnames <- c(colnames(x)[par1], colnames(x)[1:k!=par1])
colnames(x1) <- mycolnames #colnames(x)[par1]
x <- x1
if (par3 == 'First Differences'){
x2 <- array(0, dim=c(n-1,k), dimnames=list(1:(n-1), paste('(1-B)',colnames(x),sep='')))
for (i in 1:n-1) {
for (j in 1:k) {
x2[i,j] <- x[i+1,j] - x[i,j]
}
}
x <- x2
}
if (par2 == 'Include Monthly Dummies'){
x2 <- array(0, dim=c(n,11), dimnames=list(1:n, paste('M', seq(1:11), sep ='')))
for (i in 1:11){
x2[seq(i,n,12),i] <- 1
}
x <- cbind(x, x2)
}
if (par2 == 'Include Quarterly Dummies'){
x2 <- array(0, dim=c(n,3), dimnames=list(1:n, paste('Q', seq(1:3), sep ='')))
for (i in 1:3){
x2[seq(i,n,4),i] <- 1
}
x <- cbind(x, x2)
}
k <- length(x[1,])
if (par3 == 'Linear Trend'){
x <- cbind(x, c(1:n))
colnames(x)[k+1] <- 't'
}
x
k <- length(x[1,])
df <- as.data.frame(x)
(mylm <- lm(df))
(mysum <- summary(mylm))
if (n > n25) {
kp3 <- k + 3
nmkm3 <- n - k - 3
gqarr <- array(NA, dim=c(nmkm3-kp3+1,3))
numgqtests <- 0
numsignificant1 <- 0
numsignificant5 <- 0
numsignificant10 <- 0
for (mypoint in kp3:nmkm3) {
j <- 0
numgqtests <- numgqtests + 1
for (myalt in c('greater', 'two.sided', 'less')) {
j <- j + 1
gqarr[mypoint-kp3+1,j] <- gqtest(mylm, point=mypoint, alternative=myalt)$p.value
}
if (gqarr[mypoint-kp3+1,2] < 0.01) numsignificant1 <- numsignificant1 + 1
if (gqarr[mypoint-kp3+1,2] < 0.05) numsignificant5 <- numsignificant5 + 1
if (gqarr[mypoint-kp3+1,2] < 0.10) numsignificant10 <- numsignificant10 + 1
}
gqarr
}
bitmap(file='test0.png')
plot(x[,1], type='l', main='Actuals and Interpolation', ylab='value of Actuals and Interpolation (dots)', xlab='time or index')
points(x[,1]-mysum$resid)
grid()
dev.off()
bitmap(file='test1.png')
plot(mysum$resid, type='b', pch=19, main='Residuals', ylab='value of Residuals', xlab='time or index')
grid()
dev.off()
bitmap(file='test2.png')
hist(mysum$resid, main='Residual Histogram', xlab='values of Residuals')
grid()
dev.off()
bitmap(file='test3.png')
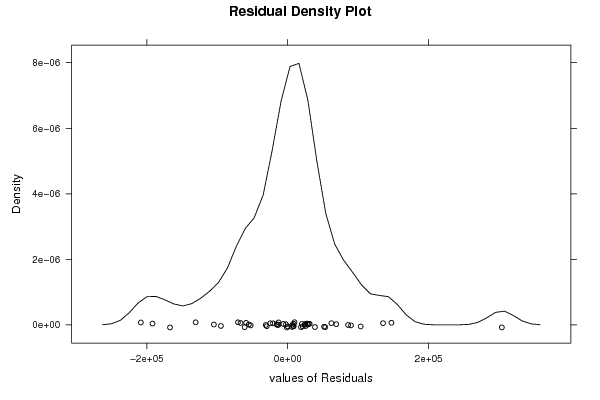
densityplot(~mysum$resid,col='black',main='Residual Density Plot', xlab='values of Residuals')
dev.off()
bitmap(file='test4.png')
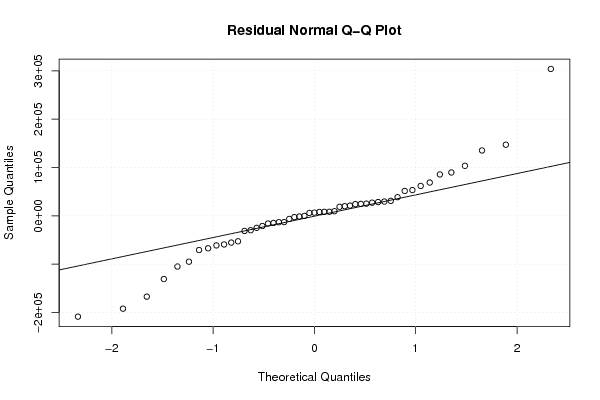
qqnorm(mysum$resid, main='Residual Normal Q-Q Plot')
qqline(mysum$resid)
grid()
dev.off()
(myerror <- as.ts(mysum$resid))
bitmap(file='test5.png')
dum <- cbind(lag(myerror,k=1),myerror)
dum
dum1 <- dum[2:length(myerror),]
dum1
z <- as.data.frame(dum1)
z
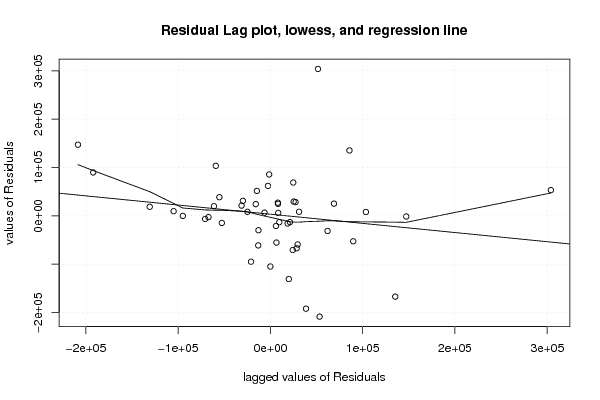
plot(z,main=paste('Residual Lag plot, lowess, and regression line'), ylab='values of Residuals', xlab='lagged values of Residuals')
lines(lowess(z))
abline(lm(z))
grid()
dev.off()
bitmap(file='test6.png')
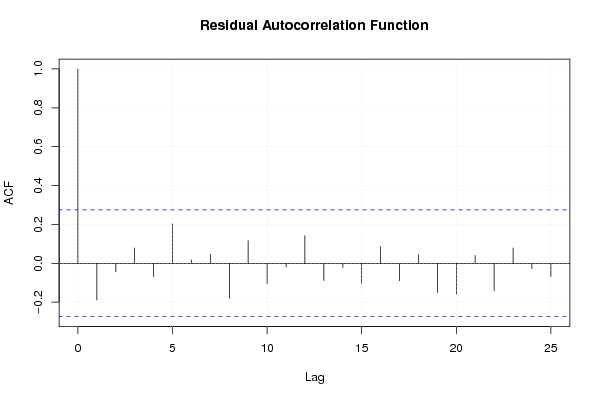
acf(mysum$resid, lag.max=length(mysum$resid)/2, main='Residual Autocorrelation Function')
grid()
dev.off()
bitmap(file='test7.png')
pacf(mysum$resid, lag.max=length(mysum$resid)/2, main='Residual Partial Autocorrelation Function')
grid()
dev.off()
bitmap(file='test8.png')
opar <- par(mfrow = c(2,2), oma = c(0, 0, 1.1, 0))
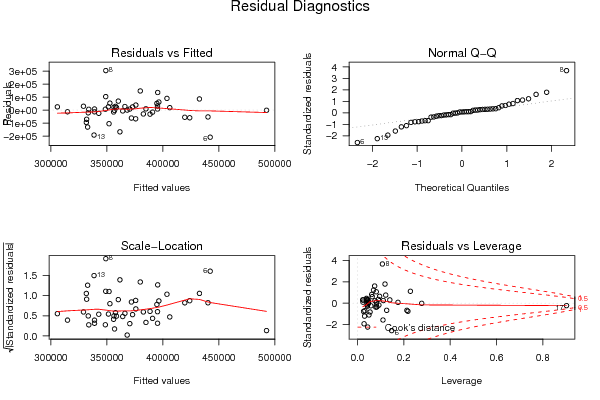
plot(mylm, las = 1, sub='Residual Diagnostics')
par(opar)
dev.off()
if (n > n25) {
bitmap(file='test9.png')
plot(kp3:nmkm3,gqarr[,2], main='Goldfeld-Quandt test',ylab='2-sided p-value',xlab='breakpoint')
grid()
dev.off()
}
load(file='createtable')
a<-table.start()
a<-table.row.start(a)
a<-table.element(a, 'Multiple Linear Regression - Estimated Regression Equation', 1, TRUE)
a<-table.row.end(a)
myeq <- colnames(x)[1]
myeq <- paste(myeq, '[t] = ', sep='')
for (i in 1:k){
if (mysum$coefficients[i,1] > 0) myeq <- paste(myeq, '+', '')
myeq <- paste(myeq, mysum$coefficients[i,1], sep=' ')
if (rownames(mysum$coefficients)[i] != '(Intercept)') {
myeq <- paste(myeq, rownames(mysum$coefficients)[i], sep='')
if (rownames(mysum$coefficients)[i] != 't') myeq <- paste(myeq, '[t]', sep='')
}
}
myeq <- paste(myeq, ' + e[t]')
a<-table.row.start(a)
a<-table.element(a, myeq)
a<-table.row.end(a)
a<-table.end(a)
table.save(a,file='mytable1.tab')
a<-table.start()
a<-table.row.start(a)
a<-table.element(a,hyperlink('ols1.htm','Multiple Linear Regression - Ordinary Least Squares',''), 6, TRUE)
a<-table.row.end(a)
a<-table.row.start(a)
a<-table.element(a,'Variable',header=TRUE)
a<-table.element(a,'Parameter',header=TRUE)
a<-table.element(a,'S.D.',header=TRUE)
a<-table.element(a,'T-STAT
H0: parameter = 0',header=TRUE)
a<-table.element(a,'2-tail p-value',header=TRUE)
a<-table.element(a,'1-tail p-value',header=TRUE)
a<-table.row.end(a)
for (i in 1:k){
a<-table.row.start(a)
a<-table.element(a,rownames(mysum$coefficients)[i],header=TRUE)
a<-table.element(a,mysum$coefficients[i,1])
a<-table.element(a, round(mysum$coefficients[i,2],6))
a<-table.element(a, round(mysum$coefficients[i,3],4))
a<-table.element(a, round(mysum$coefficients[i,4],6))
a<-table.element(a, round(mysum$coefficients[i,4]/2,6))
a<-table.row.end(a)
}
a<-table.end(a)
table.save(a,file='mytable2.tab')
a<-table.start()
a<-table.row.start(a)
a<-table.element(a, 'Multiple Linear Regression - Regression Statistics', 2, TRUE)
a<-table.row.end(a)
a<-table.row.start(a)
a<-table.element(a, 'Multiple R',1,TRUE)
a<-table.element(a, sqrt(mysum$r.squared))
a<-table.row.end(a)
a<-table.row.start(a)
a<-table.element(a, 'R-squared',1,TRUE)
a<-table.element(a, mysum$r.squared)
a<-table.row.end(a)
a<-table.row.start(a)
a<-table.element(a, 'Adjusted R-squared',1,TRUE)
a<-table.element(a, mysum$adj.r.squared)
a<-table.row.end(a)
a<-table.row.start(a)
a<-table.element(a, 'F-TEST (value)',1,TRUE)
a<-table.element(a, mysum$fstatistic[1])
a<-table.row.end(a)
a<-table.row.start(a)
a<-table.element(a, 'F-TEST (DF numerator)',1,TRUE)
a<-table.element(a, mysum$fstatistic[2])
a<-table.row.end(a)
a<-table.row.start(a)
a<-table.element(a, 'F-TEST (DF denominator)',1,TRUE)
a<-table.element(a, mysum$fstatistic[3])
a<-table.row.end(a)
a<-table.row.start(a)
a<-table.element(a, 'p-value',1,TRUE)
a<-table.element(a, 1-pf(mysum$fstatistic[1],mysum$fstatistic[2],mysum$fstatistic[3]))
a<-table.row.end(a)
a<-table.row.start(a)
a<-table.element(a, 'Multiple Linear Regression - Residual Statistics', 2, TRUE)
a<-table.row.end(a)
a<-table.row.start(a)
a<-table.element(a, 'Residual Standard Deviation',1,TRUE)
a<-table.element(a, mysum$sigma)
a<-table.row.end(a)
a<-table.row.start(a)
a<-table.element(a, 'Sum Squared Residuals',1,TRUE)
a<-table.element(a, sum(myerror*myerror))
a<-table.row.end(a)
a<-table.end(a)
table.save(a,file='mytable3.tab')
a<-table.start()
a<-table.row.start(a)
a<-table.element(a, 'Multiple Linear Regression - Actuals, Interpolation, and Residuals', 4, TRUE)
a<-table.row.end(a)
a<-table.row.start(a)
a<-table.element(a, 'Time or Index', 1, TRUE)
a<-table.element(a, 'Actuals', 1, TRUE)
a<-table.element(a, 'Interpolation
Forecast', 1, TRUE)
a<-table.element(a, 'Residuals
Prediction Error', 1, TRUE)
a<-table.row.end(a)
for (i in 1:n) {
a<-table.row.start(a)
a<-table.element(a,i, 1, TRUE)
a<-table.element(a,x[i])
a<-table.element(a,x[i]-mysum$resid[i])
a<-table.element(a,mysum$resid[i])
a<-table.row.end(a)
}
a<-table.end(a)
table.save(a,file='mytable4.tab')
if (n > n25) {
a<-table.start()
a<-table.row.start(a)
a<-table.element(a,'Goldfeld-Quandt test for Heteroskedasticity',4,TRUE)
a<-table.row.end(a)
a<-table.row.start(a)
a<-table.element(a,'p-values',header=TRUE)
a<-table.element(a,'Alternative Hypothesis',3,header=TRUE)
a<-table.row.end(a)
a<-table.row.start(a)
a<-table.element(a,'breakpoint index',header=TRUE)
a<-table.element(a,'greater',header=TRUE)
a<-table.element(a,'2-sided',header=TRUE)
a<-table.element(a,'less',header=TRUE)
a<-table.row.end(a)
for (mypoint in kp3:nmkm3) {
a<-table.row.start(a)
a<-table.element(a,mypoint,header=TRUE)
a<-table.element(a,gqarr[mypoint-kp3+1,1])
a<-table.element(a,gqarr[mypoint-kp3+1,2])
a<-table.element(a,gqarr[mypoint-kp3+1,3])
a<-table.row.end(a)
}
a<-table.end(a)
table.save(a,file='mytable5.tab')
a<-table.start()
a<-table.row.start(a)
a<-table.element(a,'Meta Analysis of Goldfeld-Quandt test for Heteroskedasticity',4,TRUE)
a<-table.row.end(a)
a<-table.row.start(a)
a<-table.element(a,'Description',header=TRUE)
a<-table.element(a,'# significant tests',header=TRUE)
a<-table.element(a,'% significant tests',header=TRUE)
a<-table.element(a,'OK/NOK',header=TRUE)
a<-table.row.end(a)
a<-table.row.start(a)
a<-table.element(a,'1% type I error level',header=TRUE)
a<-table.element(a,numsignificant1)
a<-table.element(a,numsignificant1/numgqtests)
if (numsignificant1/numgqtests < 0.01) dum <- 'OK' else dum <- 'NOK'
a<-table.element(a,dum)
a<-table.row.end(a)
a<-table.row.start(a)
a<-table.element(a,'5% type I error level',header=TRUE)
a<-table.element(a,numsignificant5)
a<-table.element(a,numsignificant5/numgqtests)
if (numsignificant5/numgqtests < 0.05) dum <- 'OK' else dum <- 'NOK'
a<-table.element(a,dum)
a<-table.row.end(a)
a<-table.row.start(a)
a<-table.element(a,'10% type I error level',header=TRUE)
a<-table.element(a,numsignificant10)
a<-table.element(a,numsignificant10/numgqtests)
if (numsignificant10/numgqtests < 0.1) dum <- 'OK' else dum <- 'NOK'
a<-table.element(a,dum)
a<-table.row.end(a)
a<-table.end(a)
table.save(a,file='mytable6.tab')
}