| Multiple Linear Regression - Estimated Regression Equation |
| Wealth[t] = + 277356.379214211 + 9.68627414559874Costs[t] -215.764818638136Trades[t] + 397.451574439388Orders[t] + 0.693364216186951Dividends[t] + e[t] |
| Multiple Linear Regression - Ordinary Least Squares | |||||
| Variable | Parameter | S.D. | T-STAT H0: parameter = 0 | 2-tail p-value | 1-tail p-value |
| (Intercept) | 277356.379214211 | 39187.296117 | 7.0777 | 0 | 0 |
| Costs | 9.68627414559874 | 7.267258 | 1.3329 | 0.18914 | 0.09457 |
| Trades | -215.764818638136 | 158.358849 | -1.3625 | 0.179672 | 0.089836 |
| Orders | 397.451574439388 | 599.73889 | 0.6627 | 0.510825 | 0.255412 |
| Dividends | 0.693364216186951 | 0.400191 | 1.7326 | 0.08987 | 0.044935 |
| Multiple Linear Regression - Regression Statistics | |
| Multiple R | 0.392827243240654 |
| R-squared | 0.154313243032052 |
| Adjusted R-squared | 0.080775264165274 |
| F-TEST (value) | 2.09841561340171 |
| F-TEST (DF numerator) | 4 |
| F-TEST (DF denominator) | 46 |
| p-value | 0.0963284682016443 |
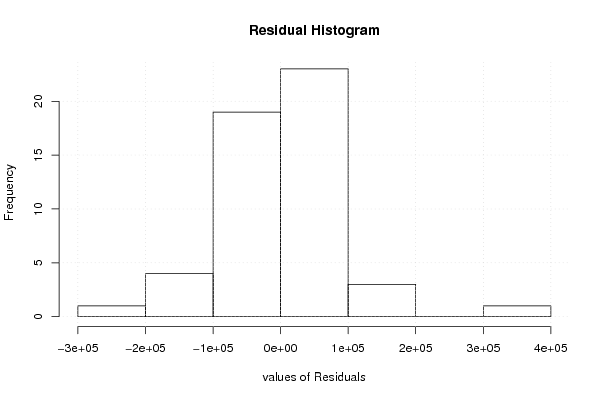
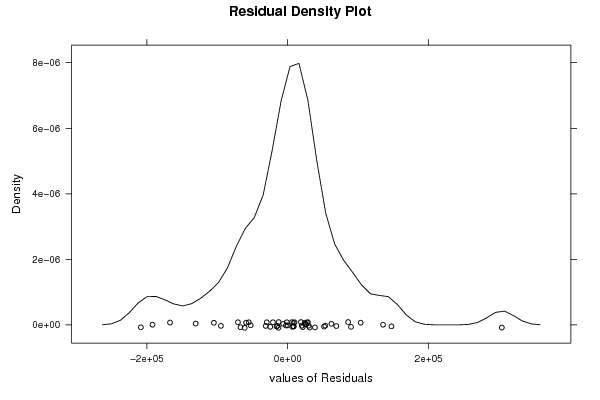
| Multiple Linear Regression - Residual Statistics | |
| Residual Standard Deviation | 87541.7774609282 |
| Sum Squared Residuals | 352523888846.859 |
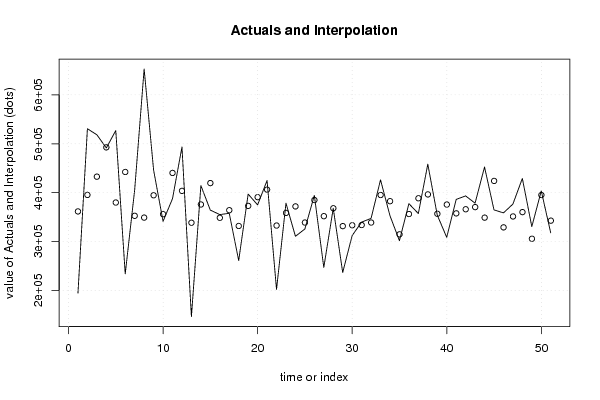
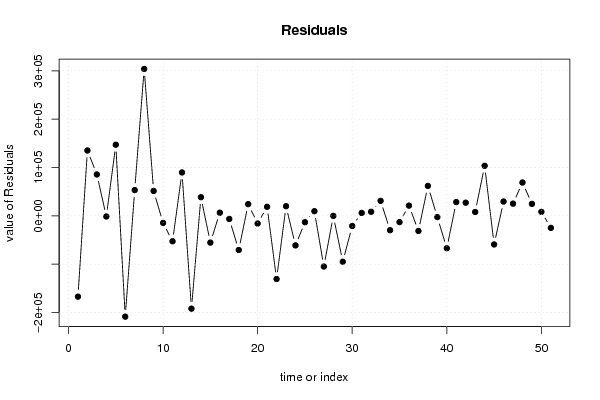
| Multiple Linear Regression - Actuals, Interpolation, and Residuals | |||
| Time or Index | Actuals | Interpolation Forecast | Residuals Prediction Error |
| 1 | 194493 | 361630.211109046 | -167137.211109046 |
| 2 | 530670 | 395381.558385441 | 135288.441614559 |
| 3 | 518365 | 432680.176655619 | 85684.8233443808 |
| 4 | 491303 | 492618.514546011 | -1315.51454601063 |
| 5 | 527021 | 379807.104899615 | 147213.895100385 |
| 6 | 233773 | 442280.06549428 | -208507.065494281 |
| 7 | 405972 | 352659.548535889 | 53312.451464111 |
| 8 | 652925 | 349014.249075821 | 303910.750924179 |
| 9 | 446211 | 394643.012662675 | 51567.9873373248 |
| 10 | 341340 | 355968.548697657 | -14628.548697657 |
| 11 | 387699 | 440304.601729954 | -52605.6017299535 |
| 12 | 493408 | 403632.346677689 | 89775.6533223111 |
| 13 | 146494 | 338504.283088191 | -192010.283088191 |
| 14 | 414462 | 375838.002970477 | 38623.9970295232 |
| 15 | 364304 | 419577.075558607 | -55273.0755586073 |
| 16 | 355178 | 348604.402847707 | 6573.59715229306 |
| 17 | 357760 | 364137.210791847 | -6377.21079184654 |
| 18 | 261216 | 331893.065889666 | -70677.0658896664 |
| 19 | 397144 | 372924.348604779 | 24219.6513952209 |
| 20 | 374943 | 390792.848149202 | -15849.8481492023 |
| 21 | 424898 | 406163.318511842 | 18734.6814881579 |
| 22 | 202055 | 332761.495682466 | -130706.495682466 |
| 23 | 378525 | 358539.345916681 | 19985.6540833188 |
| 24 | 310768 | 371902.473035387 | -61134.4730353869 |
| 25 | 325738 | 338899.60813619 | -13161.6081361900 |
| 26 | 394510 | 384876.186914894 | 9633.81308510628 |
| 27 | 247060 | 351907.398750297 | -104847.398750297 |
| 28 | 368078 | 368120.062195651 | -42.0621956506366 |
| 29 | 236761 | 331615.693850616 | -94854.6938506164 |
| 30 | 312378 | 333342.35348819 | -20964.35348819 |
| 31 | 339836 | 333804.67107351 | 6031.32892648994 |
| 32 | 347385 | 338922.384540800 | 8462.61545919952 |
| 33 | 426280 | 395202.136077462 | 31077.8639225384 |
| 34 | 352850 | 382584.851510322 | -29734.8515103219 |
| 35 | 301881 | 314793.570316241 | -12912.5703162405 |
| 36 | 377516 | 356286.264569872 | 21229.7354301281 |
| 37 | 357312 | 388523.315654525 | -31211.315654525 |
| 38 | 458343 | 396407.613575007 | 61935.3864249929 |
| 39 | 354228 | 356815.274174408 | -2587.27417440775 |
| 40 | 308636 | 375684.493554661 | -67048.4935546614 |
| 41 | 386212 | 357695.130613738 | 28516.8693862623 |
| 42 | 393343 | 366078.744111068 | 27264.2558889318 |
| 43 | 378509 | 370454.88069754 | 8054.11930245974 |
| 44 | 452469 | 348938.655480924 | 103530.344519076 |
| 45 | 364839 | 423975.395144575 | -59136.3951445753 |
| 46 | 358649 | 329054.630878272 | 29594.3691217279 |
| 47 | 376641 | 351366.720693372 | 25274.279306628 |
| 48 | 429112 | 360188.681010708 | 68923.3189892923 |
| 49 | 330546 | 305738.345552268 | 24807.6544477320 |
| 50 | 403560 | 395231.159122405 | 8328.84087759478 |
| 51 | 317892 | 342724.968795934 | -24832.9687959336 |
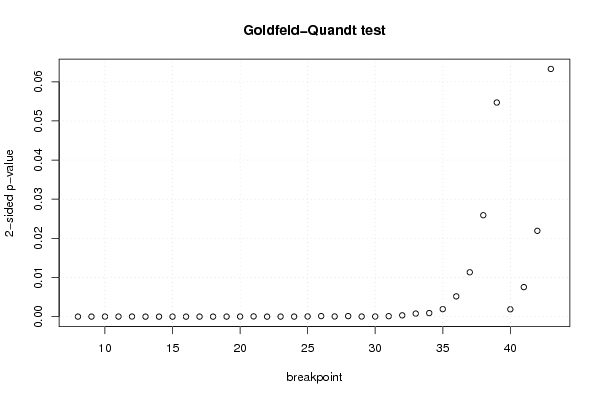
| Goldfeld-Quandt test for Heteroskedasticity | |||
| p-values | Alternative Hypothesis | ||
| breakpoint index | greater | 2-sided | less |
| 8 | 0.999993570425612 | 1.28591487766904e-05 | 6.4295743883452e-06 |
| 9 | 0.99999407620186 | 1.18475962781424e-05 | 5.92379813907118e-06 |
| 10 | 0.999987046891884 | 2.59062162319417e-05 | 1.29531081159708e-05 |
| 11 | 0.999988680022713 | 2.26399545730839e-05 | 1.13199772865420e-05 |
| 12 | 0.999986059777423 | 2.78804451542394e-05 | 1.39402225771197e-05 |
| 13 | 0.99999994224359 | 1.15512819688027e-07 | 5.77564098440133e-08 |
| 14 | 0.999999869127392 | 2.61745215367267e-07 | 1.30872607683633e-07 |
| 15 | 0.999999707323652 | 5.85352695286271e-07 | 2.92676347643136e-07 |
| 16 | 0.999999055695001 | 1.88860999721066e-06 | 9.44304998605331e-07 |
| 17 | 0.999997763188565 | 4.47362287066488e-06 | 2.23681143533244e-06 |
| 18 | 0.999997644859125 | 4.71028174992513e-06 | 2.35514087496257e-06 |
| 19 | 0.999993518624444 | 1.29627511124401e-05 | 6.48137555622007e-06 |
| 20 | 0.999987199768383 | 2.56004632332140e-05 | 1.28002316166070e-05 |
| 21 | 0.999966590075668 | 6.68198486631992e-05 | 3.34099243315996e-05 |
| 22 | 0.99999574719382 | 8.50561236124415e-06 | 4.25280618062207e-06 |
| 23 | 0.999990828920014 | 1.83421599728057e-05 | 9.17107998640285e-06 |
| 24 | 0.999990492963915 | 1.90140721705425e-05 | 9.50703608527126e-06 |
| 25 | 0.99997360543055 | 5.27891388995116e-05 | 2.63945694497558e-05 |
| 26 | 0.999929227404759 | 0.000141545190482831 | 7.07725952414156e-05 |
| 27 | 0.9999750578847 | 4.98842306005752e-05 | 2.49421153002876e-05 |
| 28 | 0.999931495980078 | 0.000137008039843867 | 6.85040199219335e-05 |
| 29 | 0.999981469811038 | 3.70603779240903e-05 | 1.85301889620451e-05 |
| 30 | 0.999980181812939 | 3.96363741228884e-05 | 1.98181870614442e-05 |
| 31 | 0.99993910697431 | 0.000121786051380625 | 6.08930256903127e-05 |
| 32 | 0.999831594897394 | 0.000336810205211761 | 0.000168405102605880 |
| 33 | 0.99960783483845 | 0.000784330323098981 | 0.000392165161549490 |
| 34 | 0.99954499223079 | 0.000910015538418632 | 0.000455007769209316 |
| 35 | 0.999036465679434 | 0.00192706864113188 | 0.00096353432056594 |
| 36 | 0.997409071058828 | 0.00518185788234451 | 0.00259092894117226 |
| 37 | 0.994330004034505 | 0.0113399919309903 | 0.00566999596549516 |
| 38 | 0.987043384067242 | 0.0259132318655158 | 0.0129566159327579 |
| 39 | 0.972646356996245 | 0.0547072860075103 | 0.0273536430037552 |
| 40 | 0.999058476521062 | 0.00188304695787567 | 0.000941523478937834 |
| 41 | 0.996226184528326 | 0.00754763094334786 | 0.00377381547167393 |
| 42 | 0.98903584754814 | 0.0219283049037201 | 0.0109641524518600 |
| 43 | 0.968355676090208 | 0.0632886478195838 | 0.0316443239097919 |
| Meta Analysis of Goldfeld-Quandt test for Heteroskedasticity | |||
| Description | # significant tests | % significant tests | OK/NOK |
| 1% type I error level | 31 | 0.861111111111111 | NOK |
| 5% type I error level | 34 | 0.944444444444444 | NOK |
| 10% type I error level | 36 | 1 | NOK |