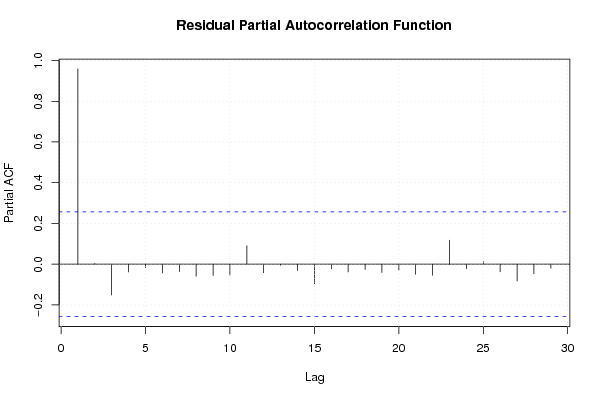
| Multiple Linear Regression - Estimated Regression Equation |
| vrijetijdsbesteding[t] = + 110.49 -1.72600000000005M1[t] -1.34400000000001M2[t] -1.28000000000001M3[t] -0.76400000000001M4[t] -0.722000000000008M5[t] -0.384000000000008M6[t] -0.216000000000008M7[t] + 0.165999999999991M8[t] + 1.49600000000000M9[t] + 1.69999999999999M10[t] -0.187500000000006M11[t] + e[t] |
| Multiple Linear Regression - Ordinary Least Squares | |||||
| Variable | Parameter | S.D. | T-STAT H0: parameter = 0 | 2-tail p-value | 1-tail p-value |
| (Intercept) | 110.49 | 3.049833 | 36.2282 | 0 | 0 |
| M1 | -1.72600000000005 | 4.09178 | -0.4218 | 0.67512 | 0.33756 |
| M2 | -1.34400000000001 | 4.09178 | -0.3285 | 0.744052 | 0.372026 |
| M3 | -1.28000000000001 | 4.09178 | -0.3128 | 0.75583 | 0.377915 |
| M4 | -0.76400000000001 | 4.09178 | -0.1867 | 0.852705 | 0.426352 |
| M5 | -0.722000000000008 | 4.09178 | -0.1765 | 0.860714 | 0.430357 |
| M6 | -0.384000000000008 | 4.09178 | -0.0938 | 0.925639 | 0.462819 |
| M7 | -0.216000000000008 | 4.09178 | -0.0528 | 0.958129 | 0.479064 |
| M8 | 0.165999999999991 | 4.09178 | 0.0406 | 0.967815 | 0.483907 |
| M9 | 1.49600000000000 | 4.09178 | 0.3656 | 0.716331 | 0.358166 |
| M10 | 1.69999999999999 | 4.09178 | 0.4155 | 0.679732 | 0.339866 |
| M11 | -0.187500000000006 | 4.313115 | -0.0435 | 0.965513 | 0.482757 |
| Multiple Linear Regression - Regression Statistics | |
| Multiple R | 0.184116543409472 |
| R-squared | 0.0338989015570519 |
| Adjusted R-squared | -0.197125274157566 |
| F-TEST (value) | 0.146733134972536 |
| F-TEST (DF numerator) | 11 |
| F-TEST (DF denominator) | 46 |
| p-value | 0.999225903166059 |
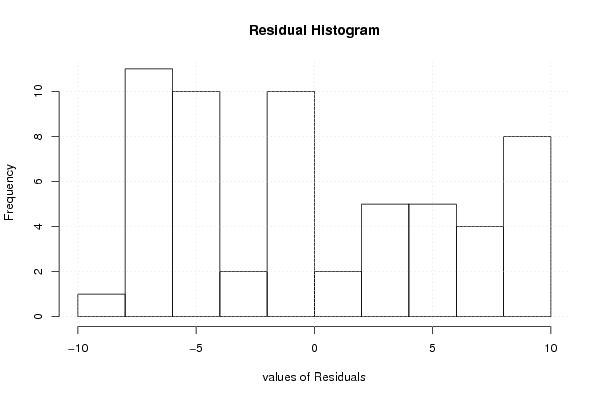
| Multiple Linear Regression - Residual Statistics | |
| Residual Standard Deviation | 6.09966569825223 |
| Sum Squared Residuals | 1711.47239500000 |
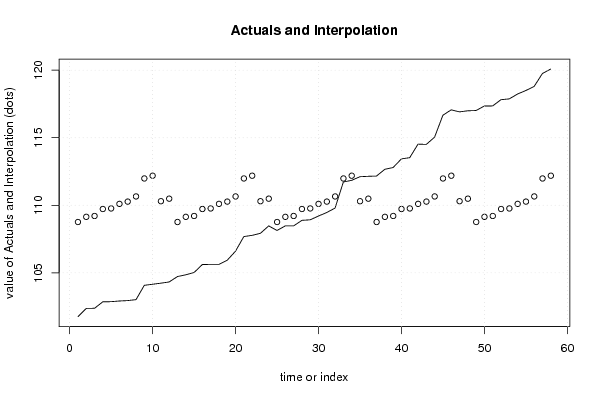
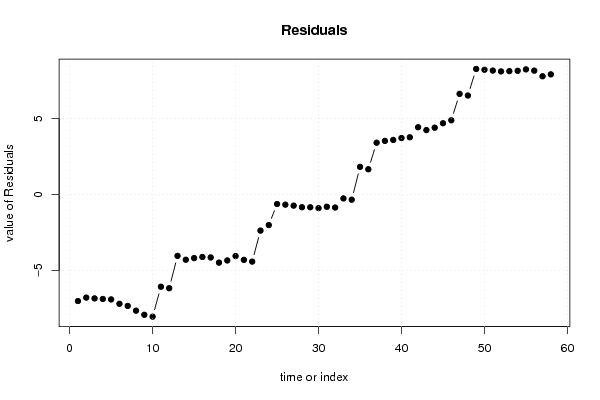
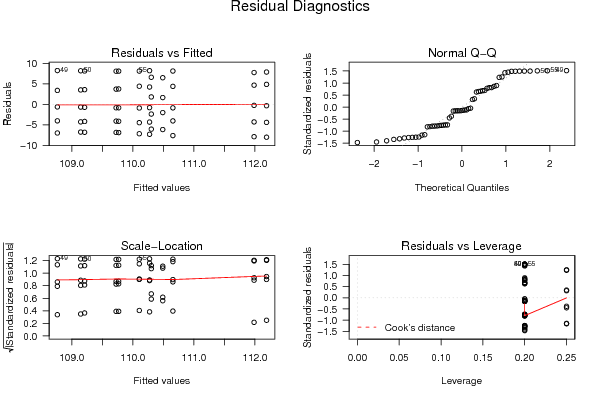
| Multiple Linear Regression - Actuals, Interpolation, and Residuals | |||
| Time or Index | Actuals | Interpolation Forecast | Residuals Prediction Error |
| 1 | 101.76 | 108.764000000000 | -7.00400000000016 |
| 2 | 102.37 | 109.146 | -6.77599999999999 |
| 3 | 102.38 | 109.21 | -6.83000000000001 |
| 4 | 102.86 | 109.726 | -6.866 |
| 5 | 102.87 | 109.768 | -6.898 |
| 6 | 102.92 | 110.106 | -7.186 |
| 7 | 102.95 | 110.274 | -7.324 |
| 8 | 103.02 | 110.656 | -7.636 |
| 9 | 104.08 | 111.986 | -7.906 |
| 10 | 104.16 | 112.19 | -8.03 |
| 11 | 104.24 | 110.3025 | -6.06250000000001 |
| 12 | 104.33 | 110.49 | -6.16000000000001 |
| 13 | 104.73 | 108.764 | -4.03399999999995 |
| 14 | 104.86 | 109.146 | -4.286 |
| 15 | 105.03 | 109.21 | -4.18 |
| 16 | 105.62 | 109.726 | -4.10599999999999 |
| 17 | 105.63 | 109.768 | -4.13800000000001 |
| 18 | 105.63 | 110.106 | -4.476 |
| 19 | 105.94 | 110.274 | -4.334 |
| 20 | 106.61 | 110.656 | -4.046 |
| 21 | 107.69 | 111.986 | -4.29600000000000 |
| 22 | 107.78 | 112.19 | -4.41 |
| 23 | 107.93 | 110.3025 | -2.37250000000000 |
| 24 | 108.48 | 110.49 | -2.01000000000000 |
| 25 | 108.14 | 108.764 | -0.623999999999958 |
| 26 | 108.48 | 109.146 | -0.665999999999992 |
| 27 | 108.48 | 109.21 | -0.729999999999993 |
| 28 | 108.89 | 109.726 | -0.835999999999997 |
| 29 | 108.93 | 109.768 | -0.837999999999994 |
| 30 | 109.21 | 110.106 | -0.896000000000004 |
| 31 | 109.47 | 110.274 | -0.804000000000003 |
| 32 | 109.8 | 110.656 | -0.856000000000001 |
| 33 | 111.73 | 111.986 | -0.255999999999998 |
| 34 | 111.85 | 112.19 | -0.340000000000002 |
| 35 | 112.12 | 110.3025 | 1.81750000000000 |
| 36 | 112.15 | 110.49 | 1.66000000000000 |
| 37 | 112.17 | 108.764 | 3.40600000000004 |
| 38 | 112.67 | 109.146 | 3.52400000000000 |
| 39 | 112.8 | 109.21 | 3.59 |
| 40 | 113.44 | 109.726 | 3.714 |
| 41 | 113.53 | 109.768 | 3.762 |
| 42 | 114.53 | 110.106 | 4.42400000000000 |
| 43 | 114.51 | 110.274 | 4.236 |
| 44 | 115.05 | 110.656 | 4.394 |
| 45 | 116.67 | 111.986 | 4.684 |
| 46 | 117.07 | 112.19 | 4.88 |
| 47 | 116.92 | 110.3025 | 6.6175 |
| 48 | 117 | 110.49 | 6.50999999999999 |
| 49 | 117.02 | 108.764 | 8.25600000000004 |
| 50 | 117.35 | 109.146 | 8.204 |
| 51 | 117.36 | 109.21 | 8.15 |
| 52 | 117.82 | 109.726 | 8.094 |
| 53 | 117.88 | 109.768 | 8.112 |
| 54 | 118.24 | 110.106 | 8.134 |
| 55 | 118.5 | 110.274 | 8.226 |
| 56 | 118.8 | 110.656 | 8.144 |
| 57 | 119.76 | 111.986 | 7.774 |
| 58 | 120.09 | 112.19 | 7.9 |
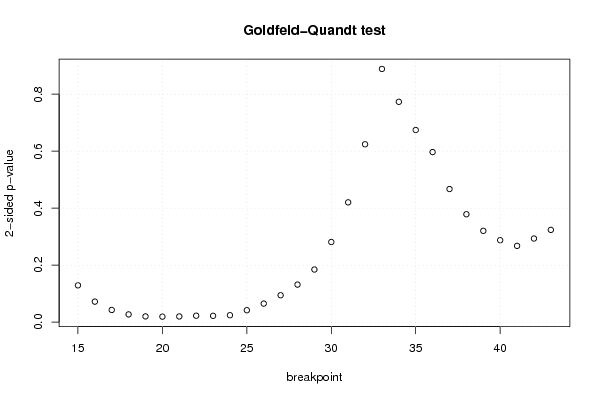
| Goldfeld-Quandt test for Heteroskedasticity | |||
| p-values | Alternative Hypothesis | ||
| breakpoint index | greater | 2-sided | less |
| 15 | 0.0645893929315995 | 0.129178785863199 | 0.9354106070684 |
| 16 | 0.0359893264042393 | 0.0719786528084787 | 0.96401067359576 |
| 17 | 0.0213879206131229 | 0.0427758412262459 | 0.978612079386877 |
| 18 | 0.0136170394310909 | 0.0272340788621817 | 0.98638296056891 |
| 19 | 0.0101066555341159 | 0.0202133110682319 | 0.989893344465884 |
| 20 | 0.00963159584388155 | 0.0192631916877631 | 0.990368404156118 |
| 21 | 0.00996493520835916 | 0.0199298704167183 | 0.99003506479164 |
| 22 | 0.0112566868735290 | 0.0225133737470579 | 0.98874331312647 |
| 23 | 0.0110864841604224 | 0.0221729683208449 | 0.988913515839578 |
| 24 | 0.0121488516846593 | 0.0242977033693186 | 0.98785114831534 |
| 25 | 0.0209377049293228 | 0.0418754098586457 | 0.979062295070677 |
| 26 | 0.0325552412018408 | 0.0651104824036817 | 0.96744475879816 |
| 27 | 0.0471685673852682 | 0.0943371347705364 | 0.952831432614732 |
| 28 | 0.0659306624002647 | 0.131861324800529 | 0.934069337599735 |
| 29 | 0.0923365843578951 | 0.184673168715790 | 0.907663415642105 |
| 30 | 0.140624188991067 | 0.281248377982135 | 0.859375811008933 |
| 31 | 0.210200834755615 | 0.42040166951123 | 0.789799165244385 |
| 32 | 0.312124005241855 | 0.62424801048371 | 0.687875994758145 |
| 33 | 0.444300268001602 | 0.888600536003204 | 0.555699731998398 |
| 34 | 0.613391200454309 | 0.773217599091382 | 0.386608799545691 |
| 35 | 0.66289280374485 | 0.674214392510299 | 0.337107196255150 |
| 36 | 0.701594229772474 | 0.596811540455053 | 0.298405770227526 |
| 37 | 0.766452204323642 | 0.467095591352717 | 0.233547795676358 |
| 38 | 0.810691125505356 | 0.378617748989288 | 0.189308874494644 |
| 39 | 0.839769048191784 | 0.320461903616432 | 0.160230951808216 |
| 40 | 0.856206312719432 | 0.287587374561137 | 0.143793687280568 |
| 41 | 0.86615000140447 | 0.267699997191059 | 0.133849998595530 |
| 42 | 0.853261402125933 | 0.293477195748133 | 0.146738597874067 |
| 43 | 0.838073030879997 | 0.323853938240006 | 0.161926969120003 |
| Meta Analysis of Goldfeld-Quandt test for Heteroskedasticity | |||
| Description | # significant tests | % significant tests | OK/NOK |
| 1% type I error level | 0 | 0 | OK |
| 5% type I error level | 9 | 0.310344827586207 | NOK |
| 10% type I error level | 12 | 0.413793103448276 | NOK |