Free Statistics

of Irreproducible Research!

Author's title

Author*The author of this computation has been verified*
R Software Modulerwasp_multipleregression.wasp
Title produced by softwareMultiple Regression
Date of computationTue, 30 Nov 2010 12:30:57 +0000
Cite this page as followsStatistical Computations at FreeStatistics.org, Office for Research Development and Education, URL https://freestatistics.org/blog/index.php?v=date/2010/Nov/30/t1291120169hamfajbutf2xhs7.htm/, Retrieved Mon, 29 Apr 2024 10:09:08 +0000
Statistical Computations at FreeStatistics.org, Office for Research Development and Education, URL https://freestatistics.org/blog/index.php?pk=103348, Retrieved Mon, 29 Apr 2024 10:09:08 +0000
QR Codes:

Original text written by user:
IsPrivate?No (this computation is public)
User-defined keywords
Estimated Impact130
Family? (F = Feedback message, R = changed R code, M = changed R Module, P = changed Parameters, D = changed Data)
-     [Univariate Explorative Data Analysis] [Run Sequence gebo...] [2008-12-12 13:32:37] [76963dc1903f0f612b6153510a3818cf]
- R  D  [Univariate Explorative Data Analysis] [Run Sequence gebo...] [2008-12-17 12:14:40] [76963dc1903f0f612b6153510a3818cf]
-         [Univariate Explorative Data Analysis] [Run Sequence Plot...] [2008-12-22 18:19:51] [1ce0d16c8f4225c977b42c8fa93bc163]
- RMP       [Univariate Data Series] [Identifying Integ...] [2009-11-22 12:08:06] [b98453cac15ba1066b407e146608df68]
- RMP         [Multiple Regression] [Regression Analys...] [2010-11-29 10:23:21] [49c7a512c56172bc46ae7e93e5b58c1c]
F    D            [Multiple Regression] [model 1] [2010-11-30 12:30:57] [4f70e6cd0867f10d298e58e8e27859b5] [Current]
Feedback Forum
2010-12-03 11:26:51 [Stefanie Van Esbroeck] [reply
J maakt een correcte berekening bij dit model. In de tutorial vermeld je ook welke parameters je allemaal hebt aangepast om aan de getoonde output te geraken. Dit vind ik wel een pluspunt maar dit staat wel een beetje onduidelijk omschreven in het worddocument.

Je interpreteert erg uitgebreid en correct de tabellen. Daarna interpreteer je de grafieken wel kort vind ik, eigenlijk iets te kort. Bij de actuals en interpolation grafiek merk je duidelijk een stijgende trend op wat correct is maar je had ook kunnen zien dat deze trend deterministisch is omdat die blijft stijgen. Daarnaast had je ook de seizoenaliteit kunnen interpreteren. We zien op de grafiek dat die witte bolletje toch goed de trend volgen waardoor we kunnen spreken van een stijgende seizoenaliteit. Er is dus sprake van een verband tussen de geboortes en de seizoenen.

Je interpretatie van de residuals, residual histogram, residual density plot en QQ plot zijn correct. Enkel je interpretatie van de laatste grafiek is niet helemaal correct. Je moet dit eigenlijk algemener bekijken. We kunnen hier zien dat er nog altijd autocorrelatie aanwezig is. Verder zie ik dat je niet hebt gecontroleerd of de assumpties van het model nu voldaan zijn of niet.

Post a new message
Dataseries X:
9700
9081
9084
9743
8587
9731
9563
9998
9437
10039
9918
9252
9737
9035
9133
9487
8700
9627
8947
9283
8829
9947
9628
9318
9605
8640
9214
9567
8547
9185
9470
9123
9278
10170
9434
9655
9429
8739
9552
9687
9019
9672
9206
9069
9788
10312
10105
9863
9656
9295
9946
9701
9049
10190
9706
9765
9893
9994
10433
10073
10112
9266
9820
10097
9115
10411
9678
10408
10153
10368
10581
10597
10680
9738
9556


Summary of computational transaction
Raw Inputview raw input (R code)
Raw Outputview raw output of R engine
Computing time6 seconds
R Server'Sir Ronald Aylmer Fisher' @ 193.190.124.24

\begin{tabular}{lllllllll}
\hline
Summary of computational transaction \tabularnewline
Raw Input & view raw input (R code)  \tabularnewline
Raw Output & view raw output of R engine  \tabularnewline
Computing time & 6 seconds \tabularnewline
R Server & 'Sir Ronald Aylmer Fisher' @ 193.190.124.24 \tabularnewline
\hline
\end{tabular}
%Source: https://freestatistics.org/blog/index.php?pk=103348&T=0

[TABLE]
[ROW][C]Summary of computational transaction[/C][/ROW]
[ROW][C]Raw Input[/C][C]view raw input (R code) [/C][/ROW]
[ROW][C]Raw Output[/C][C]view raw output of R engine [/C][/ROW]
[ROW][C]Computing time[/C][C]6 seconds[/C][/ROW]
[ROW][C]R Server[/C][C]'Sir Ronald Aylmer Fisher' @ 193.190.124.24[/C][/ROW]
[/TABLE]
Source: https://freestatistics.org/blog/index.php?pk=103348&T=0

Globally Unique Identifier (entire table): ba.freestatistics.org/blog/index.php?pk=103348&T=0

As an alternative you can also use a QR Code:  

The GUIDs for individual cells are displayed in the table below:

Summary of computational transaction
Raw Inputview raw input (R code)
Raw Outputview raw output of R engine
Computing time6 seconds
R Server'Sir Ronald Aylmer Fisher' @ 193.190.124.24


Multiple Linear Regression - Estimated Regression Equation
Births[t] = + 9330.6231884058 + 107.616287094544M1[t] -635.535541752933M2[t] -287.830227743271M3[t] + 8.73844030365812M4[t] -879.770531400966M5[t] + 75.7204968944103M6[t] -309.621808143547M7[t] -141.297446514838M8[t] -196.973084886128M9[t] + 367.351276742581M10[t] + 234.508971704624M11[t] + 11.0089717046239t + e[t]

\begin{tabular}{lllllllll}
\hline
Multiple Linear Regression - Estimated Regression Equation \tabularnewline
Births[t] =  +  9330.6231884058 +  107.616287094544M1[t] -635.535541752933M2[t] -287.830227743271M3[t] +  8.73844030365812M4[t] -879.770531400966M5[t] +  75.7204968944103M6[t] -309.621808143547M7[t] -141.297446514838M8[t] -196.973084886128M9[t] +  367.351276742581M10[t] +  234.508971704624M11[t] +  11.0089717046239t  + e[t] \tabularnewline
\hline
\end{tabular}
%Source: https://freestatistics.org/blog/index.php?pk=103348&T=1

[TABLE]
[ROW][C]Multiple Linear Regression - Estimated Regression Equation[/C][/ROW]
[ROW][C]Births[t] =  +  9330.6231884058 +  107.616287094544M1[t] -635.535541752933M2[t] -287.830227743271M3[t] +  8.73844030365812M4[t] -879.770531400966M5[t] +  75.7204968944103M6[t] -309.621808143547M7[t] -141.297446514838M8[t] -196.973084886128M9[t] +  367.351276742581M10[t] +  234.508971704624M11[t] +  11.0089717046239t  + e[t][/C][/ROW]
[/TABLE]
Source: https://freestatistics.org/blog/index.php?pk=103348&T=1

Globally Unique Identifier (entire table): ba.freestatistics.org/blog/index.php?pk=103348&T=1

As an alternative you can also use a QR Code:  

The GUIDs for individual cells are displayed in the table below:

Multiple Linear Regression - Estimated Regression Equation
Births[t] = + 9330.6231884058 + 107.616287094544M1[t] -635.535541752933M2[t] -287.830227743271M3[t] + 8.73844030365812M4[t] -879.770531400966M5[t] + 75.7204968944103M6[t] -309.621808143547M7[t] -141.297446514838M8[t] -196.973084886128M9[t] + 367.351276742581M10[t] + 234.508971704624M11[t] + 11.0089717046239t + e[t]


Multiple Linear Regression - Ordinary Least Squares
VariableParameterS.D.T-STATH0: parameter = 02-tail p-value1-tail p-value
(Intercept)9330.6231884058136.43832168.387100
M1107.616287094544162.9919160.66030.5115360.255768
M2-635.535541752933162.923919-3.90080.0002390.000119
M3-287.830227743271162.871013-1.76720.0821110.041056
M48.73844030365812169.4143670.05160.9590290.479514
M5-879.770531400966169.305323-5.19642e-061e-06
M675.7204968944103169.2107620.44750.6560790.32804
M7-309.621808143547169.130707-1.83070.0719570.035979
M8-141.297446514838169.065179-0.83580.4065010.20325
M9-196.973084886128169.014195-1.16540.2483120.124156
M10367.351276742581168.9777692.1740.0335340.016767
M11234.508971704624168.955911.3880.1701080.085054
t11.00897170462391.569197.015700

\begin{tabular}{lllllllll}
\hline
Multiple Linear Regression - Ordinary Least Squares \tabularnewline
Variable & Parameter & S.D. & T-STATH0: parameter = 0 & 2-tail p-value & 1-tail p-value \tabularnewline
(Intercept) & 9330.6231884058 & 136.438321 & 68.3871 & 0 & 0 \tabularnewline
M1 & 107.616287094544 & 162.991916 & 0.6603 & 0.511536 & 0.255768 \tabularnewline
M2 & -635.535541752933 & 162.923919 & -3.9008 & 0.000239 & 0.000119 \tabularnewline
M3 & -287.830227743271 & 162.871013 & -1.7672 & 0.082111 & 0.041056 \tabularnewline
M4 & 8.73844030365812 & 169.414367 & 0.0516 & 0.959029 & 0.479514 \tabularnewline
M5 & -879.770531400966 & 169.305323 & -5.1964 & 2e-06 & 1e-06 \tabularnewline
M6 & 75.7204968944103 & 169.210762 & 0.4475 & 0.656079 & 0.32804 \tabularnewline
M7 & -309.621808143547 & 169.130707 & -1.8307 & 0.071957 & 0.035979 \tabularnewline
M8 & -141.297446514838 & 169.065179 & -0.8358 & 0.406501 & 0.20325 \tabularnewline
M9 & -196.973084886128 & 169.014195 & -1.1654 & 0.248312 & 0.124156 \tabularnewline
M10 & 367.351276742581 & 168.977769 & 2.174 & 0.033534 & 0.016767 \tabularnewline
M11 & 234.508971704624 & 168.95591 & 1.388 & 0.170108 & 0.085054 \tabularnewline
t & 11.0089717046239 & 1.56919 & 7.0157 & 0 & 0 \tabularnewline
\hline
\end{tabular}
%Source: https://freestatistics.org/blog/index.php?pk=103348&T=2

[TABLE]
[ROW][C]Multiple Linear Regression - Ordinary Least Squares[/C][/ROW]
[ROW][C]Variable[/C][C]Parameter[/C][C]S.D.[/C][C]T-STATH0: parameter = 0[/C][C]2-tail p-value[/C][C]1-tail p-value[/C][/ROW]
[ROW][C](Intercept)[/C][C]9330.6231884058[/C][C]136.438321[/C][C]68.3871[/C][C]0[/C][C]0[/C][/ROW]
[ROW][C]M1[/C][C]107.616287094544[/C][C]162.991916[/C][C]0.6603[/C][C]0.511536[/C][C]0.255768[/C][/ROW]
[ROW][C]M2[/C][C]-635.535541752933[/C][C]162.923919[/C][C]-3.9008[/C][C]0.000239[/C][C]0.000119[/C][/ROW]
[ROW][C]M3[/C][C]-287.830227743271[/C][C]162.871013[/C][C]-1.7672[/C][C]0.082111[/C][C]0.041056[/C][/ROW]
[ROW][C]M4[/C][C]8.73844030365812[/C][C]169.414367[/C][C]0.0516[/C][C]0.959029[/C][C]0.479514[/C][/ROW]
[ROW][C]M5[/C][C]-879.770531400966[/C][C]169.305323[/C][C]-5.1964[/C][C]2e-06[/C][C]1e-06[/C][/ROW]
[ROW][C]M6[/C][C]75.7204968944103[/C][C]169.210762[/C][C]0.4475[/C][C]0.656079[/C][C]0.32804[/C][/ROW]
[ROW][C]M7[/C][C]-309.621808143547[/C][C]169.130707[/C][C]-1.8307[/C][C]0.071957[/C][C]0.035979[/C][/ROW]
[ROW][C]M8[/C][C]-141.297446514838[/C][C]169.065179[/C][C]-0.8358[/C][C]0.406501[/C][C]0.20325[/C][/ROW]
[ROW][C]M9[/C][C]-196.973084886128[/C][C]169.014195[/C][C]-1.1654[/C][C]0.248312[/C][C]0.124156[/C][/ROW]
[ROW][C]M10[/C][C]367.351276742581[/C][C]168.977769[/C][C]2.174[/C][C]0.033534[/C][C]0.016767[/C][/ROW]
[ROW][C]M11[/C][C]234.508971704624[/C][C]168.95591[/C][C]1.388[/C][C]0.170108[/C][C]0.085054[/C][/ROW]
[ROW][C]t[/C][C]11.0089717046239[/C][C]1.56919[/C][C]7.0157[/C][C]0[/C][C]0[/C][/ROW]
[/TABLE]
Source: https://freestatistics.org/blog/index.php?pk=103348&T=2

Globally Unique Identifier (entire table): ba.freestatistics.org/blog/index.php?pk=103348&T=2

As an alternative you can also use a QR Code:  

The GUIDs for individual cells are displayed in the table below:

Multiple Linear Regression - Ordinary Least Squares
VariableParameterS.D.T-STATH0: parameter = 02-tail p-value1-tail p-value
(Intercept)9330.6231884058136.43832168.387100
M1107.616287094544162.9919160.66030.5115360.255768
M2-635.535541752933162.923919-3.90080.0002390.000119
M3-287.830227743271162.871013-1.76720.0821110.041056
M48.73844030365812169.4143670.05160.9590290.479514
M5-879.770531400966169.305323-5.19642e-061e-06
M675.7204968944103169.2107620.44750.6560790.32804
M7-309.621808143547169.130707-1.83070.0719570.035979
M8-141.297446514838169.065179-0.83580.4065010.20325
M9-196.973084886128169.014195-1.16540.2483120.124156
M10367.351276742581168.9777692.1740.0335340.016767
M11234.508971704624168.955911.3880.1701080.085054
t11.00897170462391.569197.015700


Multiple Linear Regression - Regression Statistics
Multiple R0.846476842937978
R-squared0.716523045630245
Adjusted R-squared0.661656538332874
F-TEST (value)13.0593887040549
F-TEST (DF numerator)12
F-TEST (DF denominator)62
p-value8.08797473439427e-13
Multiple Linear Regression - Residual Statistics
Residual Standard Deviation292.627597935097
Sum Squared Residuals5309116.48654243

\begin{tabular}{lllllllll}
\hline
Multiple Linear Regression - Regression Statistics \tabularnewline
Multiple R & 0.846476842937978 \tabularnewline
R-squared & 0.716523045630245 \tabularnewline
Adjusted R-squared & 0.661656538332874 \tabularnewline
F-TEST (value) & 13.0593887040549 \tabularnewline
F-TEST (DF numerator) & 12 \tabularnewline
F-TEST (DF denominator) & 62 \tabularnewline
p-value & 8.08797473439427e-13 \tabularnewline
Multiple Linear Regression - Residual Statistics \tabularnewline
Residual Standard Deviation & 292.627597935097 \tabularnewline
Sum Squared Residuals & 5309116.48654243 \tabularnewline
\hline
\end{tabular}
%Source: https://freestatistics.org/blog/index.php?pk=103348&T=3

[TABLE]
[ROW][C]Multiple Linear Regression - Regression Statistics[/C][/ROW]
[ROW][C]Multiple R[/C][C]0.846476842937978[/C][/ROW]
[ROW][C]R-squared[/C][C]0.716523045630245[/C][/ROW]
[ROW][C]Adjusted R-squared[/C][C]0.661656538332874[/C][/ROW]
[ROW][C]F-TEST (value)[/C][C]13.0593887040549[/C][/ROW]
[ROW][C]F-TEST (DF numerator)[/C][C]12[/C][/ROW]
[ROW][C]F-TEST (DF denominator)[/C][C]62[/C][/ROW]
[ROW][C]p-value[/C][C]8.08797473439427e-13[/C][/ROW]
[ROW][C]Multiple Linear Regression - Residual Statistics[/C][/ROW]
[ROW][C]Residual Standard Deviation[/C][C]292.627597935097[/C][/ROW]
[ROW][C]Sum Squared Residuals[/C][C]5309116.48654243[/C][/ROW]
[/TABLE]
Source: https://freestatistics.org/blog/index.php?pk=103348&T=3

Globally Unique Identifier (entire table): ba.freestatistics.org/blog/index.php?pk=103348&T=3

As an alternative you can also use a QR Code:  

The GUIDs for individual cells are displayed in the table below:

Multiple Linear Regression - Regression Statistics
Multiple R0.846476842937978
R-squared0.716523045630245
Adjusted R-squared0.661656538332874
F-TEST (value)13.0593887040549
F-TEST (DF numerator)12
F-TEST (DF denominator)62
p-value8.08797473439427e-13
Multiple Linear Regression - Residual Statistics
Residual Standard Deviation292.627597935097
Sum Squared Residuals5309116.48654243


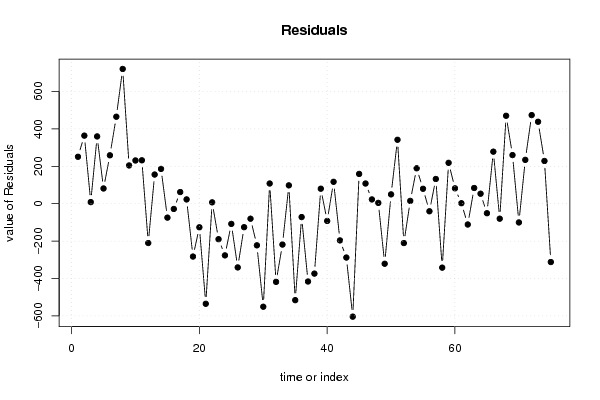
Multiple Linear Regression - Actuals, Interpolation, and Residuals
Time or IndexActualsInterpolationForecastResidualsPrediction Error
197009449.248447205250.751552795006
290818717.10559006211363.894409937889
390849075.81987577648.18012422360365
497439383.39751552795359.602484472051
585878505.8975155279581.1024844720503
697319472.39751552795258.602484472051
795639098.06418219462464.935817805384
899989277.39751552795720.60248447205
994379232.73084886128204.269151138717
10100399808.06418219462230.935817805384
1199189686.23084886128231.769151138717
1292529462.73084886128-210.730848861283
1397379581.35610766045155.643892339550
1490358849.2132505176185.786749482402
1591339207.92753623188-74.9275362318834
1694879515.50517598344-28.5051759834363
1787008638.0051759834461.9948240165638
1896279604.5051759834422.4948240165637
1989479230.1718426501-283.171842650103
2092839409.50517598344-126.505175983436
2188299364.83850931677-535.83850931677
2299479940.17184265016.82815734989703
2396289818.33850931677-190.338509316770
2493189594.83850931677-276.838509316770
2596059713.46376811594-108.463768115937
2686408981.32091097309-341.320910973085
2792149340.03519668737-126.035196687370
2895679647.61283643892-80.6128364389232
2985478770.11283643892-223.112836438923
3091859736.61283643892-551.612836438923
3194709362.27950310559107.720496894410
3291239541.61283643892-418.612836438923
3392789496.94616977226-218.946169772257
341017010072.279503105697.7204968944101
3594349950.44616977226-516.446169772257
3696559726.94616977226-71.9461697722564
3794299845.57142857142-416.571428571424
3887399113.42857142857-374.428571428571
3995529472.1428571428679.8571428571428
4096879779.7204968944-92.7204968944101
4190198902.22049689441116.77950310559
4296729868.7204968944-196.72049689441
4392069494.38716356108-288.387163561077
4490699673.72049689441-604.72049689441
4597889629.05383022774158.946169772256
461031210204.3871635611107.612836438923
471010510082.553830227722.4461697722565
4898639859.053830227743.94616977225661
4996569977.67908902691-321.679089026911
5092959245.5362318840649.4637681159416
5199469604.25051759834341.749482401656
5297019911.8281573499-210.828157349897
5390499034.328157349914.6718426501029
541019010000.8281573499189.171842650103
5597069626.4948240165679.5051759834362
5697659805.8281573499-40.8281573498971
5798939761.16149068323131.838509316770
58999410336.4948240166-342.494824016564
591043310214.6614906832218.338509316770
60100739991.1614906832381.8385093167697
611011210109.78674948242.21325051760193
6292669377.64389233955-111.643892339545
6398209736.3581780538383.6418219461689
641009710043.935817805453.064182194616
6591159166.43581780538-51.4358178053838
661041110132.9358178054278.064182194616
6796789758.60248447205-80.6024844720507
68104089937.93581780538470.064182194616
69101539893.26915113872259.730848861283
701036810468.6024844721-100.602484472051
711058110346.7691511387234.230848861283
721059710123.2691511387473.730848861283
731068010241.8944099379438.105590062115
7497389509.75155279503228.248447204968
7595569868.46583850932-312.465838509318

\begin{tabular}{lllllllll}
\hline
Multiple Linear Regression - Actuals, Interpolation, and Residuals \tabularnewline
Time or Index & Actuals & InterpolationForecast & ResidualsPrediction Error \tabularnewline
1 & 9700 & 9449.248447205 & 250.751552795006 \tabularnewline
2 & 9081 & 8717.10559006211 & 363.894409937889 \tabularnewline
3 & 9084 & 9075.8198757764 & 8.18012422360365 \tabularnewline
4 & 9743 & 9383.39751552795 & 359.602484472051 \tabularnewline
5 & 8587 & 8505.89751552795 & 81.1024844720503 \tabularnewline
6 & 9731 & 9472.39751552795 & 258.602484472051 \tabularnewline
7 & 9563 & 9098.06418219462 & 464.935817805384 \tabularnewline
8 & 9998 & 9277.39751552795 & 720.60248447205 \tabularnewline
9 & 9437 & 9232.73084886128 & 204.269151138717 \tabularnewline
10 & 10039 & 9808.06418219462 & 230.935817805384 \tabularnewline
11 & 9918 & 9686.23084886128 & 231.769151138717 \tabularnewline
12 & 9252 & 9462.73084886128 & -210.730848861283 \tabularnewline
13 & 9737 & 9581.35610766045 & 155.643892339550 \tabularnewline
14 & 9035 & 8849.2132505176 & 185.786749482402 \tabularnewline
15 & 9133 & 9207.92753623188 & -74.9275362318834 \tabularnewline
16 & 9487 & 9515.50517598344 & -28.5051759834363 \tabularnewline
17 & 8700 & 8638.00517598344 & 61.9948240165638 \tabularnewline
18 & 9627 & 9604.50517598344 & 22.4948240165637 \tabularnewline
19 & 8947 & 9230.1718426501 & -283.171842650103 \tabularnewline
20 & 9283 & 9409.50517598344 & -126.505175983436 \tabularnewline
21 & 8829 & 9364.83850931677 & -535.83850931677 \tabularnewline
22 & 9947 & 9940.1718426501 & 6.82815734989703 \tabularnewline
23 & 9628 & 9818.33850931677 & -190.338509316770 \tabularnewline
24 & 9318 & 9594.83850931677 & -276.838509316770 \tabularnewline
25 & 9605 & 9713.46376811594 & -108.463768115937 \tabularnewline
26 & 8640 & 8981.32091097309 & -341.320910973085 \tabularnewline
27 & 9214 & 9340.03519668737 & -126.035196687370 \tabularnewline
28 & 9567 & 9647.61283643892 & -80.6128364389232 \tabularnewline
29 & 8547 & 8770.11283643892 & -223.112836438923 \tabularnewline
30 & 9185 & 9736.61283643892 & -551.612836438923 \tabularnewline
31 & 9470 & 9362.27950310559 & 107.720496894410 \tabularnewline
32 & 9123 & 9541.61283643892 & -418.612836438923 \tabularnewline
33 & 9278 & 9496.94616977226 & -218.946169772257 \tabularnewline
34 & 10170 & 10072.2795031056 & 97.7204968944101 \tabularnewline
35 & 9434 & 9950.44616977226 & -516.446169772257 \tabularnewline
36 & 9655 & 9726.94616977226 & -71.9461697722564 \tabularnewline
37 & 9429 & 9845.57142857142 & -416.571428571424 \tabularnewline
38 & 8739 & 9113.42857142857 & -374.428571428571 \tabularnewline
39 & 9552 & 9472.14285714286 & 79.8571428571428 \tabularnewline
40 & 9687 & 9779.7204968944 & -92.7204968944101 \tabularnewline
41 & 9019 & 8902.22049689441 & 116.77950310559 \tabularnewline
42 & 9672 & 9868.7204968944 & -196.72049689441 \tabularnewline
43 & 9206 & 9494.38716356108 & -288.387163561077 \tabularnewline
44 & 9069 & 9673.72049689441 & -604.72049689441 \tabularnewline
45 & 9788 & 9629.05383022774 & 158.946169772256 \tabularnewline
46 & 10312 & 10204.3871635611 & 107.612836438923 \tabularnewline
47 & 10105 & 10082.5538302277 & 22.4461697722565 \tabularnewline
48 & 9863 & 9859.05383022774 & 3.94616977225661 \tabularnewline
49 & 9656 & 9977.67908902691 & -321.679089026911 \tabularnewline
50 & 9295 & 9245.53623188406 & 49.4637681159416 \tabularnewline
51 & 9946 & 9604.25051759834 & 341.749482401656 \tabularnewline
52 & 9701 & 9911.8281573499 & -210.828157349897 \tabularnewline
53 & 9049 & 9034.3281573499 & 14.6718426501029 \tabularnewline
54 & 10190 & 10000.8281573499 & 189.171842650103 \tabularnewline
55 & 9706 & 9626.49482401656 & 79.5051759834362 \tabularnewline
56 & 9765 & 9805.8281573499 & -40.8281573498971 \tabularnewline
57 & 9893 & 9761.16149068323 & 131.838509316770 \tabularnewline
58 & 9994 & 10336.4948240166 & -342.494824016564 \tabularnewline
59 & 10433 & 10214.6614906832 & 218.338509316770 \tabularnewline
60 & 10073 & 9991.16149068323 & 81.8385093167697 \tabularnewline
61 & 10112 & 10109.7867494824 & 2.21325051760193 \tabularnewline
62 & 9266 & 9377.64389233955 & -111.643892339545 \tabularnewline
63 & 9820 & 9736.35817805383 & 83.6418219461689 \tabularnewline
64 & 10097 & 10043.9358178054 & 53.064182194616 \tabularnewline
65 & 9115 & 9166.43581780538 & -51.4358178053838 \tabularnewline
66 & 10411 & 10132.9358178054 & 278.064182194616 \tabularnewline
67 & 9678 & 9758.60248447205 & -80.6024844720507 \tabularnewline
68 & 10408 & 9937.93581780538 & 470.064182194616 \tabularnewline
69 & 10153 & 9893.26915113872 & 259.730848861283 \tabularnewline
70 & 10368 & 10468.6024844721 & -100.602484472051 \tabularnewline
71 & 10581 & 10346.7691511387 & 234.230848861283 \tabularnewline
72 & 10597 & 10123.2691511387 & 473.730848861283 \tabularnewline
73 & 10680 & 10241.8944099379 & 438.105590062115 \tabularnewline
74 & 9738 & 9509.75155279503 & 228.248447204968 \tabularnewline
75 & 9556 & 9868.46583850932 & -312.465838509318 \tabularnewline
\hline
\end{tabular}
%Source: https://freestatistics.org/blog/index.php?pk=103348&T=4

[TABLE]
[ROW][C]Multiple Linear Regression - Actuals, Interpolation, and Residuals[/C][/ROW]
[ROW][C]Time or Index[/C][C]Actuals[/C][C]InterpolationForecast[/C][C]ResidualsPrediction Error[/C][/ROW]
[ROW][C]1[/C][C]9700[/C][C]9449.248447205[/C][C]250.751552795006[/C][/ROW]
[ROW][C]2[/C][C]9081[/C][C]8717.10559006211[/C][C]363.894409937889[/C][/ROW]
[ROW][C]3[/C][C]9084[/C][C]9075.8198757764[/C][C]8.18012422360365[/C][/ROW]
[ROW][C]4[/C][C]9743[/C][C]9383.39751552795[/C][C]359.602484472051[/C][/ROW]
[ROW][C]5[/C][C]8587[/C][C]8505.89751552795[/C][C]81.1024844720503[/C][/ROW]
[ROW][C]6[/C][C]9731[/C][C]9472.39751552795[/C][C]258.602484472051[/C][/ROW]
[ROW][C]7[/C][C]9563[/C][C]9098.06418219462[/C][C]464.935817805384[/C][/ROW]
[ROW][C]8[/C][C]9998[/C][C]9277.39751552795[/C][C]720.60248447205[/C][/ROW]
[ROW][C]9[/C][C]9437[/C][C]9232.73084886128[/C][C]204.269151138717[/C][/ROW]
[ROW][C]10[/C][C]10039[/C][C]9808.06418219462[/C][C]230.935817805384[/C][/ROW]
[ROW][C]11[/C][C]9918[/C][C]9686.23084886128[/C][C]231.769151138717[/C][/ROW]
[ROW][C]12[/C][C]9252[/C][C]9462.73084886128[/C][C]-210.730848861283[/C][/ROW]
[ROW][C]13[/C][C]9737[/C][C]9581.35610766045[/C][C]155.643892339550[/C][/ROW]
[ROW][C]14[/C][C]9035[/C][C]8849.2132505176[/C][C]185.786749482402[/C][/ROW]
[ROW][C]15[/C][C]9133[/C][C]9207.92753623188[/C][C]-74.9275362318834[/C][/ROW]
[ROW][C]16[/C][C]9487[/C][C]9515.50517598344[/C][C]-28.5051759834363[/C][/ROW]
[ROW][C]17[/C][C]8700[/C][C]8638.00517598344[/C][C]61.9948240165638[/C][/ROW]
[ROW][C]18[/C][C]9627[/C][C]9604.50517598344[/C][C]22.4948240165637[/C][/ROW]
[ROW][C]19[/C][C]8947[/C][C]9230.1718426501[/C][C]-283.171842650103[/C][/ROW]
[ROW][C]20[/C][C]9283[/C][C]9409.50517598344[/C][C]-126.505175983436[/C][/ROW]
[ROW][C]21[/C][C]8829[/C][C]9364.83850931677[/C][C]-535.83850931677[/C][/ROW]
[ROW][C]22[/C][C]9947[/C][C]9940.1718426501[/C][C]6.82815734989703[/C][/ROW]
[ROW][C]23[/C][C]9628[/C][C]9818.33850931677[/C][C]-190.338509316770[/C][/ROW]
[ROW][C]24[/C][C]9318[/C][C]9594.83850931677[/C][C]-276.838509316770[/C][/ROW]
[ROW][C]25[/C][C]9605[/C][C]9713.46376811594[/C][C]-108.463768115937[/C][/ROW]
[ROW][C]26[/C][C]8640[/C][C]8981.32091097309[/C][C]-341.320910973085[/C][/ROW]
[ROW][C]27[/C][C]9214[/C][C]9340.03519668737[/C][C]-126.035196687370[/C][/ROW]
[ROW][C]28[/C][C]9567[/C][C]9647.61283643892[/C][C]-80.6128364389232[/C][/ROW]
[ROW][C]29[/C][C]8547[/C][C]8770.11283643892[/C][C]-223.112836438923[/C][/ROW]
[ROW][C]30[/C][C]9185[/C][C]9736.61283643892[/C][C]-551.612836438923[/C][/ROW]
[ROW][C]31[/C][C]9470[/C][C]9362.27950310559[/C][C]107.720496894410[/C][/ROW]
[ROW][C]32[/C][C]9123[/C][C]9541.61283643892[/C][C]-418.612836438923[/C][/ROW]
[ROW][C]33[/C][C]9278[/C][C]9496.94616977226[/C][C]-218.946169772257[/C][/ROW]
[ROW][C]34[/C][C]10170[/C][C]10072.2795031056[/C][C]97.7204968944101[/C][/ROW]
[ROW][C]35[/C][C]9434[/C][C]9950.44616977226[/C][C]-516.446169772257[/C][/ROW]
[ROW][C]36[/C][C]9655[/C][C]9726.94616977226[/C][C]-71.9461697722564[/C][/ROW]
[ROW][C]37[/C][C]9429[/C][C]9845.57142857142[/C][C]-416.571428571424[/C][/ROW]
[ROW][C]38[/C][C]8739[/C][C]9113.42857142857[/C][C]-374.428571428571[/C][/ROW]
[ROW][C]39[/C][C]9552[/C][C]9472.14285714286[/C][C]79.8571428571428[/C][/ROW]
[ROW][C]40[/C][C]9687[/C][C]9779.7204968944[/C][C]-92.7204968944101[/C][/ROW]
[ROW][C]41[/C][C]9019[/C][C]8902.22049689441[/C][C]116.77950310559[/C][/ROW]
[ROW][C]42[/C][C]9672[/C][C]9868.7204968944[/C][C]-196.72049689441[/C][/ROW]
[ROW][C]43[/C][C]9206[/C][C]9494.38716356108[/C][C]-288.387163561077[/C][/ROW]
[ROW][C]44[/C][C]9069[/C][C]9673.72049689441[/C][C]-604.72049689441[/C][/ROW]
[ROW][C]45[/C][C]9788[/C][C]9629.05383022774[/C][C]158.946169772256[/C][/ROW]
[ROW][C]46[/C][C]10312[/C][C]10204.3871635611[/C][C]107.612836438923[/C][/ROW]
[ROW][C]47[/C][C]10105[/C][C]10082.5538302277[/C][C]22.4461697722565[/C][/ROW]
[ROW][C]48[/C][C]9863[/C][C]9859.05383022774[/C][C]3.94616977225661[/C][/ROW]
[ROW][C]49[/C][C]9656[/C][C]9977.67908902691[/C][C]-321.679089026911[/C][/ROW]
[ROW][C]50[/C][C]9295[/C][C]9245.53623188406[/C][C]49.4637681159416[/C][/ROW]
[ROW][C]51[/C][C]9946[/C][C]9604.25051759834[/C][C]341.749482401656[/C][/ROW]
[ROW][C]52[/C][C]9701[/C][C]9911.8281573499[/C][C]-210.828157349897[/C][/ROW]
[ROW][C]53[/C][C]9049[/C][C]9034.3281573499[/C][C]14.6718426501029[/C][/ROW]
[ROW][C]54[/C][C]10190[/C][C]10000.8281573499[/C][C]189.171842650103[/C][/ROW]
[ROW][C]55[/C][C]9706[/C][C]9626.49482401656[/C][C]79.5051759834362[/C][/ROW]
[ROW][C]56[/C][C]9765[/C][C]9805.8281573499[/C][C]-40.8281573498971[/C][/ROW]
[ROW][C]57[/C][C]9893[/C][C]9761.16149068323[/C][C]131.838509316770[/C][/ROW]
[ROW][C]58[/C][C]9994[/C][C]10336.4948240166[/C][C]-342.494824016564[/C][/ROW]
[ROW][C]59[/C][C]10433[/C][C]10214.6614906832[/C][C]218.338509316770[/C][/ROW]
[ROW][C]60[/C][C]10073[/C][C]9991.16149068323[/C][C]81.8385093167697[/C][/ROW]
[ROW][C]61[/C][C]10112[/C][C]10109.7867494824[/C][C]2.21325051760193[/C][/ROW]
[ROW][C]62[/C][C]9266[/C][C]9377.64389233955[/C][C]-111.643892339545[/C][/ROW]
[ROW][C]63[/C][C]9820[/C][C]9736.35817805383[/C][C]83.6418219461689[/C][/ROW]
[ROW][C]64[/C][C]10097[/C][C]10043.9358178054[/C][C]53.064182194616[/C][/ROW]
[ROW][C]65[/C][C]9115[/C][C]9166.43581780538[/C][C]-51.4358178053838[/C][/ROW]
[ROW][C]66[/C][C]10411[/C][C]10132.9358178054[/C][C]278.064182194616[/C][/ROW]
[ROW][C]67[/C][C]9678[/C][C]9758.60248447205[/C][C]-80.6024844720507[/C][/ROW]
[ROW][C]68[/C][C]10408[/C][C]9937.93581780538[/C][C]470.064182194616[/C][/ROW]
[ROW][C]69[/C][C]10153[/C][C]9893.26915113872[/C][C]259.730848861283[/C][/ROW]
[ROW][C]70[/C][C]10368[/C][C]10468.6024844721[/C][C]-100.602484472051[/C][/ROW]
[ROW][C]71[/C][C]10581[/C][C]10346.7691511387[/C][C]234.230848861283[/C][/ROW]
[ROW][C]72[/C][C]10597[/C][C]10123.2691511387[/C][C]473.730848861283[/C][/ROW]
[ROW][C]73[/C][C]10680[/C][C]10241.8944099379[/C][C]438.105590062115[/C][/ROW]
[ROW][C]74[/C][C]9738[/C][C]9509.75155279503[/C][C]228.248447204968[/C][/ROW]
[ROW][C]75[/C][C]9556[/C][C]9868.46583850932[/C][C]-312.465838509318[/C][/ROW]
[/TABLE]
Source: https://freestatistics.org/blog/index.php?pk=103348&T=4

Globally Unique Identifier (entire table): ba.freestatistics.org/blog/index.php?pk=103348&T=4

As an alternative you can also use a QR Code:  

The GUIDs for individual cells are displayed in the table below:

Multiple Linear Regression - Actuals, Interpolation, and Residuals
Time or IndexActualsInterpolationForecastResidualsPrediction Error
197009449.248447205250.751552795006
290818717.10559006211363.894409937889
390849075.81987577648.18012422360365
497439383.39751552795359.602484472051
585878505.8975155279581.1024844720503
697319472.39751552795258.602484472051
795639098.06418219462464.935817805384
899989277.39751552795720.60248447205
994379232.73084886128204.269151138717
10100399808.06418219462230.935817805384
1199189686.23084886128231.769151138717
1292529462.73084886128-210.730848861283
1397379581.35610766045155.643892339550
1490358849.2132505176185.786749482402
1591339207.92753623188-74.9275362318834
1694879515.50517598344-28.5051759834363
1787008638.0051759834461.9948240165638
1896279604.5051759834422.4948240165637
1989479230.1718426501-283.171842650103
2092839409.50517598344-126.505175983436
2188299364.83850931677-535.83850931677
2299479940.17184265016.82815734989703
2396289818.33850931677-190.338509316770
2493189594.83850931677-276.838509316770
2596059713.46376811594-108.463768115937
2686408981.32091097309-341.320910973085
2792149340.03519668737-126.035196687370
2895679647.61283643892-80.6128364389232
2985478770.11283643892-223.112836438923
3091859736.61283643892-551.612836438923
3194709362.27950310559107.720496894410
3291239541.61283643892-418.612836438923
3392789496.94616977226-218.946169772257
341017010072.279503105697.7204968944101
3594349950.44616977226-516.446169772257
3696559726.94616977226-71.9461697722564
3794299845.57142857142-416.571428571424
3887399113.42857142857-374.428571428571
3995529472.1428571428679.8571428571428
4096879779.7204968944-92.7204968944101
4190198902.22049689441116.77950310559
4296729868.7204968944-196.72049689441
4392069494.38716356108-288.387163561077
4490699673.72049689441-604.72049689441
4597889629.05383022774158.946169772256
461031210204.3871635611107.612836438923
471010510082.553830227722.4461697722565
4898639859.053830227743.94616977225661
4996569977.67908902691-321.679089026911
5092959245.5362318840649.4637681159416
5199469604.25051759834341.749482401656
5297019911.8281573499-210.828157349897
5390499034.328157349914.6718426501029
541019010000.8281573499189.171842650103
5597069626.4948240165679.5051759834362
5697659805.8281573499-40.8281573498971
5798939761.16149068323131.838509316770
58999410336.4948240166-342.494824016564
591043310214.6614906832218.338509316770
60100739991.1614906832381.8385093167697
611011210109.78674948242.21325051760193
6292669377.64389233955-111.643892339545
6398209736.3581780538383.6418219461689
641009710043.935817805453.064182194616
6591159166.43581780538-51.4358178053838
661041110132.9358178054278.064182194616
6796789758.60248447205-80.6024844720507
68104089937.93581780538470.064182194616
69101539893.26915113872259.730848861283
701036810468.6024844721-100.602484472051
711058110346.7691511387234.230848861283
721059710123.2691511387473.730848861283
731068010241.8944099379438.105590062115
7497389509.75155279503228.248447204968
7595569868.46583850932-312.465838509318


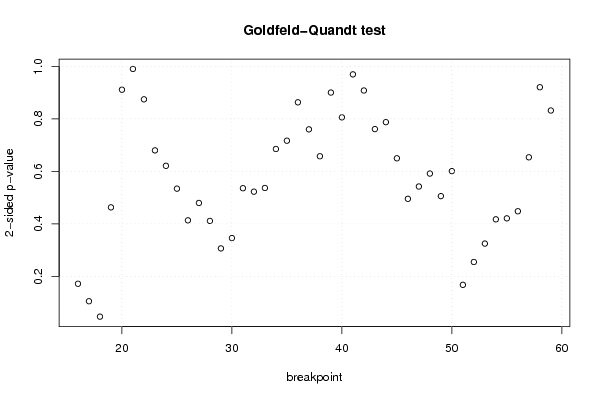
Goldfeld-Quandt test for Heteroskedasticity
p-valuesAlternative Hypothesis
breakpoint indexgreater2-sidedless
160.08579503247803170.1715900649560630.914204967521968
170.05249914236284870.1049982847256970.947500857637151
180.02310439656674660.04620879313349330.976895603433253
190.2314952102197710.4629904204395410.76850478978023
200.4557925362952260.9115850725904530.544207463704774
210.5046248547684930.9907502904630140.495375145231507
220.4374561287420040.8749122574840090.562543871257996
230.3401337454531520.6802674909063040.659866254546848
240.3106924552964030.6213849105928060.689307544703597
250.2671208096369140.5342416192738280.732879190363086
260.2067316873615170.4134633747230330.793268312638483
270.2398441421326920.4796882842653840.760155857867308
280.2055818949070570.4111637898141140.794418105092943
290.1532349142080510.3064698284161010.84676508579195
300.1729571352678700.3459142705357410.82704286473213
310.2679702442650790.5359404885301590.73202975573492
320.261370135996410.522740271992820.73862986400359
330.2684306721507490.5368613443014990.73156932784925
340.3427860198613890.6855720397227790.65721398013861
350.3585497015991770.7170994031983550.641450298400823
360.4317391985875080.8634783971750160.568260801412492
370.3801962932930680.7603925865861360.619803706706932
380.3289434898558020.6578869797116040.671056510144198
390.4503971848896520.9007943697793040.549602815110348
400.4030991246923390.8061982493846780.596900875307661
410.4850344567558990.9700689135117970.514965543244101
420.4542686411798320.9085372823596640.545731358820168
430.3807078483141690.7614156966283380.619292151685831
440.6060712383929270.7878575232141470.393928761607073
450.6749693725564270.6500612548871470.325030627443573
460.7522284372150170.4955431255699660.247771562784983
470.7287632416138850.5424735167722310.271236758386115
480.7041018157873260.5917963684253480.295898184212674
490.7470943492611840.5058113014776330.252905650738816
500.6993977353680260.6012045292639480.300602264631974
510.9162208474558450.1675583050883100.0837791525441551
520.8726819826347650.2546360347304710.127318017365235
530.8375832821634570.3248334356730850.162416717836543
540.791322090246710.4173558195065790.208677909753290
550.7894873491449870.4210253017100250.210512650855013
560.775930431173390.448139137653220.22406956882661
570.6730674062422740.6538651875154510.326932593757726
580.5394754003839790.9210491992320420.460524599616021
590.4161344713608410.8322689427216820.583865528639159

\begin{tabular}{lllllllll}
\hline
Goldfeld-Quandt test for Heteroskedasticity \tabularnewline
p-values & Alternative Hypothesis \tabularnewline
breakpoint index & greater & 2-sided & less \tabularnewline
16 & 0.0857950324780317 & 0.171590064956063 & 0.914204967521968 \tabularnewline
17 & 0.0524991423628487 & 0.104998284725697 & 0.947500857637151 \tabularnewline
18 & 0.0231043965667466 & 0.0462087931334933 & 0.976895603433253 \tabularnewline
19 & 0.231495210219771 & 0.462990420439541 & 0.76850478978023 \tabularnewline
20 & 0.455792536295226 & 0.911585072590453 & 0.544207463704774 \tabularnewline
21 & 0.504624854768493 & 0.990750290463014 & 0.495375145231507 \tabularnewline
22 & 0.437456128742004 & 0.874912257484009 & 0.562543871257996 \tabularnewline
23 & 0.340133745453152 & 0.680267490906304 & 0.659866254546848 \tabularnewline
24 & 0.310692455296403 & 0.621384910592806 & 0.689307544703597 \tabularnewline
25 & 0.267120809636914 & 0.534241619273828 & 0.732879190363086 \tabularnewline
26 & 0.206731687361517 & 0.413463374723033 & 0.793268312638483 \tabularnewline
27 & 0.239844142132692 & 0.479688284265384 & 0.760155857867308 \tabularnewline
28 & 0.205581894907057 & 0.411163789814114 & 0.794418105092943 \tabularnewline
29 & 0.153234914208051 & 0.306469828416101 & 0.84676508579195 \tabularnewline
30 & 0.172957135267870 & 0.345914270535741 & 0.82704286473213 \tabularnewline
31 & 0.267970244265079 & 0.535940488530159 & 0.73202975573492 \tabularnewline
32 & 0.26137013599641 & 0.52274027199282 & 0.73862986400359 \tabularnewline
33 & 0.268430672150749 & 0.536861344301499 & 0.73156932784925 \tabularnewline
34 & 0.342786019861389 & 0.685572039722779 & 0.65721398013861 \tabularnewline
35 & 0.358549701599177 & 0.717099403198355 & 0.641450298400823 \tabularnewline
36 & 0.431739198587508 & 0.863478397175016 & 0.568260801412492 \tabularnewline
37 & 0.380196293293068 & 0.760392586586136 & 0.619803706706932 \tabularnewline
38 & 0.328943489855802 & 0.657886979711604 & 0.671056510144198 \tabularnewline
39 & 0.450397184889652 & 0.900794369779304 & 0.549602815110348 \tabularnewline
40 & 0.403099124692339 & 0.806198249384678 & 0.596900875307661 \tabularnewline
41 & 0.485034456755899 & 0.970068913511797 & 0.514965543244101 \tabularnewline
42 & 0.454268641179832 & 0.908537282359664 & 0.545731358820168 \tabularnewline
43 & 0.380707848314169 & 0.761415696628338 & 0.619292151685831 \tabularnewline
44 & 0.606071238392927 & 0.787857523214147 & 0.393928761607073 \tabularnewline
45 & 0.674969372556427 & 0.650061254887147 & 0.325030627443573 \tabularnewline
46 & 0.752228437215017 & 0.495543125569966 & 0.247771562784983 \tabularnewline
47 & 0.728763241613885 & 0.542473516772231 & 0.271236758386115 \tabularnewline
48 & 0.704101815787326 & 0.591796368425348 & 0.295898184212674 \tabularnewline
49 & 0.747094349261184 & 0.505811301477633 & 0.252905650738816 \tabularnewline
50 & 0.699397735368026 & 0.601204529263948 & 0.300602264631974 \tabularnewline
51 & 0.916220847455845 & 0.167558305088310 & 0.0837791525441551 \tabularnewline
52 & 0.872681982634765 & 0.254636034730471 & 0.127318017365235 \tabularnewline
53 & 0.837583282163457 & 0.324833435673085 & 0.162416717836543 \tabularnewline
54 & 0.79132209024671 & 0.417355819506579 & 0.208677909753290 \tabularnewline
55 & 0.789487349144987 & 0.421025301710025 & 0.210512650855013 \tabularnewline
56 & 0.77593043117339 & 0.44813913765322 & 0.22406956882661 \tabularnewline
57 & 0.673067406242274 & 0.653865187515451 & 0.326932593757726 \tabularnewline
58 & 0.539475400383979 & 0.921049199232042 & 0.460524599616021 \tabularnewline
59 & 0.416134471360841 & 0.832268942721682 & 0.583865528639159 \tabularnewline
\hline
\end{tabular}
%Source: https://freestatistics.org/blog/index.php?pk=103348&T=5

[TABLE]
[ROW][C]Goldfeld-Quandt test for Heteroskedasticity[/C][/ROW]
[ROW][C]p-values[/C][C]Alternative Hypothesis[/C][/ROW]
[ROW][C]breakpoint index[/C][C]greater[/C][C]2-sided[/C][C]less[/C][/ROW]
[ROW][C]16[/C][C]0.0857950324780317[/C][C]0.171590064956063[/C][C]0.914204967521968[/C][/ROW]
[ROW][C]17[/C][C]0.0524991423628487[/C][C]0.104998284725697[/C][C]0.947500857637151[/C][/ROW]
[ROW][C]18[/C][C]0.0231043965667466[/C][C]0.0462087931334933[/C][C]0.976895603433253[/C][/ROW]
[ROW][C]19[/C][C]0.231495210219771[/C][C]0.462990420439541[/C][C]0.76850478978023[/C][/ROW]
[ROW][C]20[/C][C]0.455792536295226[/C][C]0.911585072590453[/C][C]0.544207463704774[/C][/ROW]
[ROW][C]21[/C][C]0.504624854768493[/C][C]0.990750290463014[/C][C]0.495375145231507[/C][/ROW]
[ROW][C]22[/C][C]0.437456128742004[/C][C]0.874912257484009[/C][C]0.562543871257996[/C][/ROW]
[ROW][C]23[/C][C]0.340133745453152[/C][C]0.680267490906304[/C][C]0.659866254546848[/C][/ROW]
[ROW][C]24[/C][C]0.310692455296403[/C][C]0.621384910592806[/C][C]0.689307544703597[/C][/ROW]
[ROW][C]25[/C][C]0.267120809636914[/C][C]0.534241619273828[/C][C]0.732879190363086[/C][/ROW]
[ROW][C]26[/C][C]0.206731687361517[/C][C]0.413463374723033[/C][C]0.793268312638483[/C][/ROW]
[ROW][C]27[/C][C]0.239844142132692[/C][C]0.479688284265384[/C][C]0.760155857867308[/C][/ROW]
[ROW][C]28[/C][C]0.205581894907057[/C][C]0.411163789814114[/C][C]0.794418105092943[/C][/ROW]
[ROW][C]29[/C][C]0.153234914208051[/C][C]0.306469828416101[/C][C]0.84676508579195[/C][/ROW]
[ROW][C]30[/C][C]0.172957135267870[/C][C]0.345914270535741[/C][C]0.82704286473213[/C][/ROW]
[ROW][C]31[/C][C]0.267970244265079[/C][C]0.535940488530159[/C][C]0.73202975573492[/C][/ROW]
[ROW][C]32[/C][C]0.26137013599641[/C][C]0.52274027199282[/C][C]0.73862986400359[/C][/ROW]
[ROW][C]33[/C][C]0.268430672150749[/C][C]0.536861344301499[/C][C]0.73156932784925[/C][/ROW]
[ROW][C]34[/C][C]0.342786019861389[/C][C]0.685572039722779[/C][C]0.65721398013861[/C][/ROW]
[ROW][C]35[/C][C]0.358549701599177[/C][C]0.717099403198355[/C][C]0.641450298400823[/C][/ROW]
[ROW][C]36[/C][C]0.431739198587508[/C][C]0.863478397175016[/C][C]0.568260801412492[/C][/ROW]
[ROW][C]37[/C][C]0.380196293293068[/C][C]0.760392586586136[/C][C]0.619803706706932[/C][/ROW]
[ROW][C]38[/C][C]0.328943489855802[/C][C]0.657886979711604[/C][C]0.671056510144198[/C][/ROW]
[ROW][C]39[/C][C]0.450397184889652[/C][C]0.900794369779304[/C][C]0.549602815110348[/C][/ROW]
[ROW][C]40[/C][C]0.403099124692339[/C][C]0.806198249384678[/C][C]0.596900875307661[/C][/ROW]
[ROW][C]41[/C][C]0.485034456755899[/C][C]0.970068913511797[/C][C]0.514965543244101[/C][/ROW]
[ROW][C]42[/C][C]0.454268641179832[/C][C]0.908537282359664[/C][C]0.545731358820168[/C][/ROW]
[ROW][C]43[/C][C]0.380707848314169[/C][C]0.761415696628338[/C][C]0.619292151685831[/C][/ROW]
[ROW][C]44[/C][C]0.606071238392927[/C][C]0.787857523214147[/C][C]0.393928761607073[/C][/ROW]
[ROW][C]45[/C][C]0.674969372556427[/C][C]0.650061254887147[/C][C]0.325030627443573[/C][/ROW]
[ROW][C]46[/C][C]0.752228437215017[/C][C]0.495543125569966[/C][C]0.247771562784983[/C][/ROW]
[ROW][C]47[/C][C]0.728763241613885[/C][C]0.542473516772231[/C][C]0.271236758386115[/C][/ROW]
[ROW][C]48[/C][C]0.704101815787326[/C][C]0.591796368425348[/C][C]0.295898184212674[/C][/ROW]
[ROW][C]49[/C][C]0.747094349261184[/C][C]0.505811301477633[/C][C]0.252905650738816[/C][/ROW]
[ROW][C]50[/C][C]0.699397735368026[/C][C]0.601204529263948[/C][C]0.300602264631974[/C][/ROW]
[ROW][C]51[/C][C]0.916220847455845[/C][C]0.167558305088310[/C][C]0.0837791525441551[/C][/ROW]
[ROW][C]52[/C][C]0.872681982634765[/C][C]0.254636034730471[/C][C]0.127318017365235[/C][/ROW]
[ROW][C]53[/C][C]0.837583282163457[/C][C]0.324833435673085[/C][C]0.162416717836543[/C][/ROW]
[ROW][C]54[/C][C]0.79132209024671[/C][C]0.417355819506579[/C][C]0.208677909753290[/C][/ROW]
[ROW][C]55[/C][C]0.789487349144987[/C][C]0.421025301710025[/C][C]0.210512650855013[/C][/ROW]
[ROW][C]56[/C][C]0.77593043117339[/C][C]0.44813913765322[/C][C]0.22406956882661[/C][/ROW]
[ROW][C]57[/C][C]0.673067406242274[/C][C]0.653865187515451[/C][C]0.326932593757726[/C][/ROW]
[ROW][C]58[/C][C]0.539475400383979[/C][C]0.921049199232042[/C][C]0.460524599616021[/C][/ROW]
[ROW][C]59[/C][C]0.416134471360841[/C][C]0.832268942721682[/C][C]0.583865528639159[/C][/ROW]
[/TABLE]
Source: https://freestatistics.org/blog/index.php?pk=103348&T=5

Globally Unique Identifier (entire table): ba.freestatistics.org/blog/index.php?pk=103348&T=5

As an alternative you can also use a QR Code:  

The GUIDs for individual cells are displayed in the table below:

Goldfeld-Quandt test for Heteroskedasticity
p-valuesAlternative Hypothesis
breakpoint indexgreater2-sidedless
160.08579503247803170.1715900649560630.914204967521968
170.05249914236284870.1049982847256970.947500857637151
180.02310439656674660.04620879313349330.976895603433253
190.2314952102197710.4629904204395410.76850478978023
200.4557925362952260.9115850725904530.544207463704774
210.5046248547684930.9907502904630140.495375145231507
220.4374561287420040.8749122574840090.562543871257996
230.3401337454531520.6802674909063040.659866254546848
240.3106924552964030.6213849105928060.689307544703597
250.2671208096369140.5342416192738280.732879190363086
260.2067316873615170.4134633747230330.793268312638483
270.2398441421326920.4796882842653840.760155857867308
280.2055818949070570.4111637898141140.794418105092943
290.1532349142080510.3064698284161010.84676508579195
300.1729571352678700.3459142705357410.82704286473213
310.2679702442650790.5359404885301590.73202975573492
320.261370135996410.522740271992820.73862986400359
330.2684306721507490.5368613443014990.73156932784925
340.3427860198613890.6855720397227790.65721398013861
350.3585497015991770.7170994031983550.641450298400823
360.4317391985875080.8634783971750160.568260801412492
370.3801962932930680.7603925865861360.619803706706932
380.3289434898558020.6578869797116040.671056510144198
390.4503971848896520.9007943697793040.549602815110348
400.4030991246923390.8061982493846780.596900875307661
410.4850344567558990.9700689135117970.514965543244101
420.4542686411798320.9085372823596640.545731358820168
430.3807078483141690.7614156966283380.619292151685831
440.6060712383929270.7878575232141470.393928761607073
450.6749693725564270.6500612548871470.325030627443573
460.7522284372150170.4955431255699660.247771562784983
470.7287632416138850.5424735167722310.271236758386115
480.7041018157873260.5917963684253480.295898184212674
490.7470943492611840.5058113014776330.252905650738816
500.6993977353680260.6012045292639480.300602264631974
510.9162208474558450.1675583050883100.0837791525441551
520.8726819826347650.2546360347304710.127318017365235
530.8375832821634570.3248334356730850.162416717836543
540.791322090246710.4173558195065790.208677909753290
550.7894873491449870.4210253017100250.210512650855013
560.775930431173390.448139137653220.22406956882661
570.6730674062422740.6538651875154510.326932593757726
580.5394754003839790.9210491992320420.460524599616021
590.4161344713608410.8322689427216820.583865528639159


Meta Analysis of Goldfeld-Quandt test for Heteroskedasticity
Description# significant tests% significant testsOK/NOK
1% type I error level00OK
5% type I error level10.0227272727272727OK
10% type I error level10.0227272727272727OK

\begin{tabular}{lllllllll}
\hline
Meta Analysis of Goldfeld-Quandt test for Heteroskedasticity \tabularnewline
Description & # significant tests & % significant tests & OK/NOK \tabularnewline
1% type I error level & 0 & 0 & OK \tabularnewline
5% type I error level & 1 & 0.0227272727272727 & OK \tabularnewline
10% type I error level & 1 & 0.0227272727272727 & OK \tabularnewline
\hline
\end{tabular}
%Source: https://freestatistics.org/blog/index.php?pk=103348&T=6

[TABLE]
[ROW][C]Meta Analysis of Goldfeld-Quandt test for Heteroskedasticity[/C][/ROW]
[ROW][C]Description[/C][C]# significant tests[/C][C]% significant tests[/C][C]OK/NOK[/C][/ROW]
[ROW][C]1% type I error level[/C][C]0[/C][C]0[/C][C]OK[/C][/ROW]
[ROW][C]5% type I error level[/C][C]1[/C][C]0.0227272727272727[/C][C]OK[/C][/ROW]
[ROW][C]10% type I error level[/C][C]1[/C][C]0.0227272727272727[/C][C]OK[/C][/ROW]
[/TABLE]
Source: https://freestatistics.org/blog/index.php?pk=103348&T=6

Globally Unique Identifier (entire table): ba.freestatistics.org/blog/index.php?pk=103348&T=6

As an alternative you can also use a QR Code:  

The GUIDs for individual cells are displayed in the table below:

Meta Analysis of Goldfeld-Quandt test for Heteroskedasticity
Description# significant tests% significant testsOK/NOK
1% type I error level00OK
5% type I error level10.0227272727272727OK
10% type I error level10.0227272727272727OK


Parameters (Session):
par1 = 1 ; par2 = Include Monthly Dummies ; par3 = Linear Trend ;
Parameters (R input):
par1 = 1 ; par2 = Include Monthly Dummies ; par3 = Linear Trend ;
R code (references can be found in the software module):
library(lattice)
library(lmtest)
n25 <- 25 #minimum number of obs. for Goldfeld-Quandt test
par1 <- as.numeric(par1)
x <- t(y)
k <- length(x[1,])
n <- length(x[,1])
x1 <- cbind(x[,par1], x[,1:k!=par1])
mycolnames <- c(colnames(x)[par1], colnames(x)[1:k!=par1])
colnames(x1) <- mycolnames #colnames(x)[par1]
x <- x1
if (par3 == 'First Differences'){
x2 <- array(0, dim=c(n-1,k), dimnames=list(1:(n-1), paste('(1-B)',colnames(x),sep='')))
for (i in 1:n-1) {
for (j in 1:k) {
x2[i,j] <- x[i+1,j] - x[i,j]
}
}
x <- x2
}
if (par2 == 'Include Monthly Dummies'){
x2 <- array(0, dim=c(n,11), dimnames=list(1:n, paste('M', seq(1:11), sep ='')))
for (i in 1:11){
x2[seq(i,n,12),i] <- 1
}
x <- cbind(x, x2)
}
if (par2 == 'Include Quarterly Dummies'){
x2 <- array(0, dim=c(n,3), dimnames=list(1:n, paste('Q', seq(1:3), sep ='')))
for (i in 1:3){
x2[seq(i,n,4),i] <- 1
}
x <- cbind(x, x2)
}
k <- length(x[1,])
if (par3 == 'Linear Trend'){
x <- cbind(x, c(1:n))
colnames(x)[k+1] <- 't'
}
x
k <- length(x[1,])
df <- as.data.frame(x)
(mylm <- lm(df))
(mysum <- summary(mylm))
if (n > n25) {
kp3 <- k + 3
nmkm3 <- n - k - 3
gqarr <- array(NA, dim=c(nmkm3-kp3+1,3))
numgqtests <- 0
numsignificant1 <- 0
numsignificant5 <- 0
numsignificant10 <- 0
for (mypoint in kp3:nmkm3) {
j <- 0
numgqtests <- numgqtests + 1
for (myalt in c('greater', 'two.sided', 'less')) {
j <- j + 1
gqarr[mypoint-kp3+1,j] <- gqtest(mylm, point=mypoint, alternative=myalt)$p.value
}
if (gqarr[mypoint-kp3+1,2] < 0.01) numsignificant1 <- numsignificant1 + 1
if (gqarr[mypoint-kp3+1,2] < 0.05) numsignificant5 <- numsignificant5 + 1
if (gqarr[mypoint-kp3+1,2] < 0.10) numsignificant10 <- numsignificant10 + 1
}
gqarr
}
bitmap(file='test0.png')
plot(x[,1], type='l', main='Actuals and Interpolation', ylab='value of Actuals and Interpolation (dots)', xlab='time or index')
points(x[,1]-mysum$resid)
grid()
dev.off()
bitmap(file='test1.png')
plot(mysum$resid, type='b', pch=19, main='Residuals', ylab='value of Residuals', xlab='time or index')
grid()
dev.off()
bitmap(file='test2.png')
hist(mysum$resid, main='Residual Histogram', xlab='values of Residuals')
grid()
dev.off()
bitmap(file='test3.png')
densityplot(~mysum$resid,col='black',main='Residual Density Plot', xlab='values of Residuals')
dev.off()
bitmap(file='test4.png')
qqnorm(mysum$resid, main='Residual Normal Q-Q Plot')
qqline(mysum$resid)
grid()
dev.off()
(myerror <- as.ts(mysum$resid))
bitmap(file='test5.png')
dum <- cbind(lag(myerror,k=1),myerror)
dum
dum1 <- dum[2:length(myerror),]
dum1
z <- as.data.frame(dum1)
z
plot(z,main=paste('Residual Lag plot, lowess, and regression line'), ylab='values of Residuals', xlab='lagged values of Residuals')
lines(lowess(z))
abline(lm(z))
grid()
dev.off()
bitmap(file='test6.png')
acf(mysum$resid, lag.max=length(mysum$resid)/2, main='Residual Autocorrelation Function')
grid()
dev.off()
bitmap(file='test7.png')
pacf(mysum$resid, lag.max=length(mysum$resid)/2, main='Residual Partial Autocorrelation Function')
grid()
dev.off()
bitmap(file='test8.png')
opar <- par(mfrow = c(2,2), oma = c(0, 0, 1.1, 0))
plot(mylm, las = 1, sub='Residual Diagnostics')
par(opar)
dev.off()
if (n > n25) {
bitmap(file='test9.png')
plot(kp3:nmkm3,gqarr[,2], main='Goldfeld-Quandt test',ylab='2-sided p-value',xlab='breakpoint')
grid()
dev.off()
}
load(file='createtable')
a<-table.start()
a<-table.row.start(a)
a<-table.element(a, 'Multiple Linear Regression - Estimated Regression Equation', 1, TRUE)
a<-table.row.end(a)
myeq <- colnames(x)[1]
myeq <- paste(myeq, '[t] = ', sep='')
for (i in 1:k){
if (mysum$coefficients[i,1] > 0) myeq <- paste(myeq, '+', '')
myeq <- paste(myeq, mysum$coefficients[i,1], sep=' ')
if (rownames(mysum$coefficients)[i] != '(Intercept)') {
myeq <- paste(myeq, rownames(mysum$coefficients)[i], sep='')
if (rownames(mysum$coefficients)[i] != 't') myeq <- paste(myeq, '[t]', sep='')
}
}
myeq <- paste(myeq, ' + e[t]')
a<-table.row.start(a)
a<-table.element(a, myeq)
a<-table.row.end(a)
a<-table.end(a)
table.save(a,file='mytable1.tab')
a<-table.start()
a<-table.row.start(a)
a<-table.element(a,hyperlink('ols1.htm','Multiple Linear Regression - Ordinary Least Squares',''), 6, TRUE)
a<-table.row.end(a)
a<-table.row.start(a)
a<-table.element(a,'Variable',header=TRUE)
a<-table.element(a,'Parameter',header=TRUE)
a<-table.element(a,'S.D.',header=TRUE)
a<-table.element(a,'T-STAT
H0: parameter = 0',header=TRUE)
a<-table.element(a,'2-tail p-value',header=TRUE)
a<-table.element(a,'1-tail p-value',header=TRUE)
a<-table.row.end(a)
for (i in 1:k){
a<-table.row.start(a)
a<-table.element(a,rownames(mysum$coefficients)[i],header=TRUE)
a<-table.element(a,mysum$coefficients[i,1])
a<-table.element(a, round(mysum$coefficients[i,2],6))
a<-table.element(a, round(mysum$coefficients[i,3],4))
a<-table.element(a, round(mysum$coefficients[i,4],6))
a<-table.element(a, round(mysum$coefficients[i,4]/2,6))
a<-table.row.end(a)
}
a<-table.end(a)
table.save(a,file='mytable2.tab')
a<-table.start()
a<-table.row.start(a)
a<-table.element(a, 'Multiple Linear Regression - Regression Statistics', 2, TRUE)
a<-table.row.end(a)
a<-table.row.start(a)
a<-table.element(a, 'Multiple R',1,TRUE)
a<-table.element(a, sqrt(mysum$r.squared))
a<-table.row.end(a)
a<-table.row.start(a)
a<-table.element(a, 'R-squared',1,TRUE)
a<-table.element(a, mysum$r.squared)
a<-table.row.end(a)
a<-table.row.start(a)
a<-table.element(a, 'Adjusted R-squared',1,TRUE)
a<-table.element(a, mysum$adj.r.squared)
a<-table.row.end(a)
a<-table.row.start(a)
a<-table.element(a, 'F-TEST (value)',1,TRUE)
a<-table.element(a, mysum$fstatistic[1])
a<-table.row.end(a)
a<-table.row.start(a)
a<-table.element(a, 'F-TEST (DF numerator)',1,TRUE)
a<-table.element(a, mysum$fstatistic[2])
a<-table.row.end(a)
a<-table.row.start(a)
a<-table.element(a, 'F-TEST (DF denominator)',1,TRUE)
a<-table.element(a, mysum$fstatistic[3])
a<-table.row.end(a)
a<-table.row.start(a)
a<-table.element(a, 'p-value',1,TRUE)
a<-table.element(a, 1-pf(mysum$fstatistic[1],mysum$fstatistic[2],mysum$fstatistic[3]))
a<-table.row.end(a)
a<-table.row.start(a)
a<-table.element(a, 'Multiple Linear Regression - Residual Statistics', 2, TRUE)
a<-table.row.end(a)
a<-table.row.start(a)
a<-table.element(a, 'Residual Standard Deviation',1,TRUE)
a<-table.element(a, mysum$sigma)
a<-table.row.end(a)
a<-table.row.start(a)
a<-table.element(a, 'Sum Squared Residuals',1,TRUE)
a<-table.element(a, sum(myerror*myerror))
a<-table.row.end(a)
a<-table.end(a)
table.save(a,file='mytable3.tab')
a<-table.start()
a<-table.row.start(a)
a<-table.element(a, 'Multiple Linear Regression - Actuals, Interpolation, and Residuals', 4, TRUE)
a<-table.row.end(a)
a<-table.row.start(a)
a<-table.element(a, 'Time or Index', 1, TRUE)
a<-table.element(a, 'Actuals', 1, TRUE)
a<-table.element(a, 'Interpolation
Forecast', 1, TRUE)
a<-table.element(a, 'Residuals
Prediction Error', 1, TRUE)
a<-table.row.end(a)
for (i in 1:n) {
a<-table.row.start(a)
a<-table.element(a,i, 1, TRUE)
a<-table.element(a,x[i])
a<-table.element(a,x[i]-mysum$resid[i])
a<-table.element(a,mysum$resid[i])
a<-table.row.end(a)
}
a<-table.end(a)
table.save(a,file='mytable4.tab')
if (n > n25) {
a<-table.start()
a<-table.row.start(a)
a<-table.element(a,'Goldfeld-Quandt test for Heteroskedasticity',4,TRUE)
a<-table.row.end(a)
a<-table.row.start(a)
a<-table.element(a,'p-values',header=TRUE)
a<-table.element(a,'Alternative Hypothesis',3,header=TRUE)
a<-table.row.end(a)
a<-table.row.start(a)
a<-table.element(a,'breakpoint index',header=TRUE)
a<-table.element(a,'greater',header=TRUE)
a<-table.element(a,'2-sided',header=TRUE)
a<-table.element(a,'less',header=TRUE)
a<-table.row.end(a)
for (mypoint in kp3:nmkm3) {
a<-table.row.start(a)
a<-table.element(a,mypoint,header=TRUE)
a<-table.element(a,gqarr[mypoint-kp3+1,1])
a<-table.element(a,gqarr[mypoint-kp3+1,2])
a<-table.element(a,gqarr[mypoint-kp3+1,3])
a<-table.row.end(a)
}
a<-table.end(a)
table.save(a,file='mytable5.tab')
a<-table.start()
a<-table.row.start(a)
a<-table.element(a,'Meta Analysis of Goldfeld-Quandt test for Heteroskedasticity',4,TRUE)
a<-table.row.end(a)
a<-table.row.start(a)
a<-table.element(a,'Description',header=TRUE)
a<-table.element(a,'# significant tests',header=TRUE)
a<-table.element(a,'% significant tests',header=TRUE)
a<-table.element(a,'OK/NOK',header=TRUE)
a<-table.row.end(a)
a<-table.row.start(a)
a<-table.element(a,'1% type I error level',header=TRUE)
a<-table.element(a,numsignificant1)
a<-table.element(a,numsignificant1/numgqtests)
if (numsignificant1/numgqtests < 0.01) dum <- 'OK' else dum <- 'NOK'
a<-table.element(a,dum)
a<-table.row.end(a)
a<-table.row.start(a)
a<-table.element(a,'5% type I error level',header=TRUE)
a<-table.element(a,numsignificant5)
a<-table.element(a,numsignificant5/numgqtests)
if (numsignificant5/numgqtests < 0.05) dum <- 'OK' else dum <- 'NOK'
a<-table.element(a,dum)
a<-table.row.end(a)
a<-table.row.start(a)
a<-table.element(a,'10% type I error level',header=TRUE)
a<-table.element(a,numsignificant10)
a<-table.element(a,numsignificant10/numgqtests)
if (numsignificant10/numgqtests < 0.1) dum <- 'OK' else dum <- 'NOK'
a<-table.element(a,dum)
a<-table.row.end(a)
a<-table.end(a)
table.save(a,file='mytable6.tab')
}