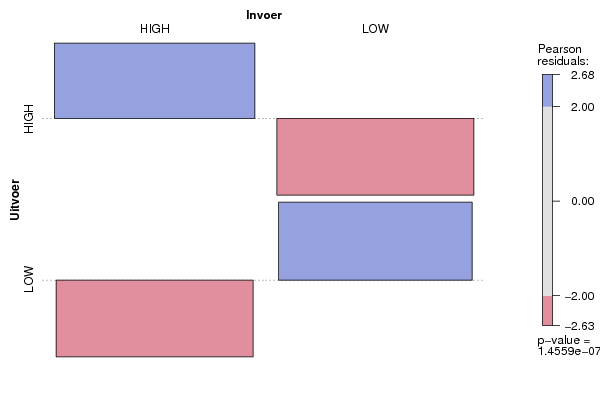
| Tabulation of Results | ||
| Uitvoer x Invoer | ||
| HIGH | LOW | HIGH | 24 | 4 | LOW | 4 | 23 |
| Tabulation of Expected Results | ||
| Uitvoer x Invoer | ||
| HIGH | LOW | HIGH | 14.25 | 13.75 | LOW | 13.75 | 13.25 |
| Statistical Results | |
| Pearson's Chi-squared test with Yates' continuity correction | |
| Chi Square Statistic | 24.88 |
| Degrees of Freedom | 1 |
| P value | 0 |