| Tabulation of Results | ||||
| Uitvoer x Invoer | ||||
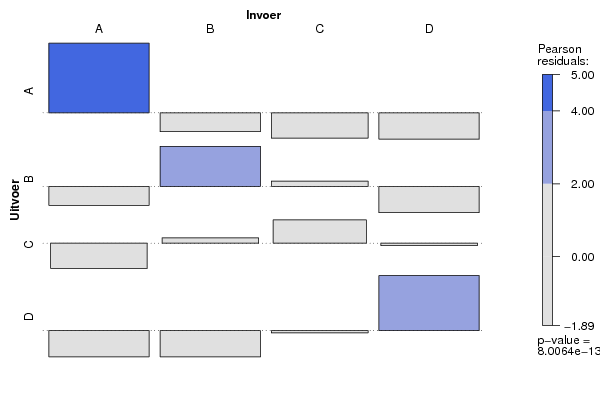
| A | B | C | D | A | 13 | 1 | 0 | 0 | B | 1 | 9 | 4 | 0 | C | 0 | 4 | 6 | 3 | D | 0 | 0 | 3 | 11 |
| Tabulation of Expected Results | ||||
| Uitvoer x Invoer | ||||
| A | B | C | D | A | 3.56 | 3.56 | 3.31 | 3.56 | B | 3.56 | 3.56 | 3.31 | 3.56 | C | 3.31 | 3.31 | 3.07 | 3.31 | D | 3.56 | 3.56 | 3.31 | 3.56 |
| Statistical Results | |
| Pearson's Chi-squared test with simulated p-value (based on 2000 replicates) | |
| Chi Square Statistic | 76.49 |
| P value | 0 |