| Multiple Linear Regression - Estimated Regression Equation |
| CVI[t] = + 0.0799791163793411 + 26.4477403759069Maand[t] + 0.253996016630743Econ.Sit.[t] -0.253388443883417Werkloos[t] + 0.27108634384964Fin.Sit.[t] + 0.219859137240139`Spaarverm. `[t] + e[t] |
| Multiple Linear Regression - Ordinary Least Squares | |||||
| Variable | Parameter | S.D. | T-STAT H0: parameter = 0 | 2-tail p-value | 1-tail p-value |
| (Intercept) | 0.0799791163793411 | 0.112782 | 0.7091 | 0.48123 | 0.240615 |
| Maand | 26.4477403759069 | 10.181234 | 2.5977 | 0.012019 | 0.00601 |
| Econ.Sit. | 0.253996016630743 | 0.005916 | 42.933 | 0 | 0 |
| Werkloos | -0.253388443883417 | 0.0019 | -133.3855 | 0 | 0 |
| Fin.Sit. | 0.27108634384964 | 0.030192 | 8.9789 | 0 | 0 |
| `Spaarverm. ` | 0.219859137240139 | 0.014011 | 15.6918 | 0 | 0 |
| Multiple Linear Regression - Regression Statistics | |
| Multiple R | 0.999264848251209 |
| R-squared | 0.99853023695051 |
| Adjusted R-squared | 0.99839662212783 |
| F-TEST (value) | 7473.19958157405 |
| F-TEST (DF numerator) | 5 |
| F-TEST (DF denominator) | 55 |
| p-value | 0 |
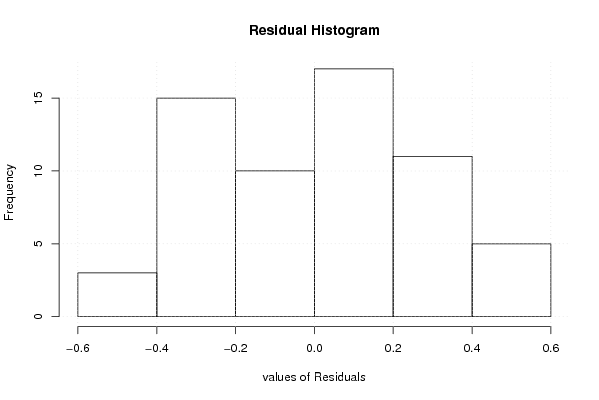
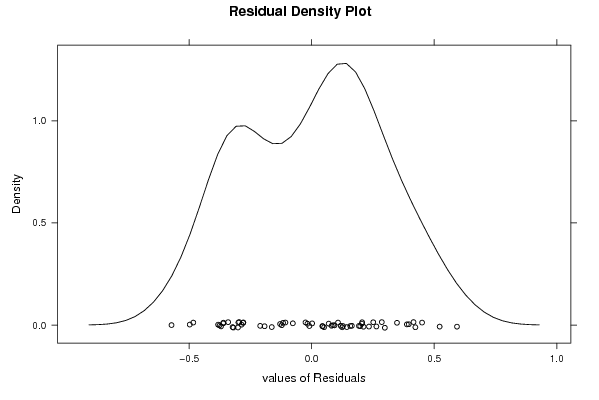
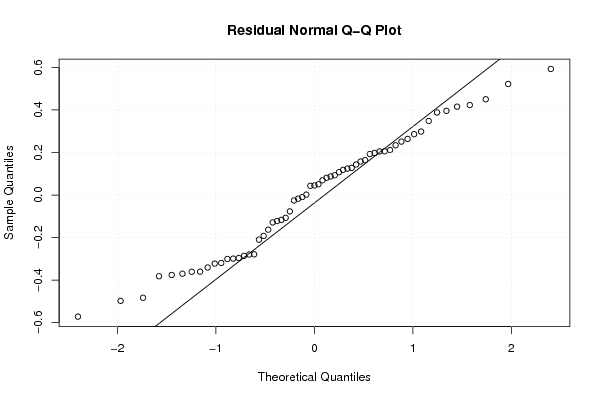
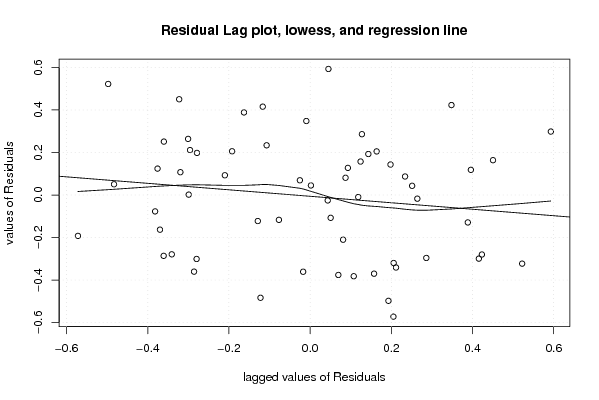
| Multiple Linear Regression - Residual Statistics | |
| Residual Standard Deviation | 0.296240131543268 |
| Sum Squared Residuals | 4.8267018545225 |
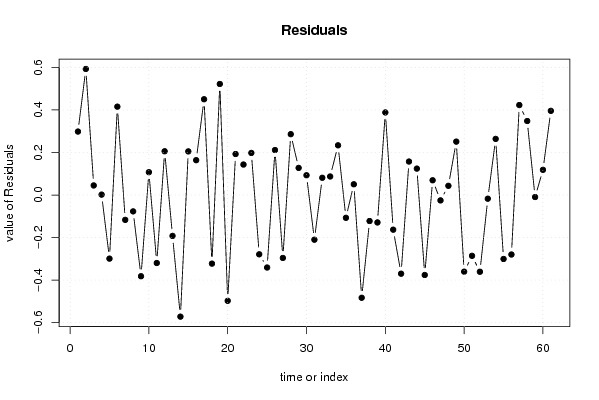
| Multiple Linear Regression - Actuals, Interpolation, and Residuals | |||
| Time or Index | Actuals | Interpolation Forecast | Residuals Prediction Error |
| 1 | 0 | -0.298443113300859 | 0.298443113300859 |
| 2 | -2 | -2.59290400347121 | 0.59290400347121 |
| 3 | -4 | -4.04497232815689 | 0.0449723281568858 |
| 4 | -4 | -4.00188543730525 | 0.00188543730525317 |
| 5 | -7 | -6.70080708127515 | -0.299192918724847 |
| 6 | -9 | -9.4155111392448 | 0.415511139244800 |
| 7 | -13 | -12.8831826833631 | -0.116817316636904 |
| 8 | -8 | -7.92303841420467 | -0.0769615857953326 |
| 9 | -13 | -12.6180411477377 | -0.381958852262333 |
| 10 | -15 | -15.1073685055433 | 0.107368505543285 |
| 11 | -15 | -14.6802609913144 | -0.319739008685614 |
| 12 | -15 | -15.2057382173966 | 0.205738217396625 |
| 13 | -10 | -9.80768515302496 | -0.192314846975036 |
| 14 | -12 | -11.4279499290903 | -0.57205007090969 |
| 15 | -11 | -11.2050628200477 | 0.205062820047663 |
| 16 | -11 | -11.1637950997560 | 0.16379509975597 |
| 17 | -17 | -17.4504077143517 | 0.450407714351686 |
| 18 | -18 | -17.6773166923808 | -0.322683307619162 |
| 19 | -19 | -19.5221953004994 | 0.522195300499415 |
| 20 | -22 | -21.502348738292 | -0.497651261707988 |
| 21 | -24 | -24.1928276206436 | 0.192827620643640 |
| 22 | -24 | -24.1432983924637 | 0.143298392463668 |
| 23 | -20 | -20.1979176186426 | 0.197917618642585 |
| 24 | -25 | -24.7211537203774 | -0.278846279622633 |
| 25 | -22 | -21.6590759231176 | -0.340924076882425 |
| 26 | -17 | -17.2114604930822 | 0.211460493082190 |
| 27 | -9 | -8.70404374622848 | -0.295956253771521 |
| 28 | -11 | -11.2860880357535 | 0.286088035753545 |
| 29 | -13 | -13.1275167850430 | 0.127516785043033 |
| 30 | -11 | -11.0929266173394 | 0.0929266173393619 |
| 31 | -9 | -8.78985434953824 | -0.210145650461761 |
| 32 | -7 | -7.08110917545737 | 0.0811091754573694 |
| 33 | -3 | -3.08712577075176 | 0.0871257707517571 |
| 34 | -3 | -3.23375572087212 | 0.233755720872118 |
| 35 | -6 | -5.89275734125917 | -0.107242658740825 |
| 36 | -4 | -4.05050255379564 | 0.0505025537956398 |
| 37 | -8 | -7.51679938761318 | -0.483200612386816 |
| 38 | -1 | -0.877642004194529 | -0.122357995805471 |
| 39 | -2 | -1.87103064462637 | -0.128969355373631 |
| 40 | -2 | -2.38836748548833 | 0.388367485488334 |
| 41 | -1 | -0.836968369924042 | -0.163031630075958 |
| 42 | 1 | 1.3699904650592 | -0.3699904650592 |
| 43 | 2 | 1.84261236444202 | 0.157387635557976 |
| 44 | 2 | 1.87580459169011 | 0.124195408309894 |
| 45 | -1 | -0.624010506096923 | -0.375989493903077 |
| 46 | 1 | 0.930629878357439 | 0.0693701216425612 |
| 47 | -1 | -0.974636845616245 | -0.0253631543837553 |
| 48 | -8 | -8.04328694025541 | 0.0432869402554104 |
| 49 | 1 | 0.748799075644756 | 0.251200924355244 |
| 50 | 2 | 2.36039337696585 | -0.360393376965846 |
| 51 | -2 | -1.71395521421972 | -0.286044785780283 |
| 52 | -2 | -1.63910374796901 | -0.360896252030986 |
| 53 | -2 | -1.98274378671843 | -0.0172562132815725 |
| 54 | -2 | -2.26395035992353 | 0.263950359923532 |
| 55 | -6 | -5.69927625795652 | -0.300723742043484 |
| 56 | -4 | -3.72022121447945 | -0.27977878552055 |
| 57 | -5 | -5.4230554495174 | 0.423055449517398 |
| 58 | -2 | -2.34806031481857 | 0.348060314818572 |
| 59 | -1 | -0.990494356211112 | -0.00950564378888785 |
| 60 | -5 | -5.11842038023906 | 0.118420380239059 |
| 61 | -9 | -9.39587811216905 | 0.395878112169048 |
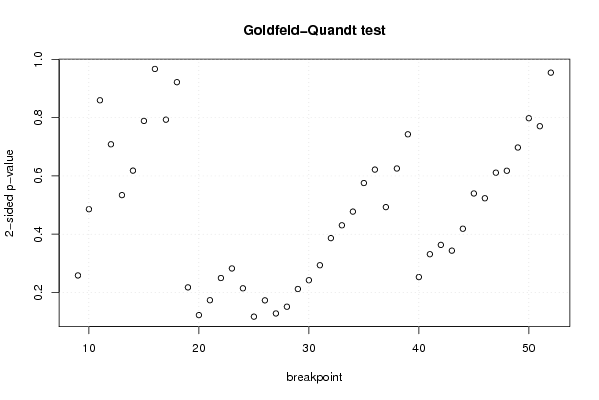
| Goldfeld-Quandt test for Heteroskedasticity | |||
| p-values | Alternative Hypothesis | ||
| breakpoint index | greater | 2-sided | less |
| 9 | 0.129279904168142 | 0.258559808336284 | 0.870720095831858 |
| 10 | 0.242912986557658 | 0.485825973115317 | 0.757087013442342 |
| 11 | 0.429780493866755 | 0.85956098773351 | 0.570219506133245 |
| 12 | 0.354259385805492 | 0.708518771610983 | 0.645740614194508 |
| 13 | 0.26709868375136 | 0.53419736750272 | 0.73290131624864 |
| 14 | 0.690949024552089 | 0.618101950895822 | 0.309050975447911 |
| 15 | 0.605665538639405 | 0.78866892272119 | 0.394334461360595 |
| 16 | 0.516505765589159 | 0.966988468821682 | 0.483494234410841 |
| 17 | 0.603531009401829 | 0.792937981196342 | 0.396468990598171 |
| 18 | 0.539186375635423 | 0.921627248729154 | 0.460813624364577 |
| 19 | 0.891173975542306 | 0.217652048915387 | 0.108826024457694 |
| 20 | 0.93870613366178 | 0.122587732676442 | 0.0612938663382212 |
| 21 | 0.913212673323481 | 0.173574653353038 | 0.0867873266765188 |
| 22 | 0.875133521488487 | 0.249732957023025 | 0.124866478511512 |
| 23 | 0.858700752440159 | 0.282598495119682 | 0.141299247559841 |
| 24 | 0.892751835368344 | 0.214496329263311 | 0.107248164631656 |
| 25 | 0.941409473820812 | 0.117181052358377 | 0.0585905261791884 |
| 26 | 0.913448876995767 | 0.173102246008465 | 0.0865511230042327 |
| 27 | 0.935941436786937 | 0.128117126426126 | 0.064058563213063 |
| 28 | 0.92439513721129 | 0.151209725577420 | 0.0756048627887099 |
| 29 | 0.89397996029746 | 0.212040079405079 | 0.106020039702540 |
| 30 | 0.878883721341814 | 0.242232557316371 | 0.121116278658186 |
| 31 | 0.853208464917081 | 0.293583070165838 | 0.146791535082919 |
| 32 | 0.806690164412242 | 0.386619671175516 | 0.193309835587758 |
| 33 | 0.784688884330966 | 0.430622231338068 | 0.215311115669034 |
| 34 | 0.761221615273634 | 0.477556769452732 | 0.238778384726366 |
| 35 | 0.71219282962857 | 0.57561434074286 | 0.28780717037143 |
| 36 | 0.689162074397924 | 0.621675851204152 | 0.310837925602076 |
| 37 | 0.75347424843546 | 0.49305150312908 | 0.24652575156454 |
| 38 | 0.687267732669992 | 0.625464534660016 | 0.312732267330008 |
| 39 | 0.628609961328287 | 0.742780077343425 | 0.371390038671713 |
| 40 | 0.87351211682093 | 0.252975766358141 | 0.126487883179070 |
| 41 | 0.834296534488333 | 0.331406931023334 | 0.165703465511667 |
| 42 | 0.818355201407705 | 0.36328959718459 | 0.181644798592295 |
| 43 | 0.828212105341082 | 0.343575789317836 | 0.171787894658918 |
| 44 | 0.790587050193042 | 0.418825899613917 | 0.209412949806958 |
| 45 | 0.730081487365116 | 0.539837025269768 | 0.269918512634884 |
| 46 | 0.738301422877662 | 0.523397154244676 | 0.261698577122338 |
| 47 | 0.694462131676103 | 0.611075736647794 | 0.305537868323897 |
| 48 | 0.691154141263193 | 0.617691717473613 | 0.308845858736807 |
| 49 | 0.651262941629279 | 0.697474116741443 | 0.348737058370721 |
| 50 | 0.60103250733996 | 0.797934985320079 | 0.398967492660039 |
| 51 | 0.614725532730804 | 0.770548934538392 | 0.385274467269196 |
| 52 | 0.477122658539395 | 0.95424531707879 | 0.522877341460605 |
| Meta Analysis of Goldfeld-Quandt test for Heteroskedasticity | |||
| Description | # significant tests | % significant tests | OK/NOK |
| 1% type I error level | 0 | 0 | OK |
| 5% type I error level | 0 | 0 | OK |
| 10% type I error level | 0 | 0 | OK |