| Tabulation of Results | ||
| SumFriends x Liked | ||
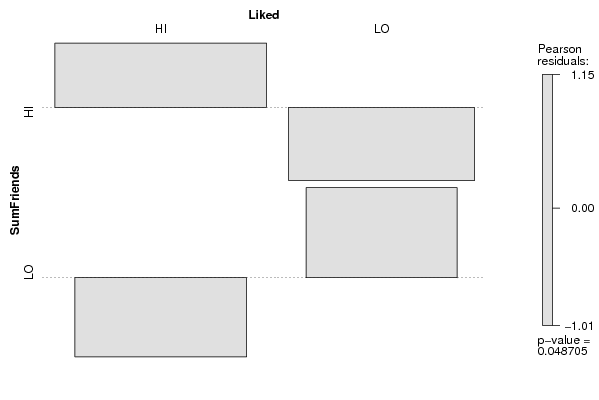
| HI | LO | HI | 59 | 35 | LO | 29 | 33 |
| Tabulation of Expected Results | ||
| SumFriends x Liked | ||
| HI | LO | HI | 53.03 | 40.97 | LO | 34.97 | 27.03 |
| Statistical Results | |
| Pearson's Chi-squared test with Yates' continuity correction | |
| Chi Square Statistic | 3.26 |
| Degrees of Freedom | 1 |
| P value | 0.07 |