| Multiple Linear Regression - Estimated Regression Equation |
| Werkloosheid[t] = + 545.567567567567 + 14.3889541715629Leterme[t] + e[t] |
| Multiple Linear Regression - Ordinary Least Squares | |||||
| Variable | Parameter | S.D. | T-STAT H0: parameter = 0 | 2-tail p-value | 1-tail p-value |
| (Intercept) | 545.567567567567 | 6.04272 | 90.2851 | 0 | 0 |
| Leterme | 14.3889541715629 | 9.759873 | 1.4743 | 0.145809 | 0.072905 |
| Multiple Linear Regression - Regression Statistics | |
| Multiple R | 0.190056285612222 |
| R-squared | 0.0361213917007146 |
| Adjusted R-squared | 0.0195027950058994 |
| F-TEST (value) | 2.17355245837236 |
| F-TEST (DF numerator) | 1 |
| F-TEST (DF denominator) | 58 |
| p-value | 0.145809033956458 |
| Multiple Linear Regression - Residual Statistics | |
| Residual Standard Deviation | 36.7564297923929 |
| Sum Squared Residuals | 78360.0376028201 |
| Multiple Linear Regression - Actuals, Interpolation, and Residuals | |||
| Time or Index | Actuals | Interpolation Forecast | Residuals Prediction Error |
| 1 | 595 | 545.567567567568 | 49.4324324324317 |
| 2 | 597 | 545.567567567567 | 51.4324324324324 |
| 3 | 593 | 545.567567567568 | 47.4324324324324 |
| 4 | 590 | 545.567567567568 | 44.4324324324324 |
| 5 | 580 | 545.567567567567 | 34.4324324324324 |
| 6 | 574 | 545.567567567567 | 28.4324324324325 |
| 7 | 573 | 545.567567567567 | 27.4324324324325 |
| 8 | 573 | 545.567567567567 | 27.4324324324325 |
| 9 | 620 | 545.567567567567 | 74.4324324324324 |
| 10 | 626 | 545.567567567567 | 80.4324324324324 |
| 11 | 620 | 545.567567567567 | 74.4324324324324 |
| 12 | 588 | 545.567567567567 | 42.4324324324324 |
| 13 | 566 | 545.567567567567 | 20.4324324324324 |
| 14 | 557 | 545.567567567567 | 11.4324324324324 |
| 15 | 561 | 545.567567567567 | 15.4324324324324 |
| 16 | 549 | 545.567567567568 | 3.43243243243245 |
| 17 | 532 | 545.567567567567 | -13.5675675675675 |
| 18 | 526 | 545.567567567567 | -19.5675675675675 |
| 19 | 511 | 545.567567567568 | -34.5675675675676 |
| 20 | 499 | 545.567567567568 | -46.5675675675676 |
| 21 | 555 | 545.567567567567 | 9.43243243243245 |
| 22 | 565 | 545.567567567567 | 19.4324324324324 |
| 23 | 542 | 545.567567567567 | -3.56756756756755 |
| 24 | 527 | 545.567567567567 | -18.5675675675675 |
| 25 | 510 | 545.567567567568 | -35.5675675675676 |
| 26 | 514 | 545.567567567568 | -31.5675675675676 |
| 27 | 517 | 545.567567567568 | -28.5675675675676 |
| 28 | 508 | 545.567567567568 | -37.5675675675676 |
| 29 | 493 | 545.567567567568 | -52.5675675675676 |
| 30 | 490 | 545.567567567567 | -55.5675675675676 |
| 31 | 469 | 545.567567567567 | -76.5675675675676 |
| 32 | 478 | 545.567567567567 | -67.5675675675676 |
| 33 | 528 | 545.567567567567 | -17.5675675675675 |
| 34 | 534 | 545.567567567567 | -11.5675675675675 |
| 35 | 518 | 545.567567567568 | -27.5675675675676 |
| 36 | 506 | 545.567567567568 | -39.5675675675676 |
| 37 | 502 | 545.567567567568 | -43.5675675675676 |
| 38 | 516 | 559.95652173913 | -43.9565217391304 |
| 39 | 528 | 559.95652173913 | -31.9565217391304 |
| 40 | 533 | 559.95652173913 | -26.9565217391304 |
| 41 | 536 | 559.95652173913 | -23.9565217391304 |
| 42 | 537 | 559.95652173913 | -22.9565217391304 |
| 43 | 524 | 559.95652173913 | -35.9565217391304 |
| 44 | 536 | 559.95652173913 | -23.9565217391304 |
| 45 | 587 | 559.95652173913 | 27.0434782608696 |
| 46 | 597 | 559.95652173913 | 37.0434782608696 |
| 47 | 581 | 559.95652173913 | 21.0434782608696 |
| 48 | 564 | 559.95652173913 | 4.04347826086957 |
| 49 | 558 | 559.95652173913 | -1.95652173913043 |
| 50 | 575 | 559.95652173913 | 15.0434782608696 |
| 51 | 580 | 559.95652173913 | 20.0434782608696 |
| 52 | 575 | 559.95652173913 | 15.0434782608696 |
| 53 | 563 | 559.95652173913 | 3.04347826086957 |
| 54 | 552 | 559.95652173913 | -7.95652173913044 |
| 55 | 537 | 559.95652173913 | -22.9565217391304 |
| 56 | 545 | 559.95652173913 | -14.9565217391304 |
| 57 | 601 | 559.95652173913 | 41.0434782608696 |
| 58 | 604 | 559.95652173913 | 44.0434782608696 |
| 59 | 586 | 559.95652173913 | 26.0434782608696 |
| 60 | 564 | 559.95652173913 | 4.04347826086957 |
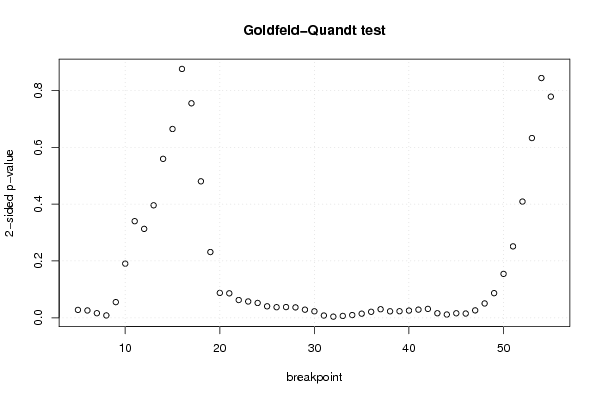
| Goldfeld-Quandt test for Heteroskedasticity | |||
| p-values | Alternative Hypothesis | ||
| breakpoint index | greater | 2-sided | less |
| 5 | 0.0138568097279648 | 0.0277136194559295 | 0.986143190272035 |
| 6 | 0.0129576744090749 | 0.0259153488181499 | 0.987042325590925 |
| 7 | 0.00808433686782365 | 0.0161686737356473 | 0.991915663132176 |
| 8 | 0.00419624271076132 | 0.00839248542152265 | 0.995803757289239 |
| 9 | 0.0275889956197443 | 0.0551779912394886 | 0.972411004380256 |
| 10 | 0.095287641847316 | 0.190575283694632 | 0.904712358152684 |
| 11 | 0.170017701480021 | 0.340035402960043 | 0.829982298519979 |
| 12 | 0.156492357697739 | 0.312984715395479 | 0.84350764230226 |
| 13 | 0.197976752404062 | 0.395953504808124 | 0.802023247595938 |
| 14 | 0.279730358928445 | 0.55946071785689 | 0.720269641071555 |
| 15 | 0.332281495580704 | 0.664562991161408 | 0.667718504419296 |
| 16 | 0.437939285473488 | 0.875878570946975 | 0.562060714526513 |
| 17 | 0.6224866407424 | 0.7550267185152 | 0.3775133592576 |
| 18 | 0.759809138008306 | 0.480381723983389 | 0.240190861991694 |
| 19 | 0.884307990027579 | 0.231384019944842 | 0.115692009972421 |
| 20 | 0.956230788810548 | 0.0875384223789047 | 0.0437692111894523 |
| 21 | 0.95688577314139 | 0.0862284537172189 | 0.0431142268586094 |
| 22 | 0.96873830540801 | 0.0625233891839796 | 0.0312616945919898 |
| 23 | 0.971273600439416 | 0.0574527991211689 | 0.0287263995605844 |
| 24 | 0.97386193211453 | 0.0522761357709409 | 0.0261380678854704 |
| 25 | 0.979755988131775 | 0.0404880237364496 | 0.0202440118682248 |
| 26 | 0.981330550418401 | 0.037338899163197 | 0.0186694495815985 |
| 27 | 0.98106526717528 | 0.0378694656494415 | 0.0189347328247208 |
| 28 | 0.981634401027251 | 0.0367311979454977 | 0.0183655989727488 |
| 29 | 0.985695655040536 | 0.0286086899189283 | 0.0143043449594641 |
| 30 | 0.988592885058744 | 0.0228142298825122 | 0.0114071149412561 |
| 31 | 0.995975360224538 | 0.00804927955092397 | 0.00402463977546198 |
| 32 | 0.997968114417173 | 0.00406377116565445 | 0.00203188558282722 |
| 33 | 0.996654015085783 | 0.00669196982843345 | 0.00334598491421672 |
| 34 | 0.995219013243343 | 0.0095619735133138 | 0.0047809867566569 |
| 35 | 0.99273272326394 | 0.0145345534721188 | 0.0072672767360594 |
| 36 | 0.989405835793874 | 0.0211883284122521 | 0.010594164206126 |
| 37 | 0.9849316456749 | 0.0301367086502003 | 0.0150683543251001 |
| 38 | 0.988540343629136 | 0.022919312741729 | 0.0114596563708645 |
| 39 | 0.98840320294586 | 0.0231935941082795 | 0.0115967970541398 |
| 40 | 0.98726838726387 | 0.0254632254722588 | 0.0127316127361294 |
| 41 | 0.985640980405896 | 0.028718039188208 | 0.014359019594104 |
| 42 | 0.98435005214343 | 0.0312998957131383 | 0.0156499478565691 |
| 43 | 0.99199866097685 | 0.0160026780462996 | 0.00800133902314979 |
| 44 | 0.994236980418622 | 0.0115260391627565 | 0.00576301958137823 |
| 45 | 0.992012544126432 | 0.0159749117471358 | 0.00798745587356788 |
| 46 | 0.992467675750585 | 0.0150646484988309 | 0.00753232424941543 |
| 47 | 0.98691661690773 | 0.026166766184539 | 0.0130833830922695 |
| 48 | 0.974743335130532 | 0.0505133297389367 | 0.0252566648694684 |
| 49 | 0.956636253911595 | 0.0867274921768104 | 0.0433637460884052 |
| 50 | 0.92269957502196 | 0.154600849956078 | 0.0773004249780392 |
| 51 | 0.874266165781431 | 0.251467668437138 | 0.125733834218569 |
| 52 | 0.795455155926458 | 0.409089688147085 | 0.204544844073542 |
| 53 | 0.68363873581623 | 0.632722528367541 | 0.31636126418377 |
| 54 | 0.578035974348047 | 0.843928051303906 | 0.421964025651953 |
| 55 | 0.610794079362074 | 0.778411841275853 | 0.389205920637926 |
| Meta Analysis of Goldfeld-Quandt test for Heteroskedasticity | |||
| Description | # significant tests | % significant tests | OK/NOK |
| 1% type I error level | 5 | 0.0980392156862745 | NOK |
| 5% type I error level | 27 | 0.529411764705882 | NOK |
| 10% type I error level | 35 | 0.686274509803922 | NOK |