| Multiple Linear Regression - Estimated Regression Equation |
| Y[t] = + 3151494.74893363 + 0.86246309155318X[t] + 0.057069425232684Y1[t] -0.00910064194217095Y2[t] + 0.0398947625434009Y3[t] -0.119766534283845Y4[t] -1281242.59489156M1[t] -490303.731102045M2[t] + 268741.195930662M3[t] + 399800.043282565M4[t] -201692.974633398M5[t] + 235204.245288726M6[t] + 645793.772386501M7[t] + 822791.718607045M8[t] -988516.699854688M9[t] + 617633.42020277M10[t] + 439029.687609985M11[t] -17613.1437160194t + e[t] |
| Multiple Linear Regression - Ordinary Least Squares | |||||
| Variable | Parameter | S.D. | T-STAT H0: parameter = 0 | 2-tail p-value | 1-tail p-value |
| (Intercept) | 3151494.74893363 | 935594.491107 | 3.3684 | 0.001744 | 0.000872 |
| X | 0.86246309155318 | 0.078585 | 10.9749 | 0 | 0 |
| Y1 | 0.057069425232684 | 0.080247 | 0.7112 | 0.481321 | 0.240661 |
| Y2 | -0.00910064194217095 | 0.079353 | -0.1147 | 0.909298 | 0.454649 |
| Y3 | 0.0398947625434009 | 0.078227 | 0.51 | 0.613008 | 0.306504 |
| Y4 | -0.119766534283845 | 0.074535 | -1.6069 | 0.116365 | 0.058182 |
| M1 | -1281242.59489156 | 509065.081879 | -2.5169 | 0.01618 | 0.00809 |
| M2 | -490303.731102045 | 480760.953342 | -1.0198 | 0.314249 | 0.157125 |
| M3 | 268741.195930662 | 466154.149058 | 0.5765 | 0.567672 | 0.283836 |
| M4 | 399800.043282565 | 440200.241513 | 0.9082 | 0.369485 | 0.184742 |
| M5 | -201692.974633398 | 386083.800141 | -0.5224 | 0.604419 | 0.30221 |
| M6 | 235204.245288726 | 387701.951221 | 0.6067 | 0.547683 | 0.273841 |
| M7 | 645793.772386501 | 465962.142496 | 1.3859 | 0.173846 | 0.086923 |
| M8 | 822791.718607045 | 379989.340758 | 2.1653 | 0.036709 | 0.018355 |
| M9 | -988516.699854688 | 443508.823958 | -2.2289 | 0.031815 | 0.015907 |
| M10 | 617633.42020277 | 548277.712182 | 1.1265 | 0.267019 | 0.133509 |
| M11 | 439029.687609985 | 518014.262562 | 0.8475 | 0.40201 | 0.201005 |
| t | -17613.1437160194 | 4517.678382 | -3.8987 | 0.000381 | 0.00019 |
| Multiple Linear Regression - Regression Statistics | |
| Multiple R | 0.97944652981867 |
| R-squared | 0.959315504773834 |
| Adjusted R-squared | 0.941114546383181 |
| F-TEST (value) | 52.7068676376117 |
| F-TEST (DF numerator) | 17 |
| F-TEST (DF denominator) | 38 |
| p-value | 0 |
| Multiple Linear Regression - Residual Statistics | |
| Residual Standard Deviation | 485956.855387267 |
| Sum Squared Residuals | 8973854481319.48 |
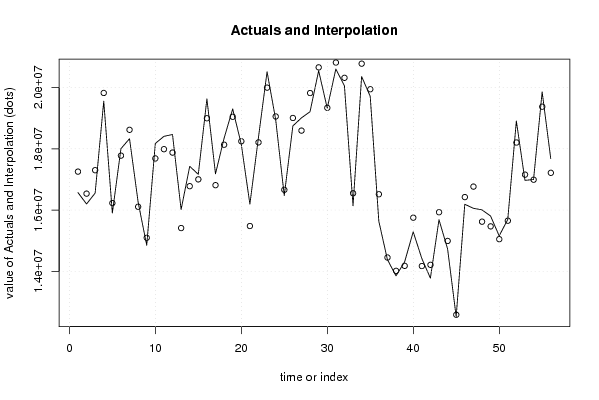
| Multiple Linear Regression - Actuals, Interpolation, and Residuals | |||
| Time or Index | Actuals | Interpolation Forecast | Residuals Prediction Error |
| 1 | 16571771.6 | 17255177.5905915 | -683405.990591523 |
| 2 | 16198892.67 | 16536303.1443226 | -337410.474322625 |
| 3 | 16554237.93 | 17301985.2164883 | -747747.28648832 |
| 4 | 19554176.37 | 19822424.0769997 | -268247.706999724 |
| 5 | 15903762.33 | 16228176.2145419 | -324413.884541911 |
| 6 | 18003781.65 | 17776362.7355703 | 227418.914429663 |
| 7 | 18329610.38 | 18619246.3232642 | -289635.943264194 |
| 8 | 16260733.42 | 16108775.6804458 | 151957.739554234 |
| 9 | 14851949.2 | 15096302.2582609 | -244353.058260939 |
| 10 | 18174068.44 | 17685411.7125495 | 488656.727450484 |
| 11 | 18406552.23 | 17987564.0292963 | 418988.200703702 |
| 12 | 18466459.42 | 17876294.9950413 | 590164.424958676 |
| 13 | 16016524.6 | 15413301.3655188 | 603223.234481239 |
| 14 | 17428458.32 | 16780019.3652301 | 648438.954769853 |
| 15 | 17167191.42 | 17002463.9914871 | 164727.428512923 |
| 16 | 19629987.6 | 18996870.5035644 | 633117.096435603 |
| 17 | 17183629.01 | 16812994.9249657 | 370634.08503428 |
| 18 | 18344657.85 | 18132634.9406470 | 212022.909352959 |
| 19 | 19301440.71 | 19044395.6015091 | 257045.108490907 |
| 20 | 18147463.68 | 18245323.2018766 | -97859.5218765806 |
| 21 | 16192909.22 | 15479850.9243100 | 713058.295689977 |
| 22 | 18374420.6 | 18210070.1089061 | 164350.491093864 |
| 23 | 20515191.95 | 19995441.6895382 | 519750.260461832 |
| 24 | 18957217.2 | 19055087.5352568 | -97870.3352567868 |
| 25 | 16471529.53 | 16661988.8011975 | -190459.271197479 |
| 26 | 18746813.27 | 19005408.4648715 | -258595.194871476 |
| 27 | 19009453.59 | 18593483.6626872 | 415969.927312781 |
| 28 | 19211178.55 | 19819389.4885690 | -608210.93856897 |
| 29 | 20547653.75 | 20657485.5872439 | -109831.837243946 |
| 30 | 19325754.03 | 19337006.8269402 | -11252.7969402468 |
| 31 | 20605542.58 | 20814511.3051512 | -208968.725151206 |
| 32 | 20056915.06 | 20316430.3722358 | -259515.312235764 |
| 33 | 16141449.72 | 16548889.8962452 | -407440.176245162 |
| 34 | 20359793.22 | 20777786.1336861 | -417992.91368611 |
| 35 | 19711553.27 | 19943535.4150014 | -231982.145001435 |
| 36 | 15638580.7 | 16516330.1473086 | -877749.447308581 |
| 37 | 14384486 | 14452100.9127655 | -67614.9127655282 |
| 38 | 13855616.12 | 14017338.9027664 | -161722.782766369 |
| 39 | 14308336.46 | 14180190.9487047 | 128145.511295329 |
| 40 | 15290621.44 | 15751882.1601039 | -461260.720103876 |
| 41 | 14423755.53 | 14173719.3150554 | 250036.214944576 |
| 42 | 13779681.49 | 14214193.6732223 | -434512.183222282 |
| 43 | 15686348.94 | 15930217.8604883 | -243868.920488343 |
| 44 | 14733828.17 | 14993193.0620991 | -259364.892099093 |
| 45 | 12522497.94 | 12583763.0011839 | -61265.0611838757 |
| 46 | 16189383.57 | 16424397.8748582 | -235014.304858239 |
| 47 | 16059123.25 | 16765879.5661641 | -706756.316164099 |
| 48 | 16007123.26 | 15621667.9023933 | 385455.357606691 |
| 49 | 15806842.33 | 15468585.3899267 | 338256.940073290 |
| 50 | 15159951.13 | 15050661.6328094 | 109289.497190618 |
| 51 | 15692144.17 | 15653239.7506327 | 38904.4193672878 |
| 52 | 18908869.11 | 18204266.8407630 | 704602.269236968 |
| 53 | 16969881.42 | 17156305.998193 | -186424.578192998 |
| 54 | 16997477.78 | 16991154.6236201 | 6323.15637990719 |
| 55 | 19858875.65 | 19373447.1695872 | 485428.480412837 |
| 56 | 17681170.13 | 17216388.1433428 | 464781.986657203 |
| Goldfeld-Quandt test for Heteroskedasticity | |||
| p-values | Alternative Hypothesis | ||
| breakpoint index | greater | 2-sided | less |
| 21 | 0.330538660591570 | 0.661077321183139 | 0.66946133940843 |
| 22 | 0.473882073160261 | 0.947764146320523 | 0.526117926839738 |
| 23 | 0.555712885935467 | 0.888574228129066 | 0.444287114064533 |
| 24 | 0.542042824984014 | 0.915914350031973 | 0.457957175015986 |
| 25 | 0.58631710035399 | 0.827365799292019 | 0.413682899646010 |
| 26 | 0.556679098195949 | 0.886641803608103 | 0.443320901804051 |
| 27 | 0.543375962608688 | 0.913248074782625 | 0.456624037391312 |
| 28 | 0.604170063521513 | 0.791659872956973 | 0.395829936478487 |
| 29 | 0.541498865635815 | 0.917002268728371 | 0.458501134364185 |
| 30 | 0.520683006577582 | 0.958633986844835 | 0.479316993422418 |
| 31 | 0.438547202913205 | 0.87709440582641 | 0.561452797086795 |
| 32 | 0.35853197466508 | 0.71706394933016 | 0.64146802533492 |
| 33 | 0.259988109689895 | 0.519976219379789 | 0.740011890310105 |
| 34 | 0.205948007528703 | 0.411896015057405 | 0.794051992471297 |
| 35 | 0.433992225050289 | 0.867984450100577 | 0.566007774949711 |
| Meta Analysis of Goldfeld-Quandt test for Heteroskedasticity | |||
| Description | # significant tests | % significant tests | OK/NOK |
| 1% type I error level | 0 | 0 | OK |
| 5% type I error level | 0 | 0 | OK |
| 10% type I error level | 0 | 0 | OK |