| Multiple Linear Regression - Estimated Regression Equation |
| Y[t] = + 3363247.36872550 + 0.862675215502543X[t] -1820347.80707848M1[t] -187455.186940559M2[t] -343912.623172632M3[t] -812292.839266948M4[t] -1681766.40358488M5[t] -1375785.78428621M6[t] -621772.351334577M7[t] -437174.629128277M8[t] -736462.116213925M9[t] -445829.754652919M10[t] + 39658.6322933237M11[t] -16183.9076883882t + e[t] |
| Multiple Linear Regression - Ordinary Least Squares | |||||
| Variable | Parameter | S.D. | T-STAT H0: parameter = 0 | 2-tail p-value | 1-tail p-value |
| (Intercept) | 3363247.36872550 | 646794.843193 | 5.1999 | 4e-06 | 2e-06 |
| X | 0.862675215502543 | 0.034712 | 24.8521 | 0 | 0 |
| M1 | -1820347.80707848 | 303545.710237 | -5.9969 | 0 | 0 |
| M2 | -187455.186940559 | 301037.135597 | -0.6227 | 0.536558 | 0.268279 |
| M3 | -343912.623172632 | 301687.329693 | -1.14 | 0.260202 | 0.130101 |
| M4 | -812292.839266948 | 299846.518977 | -2.709 | 0.009447 | 0.004723 |
| M5 | -1681766.40358488 | 298648.982151 | -5.6312 | 1e-06 | 1e-06 |
| M6 | -1375785.78428621 | 298420.525039 | -4.6102 | 3.2e-05 | 1.6e-05 |
| M7 | -621772.351334577 | 298420.956303 | -2.0835 | 0.042786 | 0.021393 |
| M8 | -437174.629128277 | 303881.998335 | -1.4386 | 0.157024 | 0.078512 |
| M9 | -736462.116213925 | 298027.095406 | -2.4711 | 0.017233 | 0.008617 |
| M10 | -445829.754652919 | 297948.368363 | -1.4963 | 0.141397 | 0.070699 |
| M11 | 39658.6322933237 | 302299.838359 | 0.1312 | 0.896197 | 0.448099 |
| t | -16183.9076883882 | 3591.581556 | -4.5061 | 4.5e-05 | 2.3e-05 |
| Multiple Linear Regression - Regression Statistics | |
| Multiple R | 0.977947644368567 |
| R-squared | 0.95638159512603 |
| Adjusted R-squared | 0.944054654618168 |
| F-TEST (value) | 77.584668678827 |
| F-TEST (DF numerator) | 13 |
| F-TEST (DF denominator) | 46 |
| p-value | 0 |
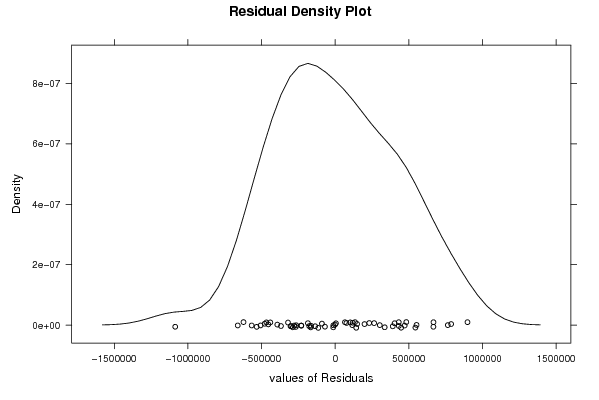
| Multiple Linear Regression - Residual Statistics | |
| Residual Standard Deviation | 470540.281698332 |
| Sum Squared Residuals | 10184775208234.3 |
| Multiple Linear Regression - Actuals, Interpolation, and Residuals | |||
| Time or Index | Actuals | Interpolation Forecast | Residuals Prediction Error |
| 1 | 13768040.14 | 14235472.9875384 | -467432.847538398 |
| 2 | 17487530.67 | 17353030.6112547 | 134500.058745351 |
| 3 | 16198106.13 | 16095503.0038045 | 102603.126195539 |
| 4 | 17535166.38 | 17701555.8749018 | -166389.494901839 |
| 5 | 16571771.6 | 17104893.2456888 | -533121.64568878 |
| 6 | 16198892.67 | 16466321.7825869 | -267429.112586945 |
| 7 | 16554237.93 | 17033100.4025637 | -478862.472563677 |
| 8 | 19554176.37 | 19784039.0840916 | -229862.714091583 |
| 9 | 15903762.33 | 16224150.7859289 | -320388.455928858 |
| 10 | 18003781.65 | 17804616.3870943 | 199165.26290569 |
| 11 | 18329610.38 | 18493690.7419348 | -164080.361934776 |
| 12 | 16260733.42 | 16272901.7129714 | -12168.2929714352 |
| 13 | 14851949.2 | 14852978.2375658 | -1029.03756583872 |
| 14 | 18174068.44 | 17770662.8994049 | 403405.540595129 |
| 15 | 18406552.23 | 18015641.8940353 | 390910.335964743 |
| 16 | 18466459.42 | 17701880.156063 | 764579.263937019 |
| 17 | 16016524.6 | 15349160.5770064 | 667364.022993623 |
| 18 | 17428458.32 | 16761591.0017982 | 666867.318201772 |
| 19 | 17167191.42 | 16902866.2519991 | 264325.168000877 |
| 20 | 19629987.6 | 19085410.4306657 | 544577.169334302 |
| 21 | 17183629.01 | 16711986.5651599 | 471642.444840083 |
| 22 | 18344657.85 | 18228647.3012262 | 116010.548773801 |
| 23 | 19301440.71 | 18998743.6378353 | 302697.072164704 |
| 24 | 18147463.68 | 18332814.3990092 | -185350.719009240 |
| 25 | 16192909.22 | 15294689.7923872 | 898219.427612768 |
| 26 | 18374420.6 | 18255336.3183380 | 119084.281662049 |
| 27 | 20515191.95 | 20083118.223053 | 432073.726946982 |
| 28 | 18957217.2 | 18952133.0472841 | 5084.15271586714 |
| 29 | 16471529.53 | 16759185.1538739 | -287655.623873907 |
| 30 | 18746813.27 | 18923081.3221046 | -176268.052104617 |
| 31 | 19009453.59 | 18673388.7484459 | 336064.841554093 |
| 32 | 19211178.55 | 19872806.6932722 | -661628.143272149 |
| 33 | 20547653.75 | 20617201.936238 | -69548.1862380049 |
| 34 | 19325754.03 | 19339094.6243122 | -13340.5943121525 |
| 35 | 20605542.58 | 20998523.4875892 | -392980.907589235 |
| 36 | 20056915.06 | 20171710.3073347 | -114795.247334700 |
| 37 | 16141449.72 | 16647913.9524341 | -506464.232434103 |
| 38 | 20359793.22 | 20926697.4446745 | -566904.224674528 |
| 39 | 19711553.27 | 20014631.9575503 | -303078.687550287 |
| 40 | 15638580.7 | 16724699.2413541 | -1086118.54135410 |
| 41 | 14384486 | 14662690.2970804 | -278204.297080378 |
| 42 | 13855616.12 | 14309822.8123737 | -454206.692373723 |
| 43 | 14308336.46 | 14572577.8383604 | -264241.378360400 |
| 44 | 15290621.44 | 15731057.0649904 | -440435.624990354 |
| 45 | 14423755.53 | 14275210.7479184 | 148544.782081633 |
| 46 | 13779681.49 | 14147759.5403470 | -368078.050347027 |
| 47 | 15686348.94 | 15984348.6453855 | -297999.705385525 |
| 48 | 14733828.17 | 14869390.4523193 | -135562.282319270 |
| 49 | 12522497.94 | 12445791.2500744 | 76706.6899255716 |
| 50 | 16189383.57 | 16279469.226328 | -90085.6563280014 |
| 51 | 16059123.25 | 16681631.7515570 | -622508.501556977 |
| 52 | 16007123.26 | 15524278.6403969 | 482844.619603058 |
| 53 | 15806842.33 | 15375224.7863506 | 431617.543649441 |
| 54 | 15159951.13 | 14928914.5911365 | 231036.538863513 |
| 55 | 15692144.17 | 15549430.3286309 | 142713.841369107 |
| 56 | 18908869.11 | 18121519.7969802 | 787349.313019784 |
| 57 | 16969881.42 | 17200132.0047549 | -230250.584754853 |
| 58 | 16997477.78 | 16931234.9470203 | 66242.8329796886 |
| 59 | 19858875.65 | 19306511.7472552 | 552363.902744832 |
| 60 | 17681170.13 | 17233293.5883654 | 447876.541634646 |
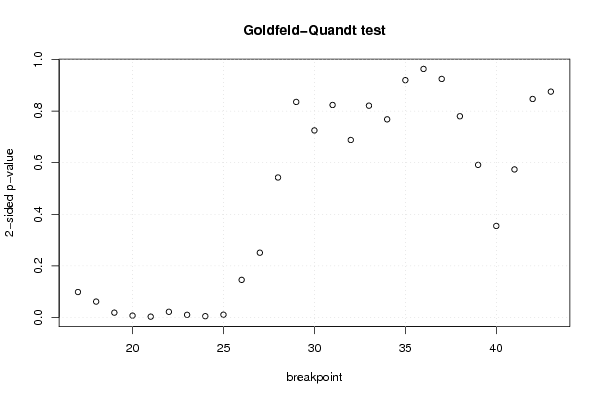
| Goldfeld-Quandt test for Heteroskedasticity | |||
| p-values | Alternative Hypothesis | ||
| breakpoint index | greater | 2-sided | less |
| 17 | 0.0493635850289076 | 0.0987271700578153 | 0.950636414971092 |
| 18 | 0.0307962937926038 | 0.0615925875852076 | 0.969203706207396 |
| 19 | 0.00934696751309037 | 0.0186939350261807 | 0.99065303248691 |
| 20 | 0.00357336170395309 | 0.00714672340790618 | 0.996426638296047 |
| 21 | 0.00159420799551703 | 0.00318841599103406 | 0.998405792004483 |
| 22 | 0.0109824474504471 | 0.0219648949008942 | 0.989017552549553 |
| 23 | 0.00510395136729925 | 0.0102079027345985 | 0.9948960486327 |
| 24 | 0.00246874547832629 | 0.00493749095665259 | 0.997531254521674 |
| 25 | 0.0053739268325206 | 0.0107478536650412 | 0.99462607316748 |
| 26 | 0.0728793986371764 | 0.145758797274353 | 0.927120601362824 |
| 27 | 0.125514089348669 | 0.251028178697337 | 0.874485910651332 |
| 28 | 0.271325899366375 | 0.542651798732749 | 0.728674100633625 |
| 29 | 0.417751233466306 | 0.835502466932611 | 0.582248766533694 |
| 30 | 0.362551167145486 | 0.725102334290973 | 0.637448832854514 |
| 31 | 0.411868556793835 | 0.82373711358767 | 0.588131443206165 |
| 32 | 0.655994293797886 | 0.688011412404229 | 0.344005706202114 |
| 33 | 0.589524122975804 | 0.820951754048392 | 0.410475877024196 |
| 34 | 0.615943025192155 | 0.76811394961569 | 0.384056974807845 |
| 35 | 0.540053122125875 | 0.91989375574825 | 0.459946877874125 |
| 36 | 0.481699505513217 | 0.963399011026433 | 0.518300494486783 |
| 37 | 0.462346441554567 | 0.924692883109133 | 0.537653558445433 |
| 38 | 0.389999866757065 | 0.77999973351413 | 0.610000133242935 |
| 39 | 0.704295909907654 | 0.591408180184692 | 0.295704090092346 |
| 40 | 0.822580686684407 | 0.354838626631186 | 0.177419313315593 |
| 41 | 0.713036193112562 | 0.573927613774876 | 0.286963806887438 |
| 42 | 0.576502215353404 | 0.846995569293192 | 0.423497784646596 |
| 43 | 0.437684607963632 | 0.875369215927264 | 0.562315392036368 |
| Meta Analysis of Goldfeld-Quandt test for Heteroskedasticity | |||
| Description | # significant tests | % significant tests | OK/NOK |
| 1% type I error level | 3 | 0.111111111111111 | NOK |
| 5% type I error level | 7 | 0.259259259259259 | NOK |
| 10% type I error level | 9 | 0.333333333333333 | NOK |