Free Statistics

of Irreproducible Research!

Author's title

Author*The author of this computation has been verified*
R Software Modulerwasp_exponentialsmoothing.wasp
Title produced by softwareExponential Smoothing
Date of computationFri, 26 Nov 2010 12:44:04 +0000
Cite this page as followsStatistical Computations at FreeStatistics.org, Office for Research Development and Education, URL https://freestatistics.org/blog/index.php?v=date/2010/Nov/26/t129077554053241puu92whb4p.htm/, Retrieved Fri, 03 May 2024 21:50:54 +0000
Statistical Computations at FreeStatistics.org, Office for Research Development and Education, URL https://freestatistics.org/blog/index.php?pk=101831, Retrieved Fri, 03 May 2024 21:50:54 +0000
QR Codes:

Original text written by user:
IsPrivate?No (this computation is public)
User-defined keywords
Estimated Impact195
Family? (F = Feedback message, R = changed R code, M = changed R Module, P = changed Parameters, D = changed Data)
-     [Exponential Smoothing] [HPC Retail Sales] [2008-03-10 17:43:04] [74be16979710d4c4e7c6647856088456]
F  MPD    [Exponential Smoothing] [] [2010-11-26 12:44:04] [df17410ebb98883e83037e1662207ccb] [Current]
-    D      [Exponential Smoothing] [] [2010-11-30 10:29:51] [fb3a7008aea9486db3846dc25434607b]
- R PD        [Exponential Smoothing] [Tripple exponenti...] [2010-12-17 14:30:56] [fb3a7008aea9486db3846dc25434607b]
F    D      [Exponential Smoothing] [ws 8] [2010-11-30 13:07:26] [af8eb90b4bf1bcfcc4325c143dbee260]
-    D      [Exponential Smoothing] [holt winter model ] [2010-12-18 18:52:24] [74deae64b71f9d77c839af86f7c687b5]
- RM        [Exponential Smoothing] [] [2011-11-29 22:31:59] [46d7ccc24e5d35a2decd922dfb3b3a39]
Feedback Forum
2010-12-03 12:44:23 [Pascal Wijnen] [reply
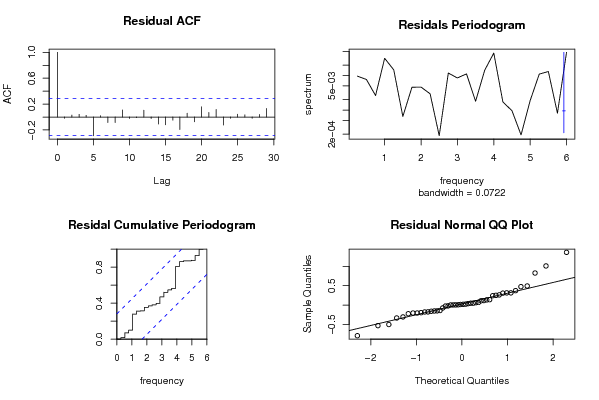
Er is een juiste verwerking van de gegevens, en een correct interpretatie van die gegevens. De smoothing heeft hier niet geholpen om de assumpties te bekomen die nodig zijn.
2010-12-04 16:37:13 [00c625c7d009d84797af914265b614f9] [reply
Juist analyse van de berekeningen, assumpties nog steeds niet voldaan

Post a new message
Dataseries X:
101,76
102,37
102,38
102,86
102,87
102,92
102,95
103,02
104,08
104,16
104,24
104,33
104,73
104,86
105,03
105,62
105,63
105,63
105,94
106,61
107,69
107,78
107,93
108,48
108,14
108,48
108,48
108,89
108,93
109,21
109,47
109,80
111,73
111,85
112,12
112,15
112,17
112,67
112,80
113,44
113,53
114,53
114,51
115,05
116,67
117,07
116,92
117,00
117,02
117,35
117,36
117,82
117,88
118,24
118,50
118,80
119,76
120,09


Summary of computational transaction
Raw Inputview raw input (R code)
Raw Outputview raw output of R engine
Computing time2 seconds
R Server'Sir Ronald Aylmer Fisher' @ 193.190.124.24

\begin{tabular}{lllllllll}
\hline
Summary of computational transaction \tabularnewline
Raw Input & view raw input (R code)  \tabularnewline
Raw Output & view raw output of R engine  \tabularnewline
Computing time & 2 seconds \tabularnewline
R Server & 'Sir Ronald Aylmer Fisher' @ 193.190.124.24 \tabularnewline
\hline
\end{tabular}
%Source: https://freestatistics.org/blog/index.php?pk=101831&T=0

[TABLE]
[ROW][C]Summary of computational transaction[/C][/ROW]
[ROW][C]Raw Input[/C][C]view raw input (R code) [/C][/ROW]
[ROW][C]Raw Output[/C][C]view raw output of R engine [/C][/ROW]
[ROW][C]Computing time[/C][C]2 seconds[/C][/ROW]
[ROW][C]R Server[/C][C]'Sir Ronald Aylmer Fisher' @ 193.190.124.24[/C][/ROW]
[/TABLE]
Source: https://freestatistics.org/blog/index.php?pk=101831&T=0

Globally Unique Identifier (entire table): ba.freestatistics.org/blog/index.php?pk=101831&T=0

As an alternative you can also use a QR Code:  

The GUIDs for individual cells are displayed in the table below:

Summary of computational transaction
Raw Inputview raw input (R code)
Raw Outputview raw output of R engine
Computing time2 seconds
R Server'Sir Ronald Aylmer Fisher' @ 193.190.124.24


Estimated Parameters of Exponential Smoothing
ParameterValue
alpha0.800423354394571
beta0.0331010306156857
gamma0.155500317120044

\begin{tabular}{lllllllll}
\hline
Estimated Parameters of Exponential Smoothing \tabularnewline
Parameter & Value \tabularnewline
alpha & 0.800423354394571 \tabularnewline
beta & 0.0331010306156857 \tabularnewline
gamma & 0.155500317120044 \tabularnewline
\hline
\end{tabular}
%Source: https://freestatistics.org/blog/index.php?pk=101831&T=1

[TABLE]
[ROW][C]Estimated Parameters of Exponential Smoothing[/C][/ROW]
[ROW][C]Parameter[/C][C]Value[/C][/ROW]
[ROW][C]alpha[/C][C]0.800423354394571[/C][/ROW]
[ROW][C]beta[/C][C]0.0331010306156857[/C][/ROW]
[ROW][C]gamma[/C][C]0.155500317120044[/C][/ROW]
[/TABLE]
Source: https://freestatistics.org/blog/index.php?pk=101831&T=1

Globally Unique Identifier (entire table): ba.freestatistics.org/blog/index.php?pk=101831&T=1

As an alternative you can also use a QR Code:  

The GUIDs for individual cells are displayed in the table below:

Estimated Parameters of Exponential Smoothing
ParameterValue
alpha0.800423354394571
beta0.0331010306156857
gamma0.155500317120044


Interpolation Forecasts of Exponential Smoothing
tObservedFittedResiduals
13104.73103.3681490384621.36185096153842
14104.86104.6080718819910.251928118009161
15105.03104.9804280213140.0495719786860462
16105.62105.6108769823600.00912301763962375
17105.63105.6258580298650.0041419701350236
18105.63105.6048785381120.0251214618882756
19105.94106.117190443916-0.177190443916487
20106.61106.1162058766770.49379412332317
21107.69107.6687093561100.0212906438897846
22107.78107.852324107732-0.0723241077323422
23107.93107.954507876992-0.0245078769920042
24108.48108.1063988751590.373601124840917
25108.14108.929524782175-0.789524782174595
26108.48108.4173629503480.0626370496522384
27108.48108.631283210951-0.151283210950908
28108.89109.093743139711-0.203743139710568
29108.93108.9265821609620.00341783903807880
30109.21108.8940505548710.315949445129021
31109.47109.628951231003-0.158951231002746
32109.8109.6599543462360.14004565376365
33111.73110.9018380982000.828161901800428
34111.85111.7369567015820.113043298417523
35112.12112.0024786060700.117521393930190
36112.15112.297652993425-0.147652993425410
37112.17112.670892505072-0.500892505071604
38112.67112.4272864351390.242713564860921
39112.8112.7945579500050.00544204999491171
40113.44113.4008414515000.0391585485001116
41113.53113.4609744467300.0690255532704072
42114.53113.5188349394701.01116506052988
43114.51114.842062851837-0.332062851836938
44115.05114.7857945560260.26420544397412
45116.67116.1937154909330.476284509067455
46117.07116.7609687484860.309031251513616
47116.92117.224674324740-0.304674324739665
48117117.203669270894-0.203669270894281
49117.02117.549610742311-0.529610742310979
50117.35117.3338354959330.0161645040668503
51117.36117.534146260088-0.174146260088264
52117.82118.014709234096-0.194709234095882
53117.88117.899359389291-0.0193593892907273
54118.24117.9241548362920.315845163708474
55118.5118.639165780956-0.139165780956333
56118.8118.7509316734670.0490683265329324
57119.76119.98266366231-0.222663662310097
58120.09119.9561835013870.133816498612504

\begin{tabular}{lllllllll}
\hline
Interpolation Forecasts of Exponential Smoothing \tabularnewline
t & Observed & Fitted & Residuals \tabularnewline
13 & 104.73 & 103.368149038462 & 1.36185096153842 \tabularnewline
14 & 104.86 & 104.608071881991 & 0.251928118009161 \tabularnewline
15 & 105.03 & 104.980428021314 & 0.0495719786860462 \tabularnewline
16 & 105.62 & 105.610876982360 & 0.00912301763962375 \tabularnewline
17 & 105.63 & 105.625858029865 & 0.0041419701350236 \tabularnewline
18 & 105.63 & 105.604878538112 & 0.0251214618882756 \tabularnewline
19 & 105.94 & 106.117190443916 & -0.177190443916487 \tabularnewline
20 & 106.61 & 106.116205876677 & 0.49379412332317 \tabularnewline
21 & 107.69 & 107.668709356110 & 0.0212906438897846 \tabularnewline
22 & 107.78 & 107.852324107732 & -0.0723241077323422 \tabularnewline
23 & 107.93 & 107.954507876992 & -0.0245078769920042 \tabularnewline
24 & 108.48 & 108.106398875159 & 0.373601124840917 \tabularnewline
25 & 108.14 & 108.929524782175 & -0.789524782174595 \tabularnewline
26 & 108.48 & 108.417362950348 & 0.0626370496522384 \tabularnewline
27 & 108.48 & 108.631283210951 & -0.151283210950908 \tabularnewline
28 & 108.89 & 109.093743139711 & -0.203743139710568 \tabularnewline
29 & 108.93 & 108.926582160962 & 0.00341783903807880 \tabularnewline
30 & 109.21 & 108.894050554871 & 0.315949445129021 \tabularnewline
31 & 109.47 & 109.628951231003 & -0.158951231002746 \tabularnewline
32 & 109.8 & 109.659954346236 & 0.14004565376365 \tabularnewline
33 & 111.73 & 110.901838098200 & 0.828161901800428 \tabularnewline
34 & 111.85 & 111.736956701582 & 0.113043298417523 \tabularnewline
35 & 112.12 & 112.002478606070 & 0.117521393930190 \tabularnewline
36 & 112.15 & 112.297652993425 & -0.147652993425410 \tabularnewline
37 & 112.17 & 112.670892505072 & -0.500892505071604 \tabularnewline
38 & 112.67 & 112.427286435139 & 0.242713564860921 \tabularnewline
39 & 112.8 & 112.794557950005 & 0.00544204999491171 \tabularnewline
40 & 113.44 & 113.400841451500 & 0.0391585485001116 \tabularnewline
41 & 113.53 & 113.460974446730 & 0.0690255532704072 \tabularnewline
42 & 114.53 & 113.518834939470 & 1.01116506052988 \tabularnewline
43 & 114.51 & 114.842062851837 & -0.332062851836938 \tabularnewline
44 & 115.05 & 114.785794556026 & 0.26420544397412 \tabularnewline
45 & 116.67 & 116.193715490933 & 0.476284509067455 \tabularnewline
46 & 117.07 & 116.760968748486 & 0.309031251513616 \tabularnewline
47 & 116.92 & 117.224674324740 & -0.304674324739665 \tabularnewline
48 & 117 & 117.203669270894 & -0.203669270894281 \tabularnewline
49 & 117.02 & 117.549610742311 & -0.529610742310979 \tabularnewline
50 & 117.35 & 117.333835495933 & 0.0161645040668503 \tabularnewline
51 & 117.36 & 117.534146260088 & -0.174146260088264 \tabularnewline
52 & 117.82 & 118.014709234096 & -0.194709234095882 \tabularnewline
53 & 117.88 & 117.899359389291 & -0.0193593892907273 \tabularnewline
54 & 118.24 & 117.924154836292 & 0.315845163708474 \tabularnewline
55 & 118.5 & 118.639165780956 & -0.139165780956333 \tabularnewline
56 & 118.8 & 118.750931673467 & 0.0490683265329324 \tabularnewline
57 & 119.76 & 119.98266366231 & -0.222663662310097 \tabularnewline
58 & 120.09 & 119.956183501387 & 0.133816498612504 \tabularnewline
\hline
\end{tabular}
%Source: https://freestatistics.org/blog/index.php?pk=101831&T=2

[TABLE]
[ROW][C]Interpolation Forecasts of Exponential Smoothing[/C][/ROW]
[ROW][C]t[/C][C]Observed[/C][C]Fitted[/C][C]Residuals[/C][/ROW]
[ROW][C]13[/C][C]104.73[/C][C]103.368149038462[/C][C]1.36185096153842[/C][/ROW]
[ROW][C]14[/C][C]104.86[/C][C]104.608071881991[/C][C]0.251928118009161[/C][/ROW]
[ROW][C]15[/C][C]105.03[/C][C]104.980428021314[/C][C]0.0495719786860462[/C][/ROW]
[ROW][C]16[/C][C]105.62[/C][C]105.610876982360[/C][C]0.00912301763962375[/C][/ROW]
[ROW][C]17[/C][C]105.63[/C][C]105.625858029865[/C][C]0.0041419701350236[/C][/ROW]
[ROW][C]18[/C][C]105.63[/C][C]105.604878538112[/C][C]0.0251214618882756[/C][/ROW]
[ROW][C]19[/C][C]105.94[/C][C]106.117190443916[/C][C]-0.177190443916487[/C][/ROW]
[ROW][C]20[/C][C]106.61[/C][C]106.116205876677[/C][C]0.49379412332317[/C][/ROW]
[ROW][C]21[/C][C]107.69[/C][C]107.668709356110[/C][C]0.0212906438897846[/C][/ROW]
[ROW][C]22[/C][C]107.78[/C][C]107.852324107732[/C][C]-0.0723241077323422[/C][/ROW]
[ROW][C]23[/C][C]107.93[/C][C]107.954507876992[/C][C]-0.0245078769920042[/C][/ROW]
[ROW][C]24[/C][C]108.48[/C][C]108.106398875159[/C][C]0.373601124840917[/C][/ROW]
[ROW][C]25[/C][C]108.14[/C][C]108.929524782175[/C][C]-0.789524782174595[/C][/ROW]
[ROW][C]26[/C][C]108.48[/C][C]108.417362950348[/C][C]0.0626370496522384[/C][/ROW]
[ROW][C]27[/C][C]108.48[/C][C]108.631283210951[/C][C]-0.151283210950908[/C][/ROW]
[ROW][C]28[/C][C]108.89[/C][C]109.093743139711[/C][C]-0.203743139710568[/C][/ROW]
[ROW][C]29[/C][C]108.93[/C][C]108.926582160962[/C][C]0.00341783903807880[/C][/ROW]
[ROW][C]30[/C][C]109.21[/C][C]108.894050554871[/C][C]0.315949445129021[/C][/ROW]
[ROW][C]31[/C][C]109.47[/C][C]109.628951231003[/C][C]-0.158951231002746[/C][/ROW]
[ROW][C]32[/C][C]109.8[/C][C]109.659954346236[/C][C]0.14004565376365[/C][/ROW]
[ROW][C]33[/C][C]111.73[/C][C]110.901838098200[/C][C]0.828161901800428[/C][/ROW]
[ROW][C]34[/C][C]111.85[/C][C]111.736956701582[/C][C]0.113043298417523[/C][/ROW]
[ROW][C]35[/C][C]112.12[/C][C]112.002478606070[/C][C]0.117521393930190[/C][/ROW]
[ROW][C]36[/C][C]112.15[/C][C]112.297652993425[/C][C]-0.147652993425410[/C][/ROW]
[ROW][C]37[/C][C]112.17[/C][C]112.670892505072[/C][C]-0.500892505071604[/C][/ROW]
[ROW][C]38[/C][C]112.67[/C][C]112.427286435139[/C][C]0.242713564860921[/C][/ROW]
[ROW][C]39[/C][C]112.8[/C][C]112.794557950005[/C][C]0.00544204999491171[/C][/ROW]
[ROW][C]40[/C][C]113.44[/C][C]113.400841451500[/C][C]0.0391585485001116[/C][/ROW]
[ROW][C]41[/C][C]113.53[/C][C]113.460974446730[/C][C]0.0690255532704072[/C][/ROW]
[ROW][C]42[/C][C]114.53[/C][C]113.518834939470[/C][C]1.01116506052988[/C][/ROW]
[ROW][C]43[/C][C]114.51[/C][C]114.842062851837[/C][C]-0.332062851836938[/C][/ROW]
[ROW][C]44[/C][C]115.05[/C][C]114.785794556026[/C][C]0.26420544397412[/C][/ROW]
[ROW][C]45[/C][C]116.67[/C][C]116.193715490933[/C][C]0.476284509067455[/C][/ROW]
[ROW][C]46[/C][C]117.07[/C][C]116.760968748486[/C][C]0.309031251513616[/C][/ROW]
[ROW][C]47[/C][C]116.92[/C][C]117.224674324740[/C][C]-0.304674324739665[/C][/ROW]
[ROW][C]48[/C][C]117[/C][C]117.203669270894[/C][C]-0.203669270894281[/C][/ROW]
[ROW][C]49[/C][C]117.02[/C][C]117.549610742311[/C][C]-0.529610742310979[/C][/ROW]
[ROW][C]50[/C][C]117.35[/C][C]117.333835495933[/C][C]0.0161645040668503[/C][/ROW]
[ROW][C]51[/C][C]117.36[/C][C]117.534146260088[/C][C]-0.174146260088264[/C][/ROW]
[ROW][C]52[/C][C]117.82[/C][C]118.014709234096[/C][C]-0.194709234095882[/C][/ROW]
[ROW][C]53[/C][C]117.88[/C][C]117.899359389291[/C][C]-0.0193593892907273[/C][/ROW]
[ROW][C]54[/C][C]118.24[/C][C]117.924154836292[/C][C]0.315845163708474[/C][/ROW]
[ROW][C]55[/C][C]118.5[/C][C]118.639165780956[/C][C]-0.139165780956333[/C][/ROW]
[ROW][C]56[/C][C]118.8[/C][C]118.750931673467[/C][C]0.0490683265329324[/C][/ROW]
[ROW][C]57[/C][C]119.76[/C][C]119.98266366231[/C][C]-0.222663662310097[/C][/ROW]
[ROW][C]58[/C][C]120.09[/C][C]119.956183501387[/C][C]0.133816498612504[/C][/ROW]
[/TABLE]
Source: https://freestatistics.org/blog/index.php?pk=101831&T=2

Globally Unique Identifier (entire table): ba.freestatistics.org/blog/index.php?pk=101831&T=2

As an alternative you can also use a QR Code:  

The GUIDs for individual cells are displayed in the table below:

Interpolation Forecasts of Exponential Smoothing
tObservedFittedResiduals
13104.73103.3681490384621.36185096153842
14104.86104.6080718819910.251928118009161
15105.03104.9804280213140.0495719786860462
16105.62105.6108769823600.00912301763962375
17105.63105.6258580298650.0041419701350236
18105.63105.6048785381120.0251214618882756
19105.94106.117190443916-0.177190443916487
20106.61106.1162058766770.49379412332317
21107.69107.6687093561100.0212906438897846
22107.78107.852324107732-0.0723241077323422
23107.93107.954507876992-0.0245078769920042
24108.48108.1063988751590.373601124840917
25108.14108.929524782175-0.789524782174595
26108.48108.4173629503480.0626370496522384
27108.48108.631283210951-0.151283210950908
28108.89109.093743139711-0.203743139710568
29108.93108.9265821609620.00341783903807880
30109.21108.8940505548710.315949445129021
31109.47109.628951231003-0.158951231002746
32109.8109.6599543462360.14004565376365
33111.73110.9018380982000.828161901800428
34111.85111.7369567015820.113043298417523
35112.12112.0024786060700.117521393930190
36112.15112.297652993425-0.147652993425410
37112.17112.670892505072-0.500892505071604
38112.67112.4272864351390.242713564860921
39112.8112.7945579500050.00544204999491171
40113.44113.4008414515000.0391585485001116
41113.53113.4609744467300.0690255532704072
42114.53113.5188349394701.01116506052988
43114.51114.842062851837-0.332062851836938
44115.05114.7857945560260.26420544397412
45116.67116.1937154909330.476284509067455
46117.07116.7609687484860.309031251513616
47116.92117.224674324740-0.304674324739665
48117117.203669270894-0.203669270894281
49117.02117.549610742311-0.529610742310979
50117.35117.3338354959330.0161645040668503
51117.36117.534146260088-0.174146260088264
52117.82118.014709234096-0.194709234095882
53117.88117.899359389291-0.0193593892907273
54118.24117.9241548362920.315845163708474
55118.5118.639165780956-0.139165780956333
56118.8118.7509316734670.0490683265329324
57119.76119.98266366231-0.222663662310097
58120.09119.9561835013870.133816498612504


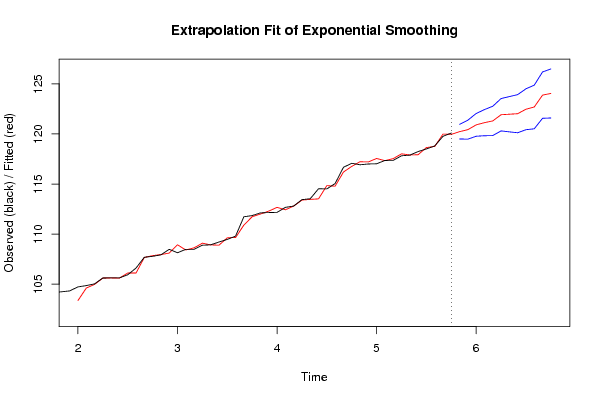
Extrapolation Forecasts of Exponential Smoothing
tForecast95% Lower Bound95% Upper Bound
59120.226866527610119.495761283632120.957971771589
60120.427206141141119.478516106375121.375896175907
61120.905791702873119.770314999450122.041268406296
62121.124636722078119.819589214388122.429684229769
63121.299444358661119.835788601420122.763100115901
64121.916715354507120.301947472475123.531483236539
65121.965771409587120.205242840537123.726299978637
66122.020092537433120.117726852765123.922458222101
67122.463431612958120.422150443244124.504712782672
68122.691376813736120.513370357589124.869383269883
69123.873046383359121.559954176059126.186138590659
70124.039399952275121.59243661849126.486363286060

\begin{tabular}{lllllllll}
\hline
Extrapolation Forecasts of Exponential Smoothing \tabularnewline
t & Forecast & 95% Lower Bound & 95% Upper Bound \tabularnewline
59 & 120.226866527610 & 119.495761283632 & 120.957971771589 \tabularnewline
60 & 120.427206141141 & 119.478516106375 & 121.375896175907 \tabularnewline
61 & 120.905791702873 & 119.770314999450 & 122.041268406296 \tabularnewline
62 & 121.124636722078 & 119.819589214388 & 122.429684229769 \tabularnewline
63 & 121.299444358661 & 119.835788601420 & 122.763100115901 \tabularnewline
64 & 121.916715354507 & 120.301947472475 & 123.531483236539 \tabularnewline
65 & 121.965771409587 & 120.205242840537 & 123.726299978637 \tabularnewline
66 & 122.020092537433 & 120.117726852765 & 123.922458222101 \tabularnewline
67 & 122.463431612958 & 120.422150443244 & 124.504712782672 \tabularnewline
68 & 122.691376813736 & 120.513370357589 & 124.869383269883 \tabularnewline
69 & 123.873046383359 & 121.559954176059 & 126.186138590659 \tabularnewline
70 & 124.039399952275 & 121.59243661849 & 126.486363286060 \tabularnewline
\hline
\end{tabular}
%Source: https://freestatistics.org/blog/index.php?pk=101831&T=3

[TABLE]
[ROW][C]Extrapolation Forecasts of Exponential Smoothing[/C][/ROW]
[ROW][C]t[/C][C]Forecast[/C][C]95% Lower Bound[/C][C]95% Upper Bound[/C][/ROW]
[ROW][C]59[/C][C]120.226866527610[/C][C]119.495761283632[/C][C]120.957971771589[/C][/ROW]
[ROW][C]60[/C][C]120.427206141141[/C][C]119.478516106375[/C][C]121.375896175907[/C][/ROW]
[ROW][C]61[/C][C]120.905791702873[/C][C]119.770314999450[/C][C]122.041268406296[/C][/ROW]
[ROW][C]62[/C][C]121.124636722078[/C][C]119.819589214388[/C][C]122.429684229769[/C][/ROW]
[ROW][C]63[/C][C]121.299444358661[/C][C]119.835788601420[/C][C]122.763100115901[/C][/ROW]
[ROW][C]64[/C][C]121.916715354507[/C][C]120.301947472475[/C][C]123.531483236539[/C][/ROW]
[ROW][C]65[/C][C]121.965771409587[/C][C]120.205242840537[/C][C]123.726299978637[/C][/ROW]
[ROW][C]66[/C][C]122.020092537433[/C][C]120.117726852765[/C][C]123.922458222101[/C][/ROW]
[ROW][C]67[/C][C]122.463431612958[/C][C]120.422150443244[/C][C]124.504712782672[/C][/ROW]
[ROW][C]68[/C][C]122.691376813736[/C][C]120.513370357589[/C][C]124.869383269883[/C][/ROW]
[ROW][C]69[/C][C]123.873046383359[/C][C]121.559954176059[/C][C]126.186138590659[/C][/ROW]
[ROW][C]70[/C][C]124.039399952275[/C][C]121.59243661849[/C][C]126.486363286060[/C][/ROW]
[/TABLE]
Source: https://freestatistics.org/blog/index.php?pk=101831&T=3

Globally Unique Identifier (entire table): ba.freestatistics.org/blog/index.php?pk=101831&T=3

As an alternative you can also use a QR Code:  

The GUIDs for individual cells are displayed in the table below:

Extrapolation Forecasts of Exponential Smoothing
tForecast95% Lower Bound95% Upper Bound
59120.226866527610119.495761283632120.957971771589
60120.427206141141119.478516106375121.375896175907
61120.905791702873119.770314999450122.041268406296
62121.124636722078119.819589214388122.429684229769
63121.299444358661119.835788601420122.763100115901
64121.916715354507120.301947472475123.531483236539
65121.965771409587120.205242840537123.726299978637
66122.020092537433120.117726852765123.922458222101
67122.463431612958120.422150443244124.504712782672
68122.691376813736120.513370357589124.869383269883
69123.873046383359121.559954176059126.186138590659
70124.039399952275121.59243661849126.486363286060


Parameters (Session):
par1 = 12 ; par2 = Triple ; par3 = additive ;
Parameters (R input):
par1 = 12 ; par2 = Triple ; par3 = additive ;
R code (references can be found in the software module):
par1 <- as.numeric(par1)
if (par2 == 'Single') K <- 1
if (par2 == 'Double') K <- 2
if (par2 == 'Triple') K <- par1
nx <- length(x)
nxmK <- nx - K
x <- ts(x, frequency = par1)
if (par2 == 'Single') fit <- HoltWinters(x, gamma=0, beta=0)
if (par2 == 'Double') fit <- HoltWinters(x, gamma=0)
if (par2 == 'Triple') fit <- HoltWinters(x, seasonal=par3)
fit
myresid <- x - fit$fitted[,'xhat']
bitmap(file='test1.png')
op <- par(mfrow=c(2,1))
plot(fit,ylab='Observed (black) / Fitted (red)',main='Interpolation Fit of Exponential Smoothing')
plot(myresid,ylab='Residuals',main='Interpolation Prediction Errors')
par(op)
dev.off()
bitmap(file='test2.png')
p <- predict(fit, par1, prediction.interval=TRUE)
np <- length(p[,1])
plot(fit,p,ylab='Observed (black) / Fitted (red)',main='Extrapolation Fit of Exponential Smoothing')
dev.off()
bitmap(file='test3.png')
op <- par(mfrow = c(2,2))
acf(as.numeric(myresid),lag.max = nx/2,main='Residual ACF')
spectrum(myresid,main='Residals Periodogram')
cpgram(myresid,main='Residal Cumulative Periodogram')
qqnorm(myresid,main='Residual Normal QQ Plot')
qqline(myresid)
par(op)
dev.off()
load(file='createtable')
a<-table.start()
a<-table.row.start(a)
a<-table.element(a,'Estimated Parameters of Exponential Smoothing',2,TRUE)
a<-table.row.end(a)
a<-table.row.start(a)
a<-table.element(a,'Parameter',header=TRUE)
a<-table.element(a,'Value',header=TRUE)
a<-table.row.end(a)
a<-table.row.start(a)
a<-table.element(a,'alpha',header=TRUE)
a<-table.element(a,fit$alpha)
a<-table.row.end(a)
a<-table.row.start(a)
a<-table.element(a,'beta',header=TRUE)
a<-table.element(a,fit$beta)
a<-table.row.end(a)
a<-table.row.start(a)
a<-table.element(a,'gamma',header=TRUE)
a<-table.element(a,fit$gamma)
a<-table.row.end(a)
a<-table.end(a)
table.save(a,file='mytable.tab')
a<-table.start()
a<-table.row.start(a)
a<-table.element(a,'Interpolation Forecasts of Exponential Smoothing',4,TRUE)
a<-table.row.end(a)
a<-table.row.start(a)
a<-table.element(a,'t',header=TRUE)
a<-table.element(a,'Observed',header=TRUE)
a<-table.element(a,'Fitted',header=TRUE)
a<-table.element(a,'Residuals',header=TRUE)
a<-table.row.end(a)
for (i in 1:nxmK) {
a<-table.row.start(a)
a<-table.element(a,i+K,header=TRUE)
a<-table.element(a,x[i+K])
a<-table.element(a,fit$fitted[i,'xhat'])
a<-table.element(a,myresid[i])
a<-table.row.end(a)
}
a<-table.end(a)
table.save(a,file='mytable1.tab')
a<-table.start()
a<-table.row.start(a)
a<-table.element(a,'Extrapolation Forecasts of Exponential Smoothing',4,TRUE)
a<-table.row.end(a)
a<-table.row.start(a)
a<-table.element(a,'t',header=TRUE)
a<-table.element(a,'Forecast',header=TRUE)
a<-table.element(a,'95% Lower Bound',header=TRUE)
a<-table.element(a,'95% Upper Bound',header=TRUE)
a<-table.row.end(a)
for (i in 1:np) {
a<-table.row.start(a)
a<-table.element(a,nx+i,header=TRUE)
a<-table.element(a,p[i,'fit'])
a<-table.element(a,p[i,'lwr'])
a<-table.element(a,p[i,'upr'])
a<-table.row.end(a)
}
a<-table.end(a)
table.save(a,file='mytable2.tab')