| Multiple Linear Regression - Estimated Regression Equation |
| Pas[t] = + 9262.5 + 142.397222222219M1[t] + 976.161111111111M2[t] + 3142.125M3[t] + 4059.28888888889M4[t] + 4894.65277777778M5[t] + 4612.61666666667M6[t] + 2219.78055555556M7[t] + 624.144444444445M8[t] + 4588.50833333333M9[t] + 3298.07222222222M10[t] + 1728.03611111111M11[t] + 57.2361111111111t + e[t] |
| Multiple Linear Regression - Ordinary Least Squares | |||||
| Variable | Parameter | S.D. | T-STAT H0: parameter = 0 | 2-tail p-value | 1-tail p-value |
| (Intercept) | 9262.5 | 785.459143 | 11.7925 | 0 | 0 |
| M1 | 142.397222222219 | 955.555006 | 0.149 | 0.882175 | 0.441088 |
| M2 | 976.161111111111 | 954.127332 | 1.0231 | 0.311501 | 0.155751 |
| M3 | 3142.125 | 952.833784 | 3.2977 | 0.001862 | 0.000931 |
| M4 | 4059.28888888889 | 951.674909 | 4.2654 | 9.6e-05 | 4.8e-05 |
| M5 | 4894.65277777778 | 950.651199 | 5.1487 | 5e-06 | 3e-06 |
| M6 | 4612.61666666667 | 949.76309 | 4.8566 | 1.4e-05 | 7e-06 |
| M7 | 2219.78055555556 | 949.010965 | 2.339 | 0.023636 | 0.011818 |
| M8 | 624.144444444445 | 948.395146 | 0.6581 | 0.513681 | 0.25684 |
| M9 | 4588.50833333333 | 947.9159 | 4.8406 | 1.4e-05 | 7e-06 |
| M10 | 3298.07222222222 | 947.573432 | 3.4805 | 0.001091 | 0.000546 |
| M11 | 1728.03611111111 | 947.367892 | 1.824 | 0.074508 | 0.037254 |
| t | 57.2361111111111 | 11.394241 | 5.0232 | 8e-06 | 4e-06 |
| Multiple Linear Regression - Regression Statistics | |
| Multiple R | 0.832961651367764 |
| R-squared | 0.693825112649312 |
| Adjusted R-squared | 0.615652800985307 |
| F-TEST (value) | 8.87558648171313 |
| F-TEST (DF numerator) | 12 |
| F-TEST (DF denominator) | 47 |
| p-value | 1.58685422579907e-08 |
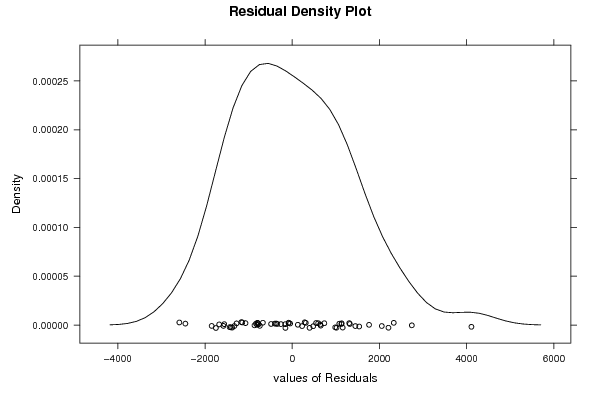
| Multiple Linear Regression - Residual Statistics | |
| Residual Standard Deviation | 1497.81181577026 |
| Sum Squared Residuals | 105441691.066667 |
| Multiple Linear Regression - Actuals, Interpolation, and Residuals | |||
| Time or Index | Actuals | Interpolation Forecast | Residuals Prediction Error |
| 1 | 10057 | 9462.13333333335 | 594.866666666652 |
| 2 | 10900 | 10353.1333333333 | 546.866666666667 |
| 3 | 11771 | 12576.3333333333 | -805.333333333334 |
| 4 | 11992 | 13550.7333333333 | -1558.73333333333 |
| 5 | 11993 | 14443.3333333333 | -2450.33333333333 |
| 6 | 14504 | 14218.5333333333 | 285.466666666667 |
| 7 | 11727 | 11882.9333333333 | -155.933333333333 |
| 8 | 11477 | 10344.5333333333 | 1132.46666666667 |
| 9 | 13578 | 14366.1333333333 | -788.133333333332 |
| 10 | 11555 | 13132.9333333333 | -1577.93333333333 |
| 11 | 11846 | 11620.1333333333 | 225.866666666667 |
| 12 | 11397 | 9949.33333333333 | 1447.66666666667 |
| 13 | 10066 | 10148.9666666667 | -82.9666666666618 |
| 14 | 10269 | 11039.9666666667 | -770.966666666667 |
| 15 | 14279 | 13263.1666666667 | 1015.83333333333 |
| 16 | 13870 | 14237.5666666667 | -367.566666666666 |
| 17 | 13695 | 15130.1666666667 | -1435.16666666667 |
| 18 | 14420 | 14905.3666666667 | -485.366666666666 |
| 19 | 11424 | 12569.7666666667 | -1145.76666666667 |
| 20 | 9704 | 11031.3666666667 | -1327.36666666667 |
| 21 | 12464 | 15052.9666666667 | -2588.96666666667 |
| 22 | 14301 | 13819.7666666667 | 481.233333333334 |
| 23 | 13464 | 12306.9666666667 | 1157.03333333333 |
| 24 | 9893 | 10636.1666666667 | -743.166666666667 |
| 25 | 11572 | 10835.8 | 736.200000000004 |
| 26 | 12380 | 11726.8 | 653.2 |
| 27 | 16692 | 13950 | 2742 |
| 28 | 16052 | 14924.4 | 1127.6 |
| 29 | 16459 | 15817 | 642.000000000001 |
| 30 | 14761 | 15592.2 | -831.2 |
| 31 | 13654 | 13256.6 | 397.4 |
| 32 | 13480 | 11718.2 | 1761.8 |
| 33 | 18068 | 15739.8 | 2328.2 |
| 34 | 16560 | 14506.6 | 2053.4 |
| 35 | 14530 | 12993.8 | 1536.2 |
| 36 | 10650 | 11323 | -673 |
| 37 | 11651 | 11522.6333333333 | 128.36666666667 |
| 38 | 13735 | 12413.6333333333 | 1321.36666666667 |
| 39 | 13360 | 14636.8333333333 | -1276.83333333333 |
| 40 | 17818 | 15611.2333333333 | 2206.76666666667 |
| 41 | 20613 | 16503.8333333333 | 4109.16666666667 |
| 42 | 16231 | 16279.0333333333 | -48.0333333333335 |
| 43 | 13862 | 13943.4333333333 | -81.4333333333333 |
| 44 | 12004 | 12405.0333333333 | -401.033333333333 |
| 45 | 17734 | 16426.6333333333 | 1307.36666666667 |
| 46 | 15034 | 15193.4333333333 | -159.433333333334 |
| 47 | 12609 | 13680.6333333333 | -1071.63333333333 |
| 48 | 12320 | 12009.8333333333 | 310.166666666667 |
| 49 | 10833 | 12209.4666666667 | -1376.46666666666 |
| 50 | 11350 | 13100.4666666667 | -1750.46666666667 |
| 51 | 13648 | 15323.6666666667 | -1675.66666666667 |
| 52 | 14890 | 16298.0666666667 | -1408.06666666667 |
| 53 | 16325 | 17190.6666666667 | -865.666666666667 |
| 54 | 18045 | 16965.8666666667 | 1079.13333333333 |
| 55 | 15616 | 14630.2666666667 | 985.733333333333 |
| 56 | 11926 | 13091.8666666667 | -1165.86666666667 |
| 57 | 16855 | 17113.4666666667 | -258.466666666668 |
| 58 | 15083 | 15880.2666666667 | -797.266666666668 |
| 59 | 12520 | 14367.4666666667 | -1847.46666666667 |
| 60 | 12355 | 12696.6666666667 | -341.666666666668 |
| Goldfeld-Quandt test for Heteroskedasticity | |||
| p-values | Alternative Hypothesis | ||
| breakpoint index | greater | 2-sided | less |
| 16 | 0.263411550389886 | 0.526823100779772 | 0.736588449610114 |
| 17 | 0.167824741412913 | 0.335649482825826 | 0.832175258587087 |
| 18 | 0.110397936179223 | 0.220795872358446 | 0.889602063820777 |
| 19 | 0.0815970549626253 | 0.163194109925251 | 0.918402945037375 |
| 20 | 0.137524849221664 | 0.275049698443327 | 0.862475150778336 |
| 21 | 0.230854573133665 | 0.46170914626733 | 0.769145426866335 |
| 22 | 0.300593509508998 | 0.601187019017995 | 0.699406490491002 |
| 23 | 0.233723095916415 | 0.46744619183283 | 0.766276904083585 |
| 24 | 0.281643016287425 | 0.563286032574849 | 0.718356983712575 |
| 25 | 0.213326184801159 | 0.426652369602317 | 0.786673815198841 |
| 26 | 0.162727670537481 | 0.325455341074963 | 0.837272329462519 |
| 27 | 0.313892867654523 | 0.627785735309047 | 0.686107132345477 |
| 28 | 0.291088539531903 | 0.582177079063805 | 0.708911460468097 |
| 29 | 0.357526917226846 | 0.715053834453692 | 0.642473082773154 |
| 30 | 0.459947210798434 | 0.919894421596868 | 0.540052789201566 |
| 31 | 0.439507394850457 | 0.879014789700914 | 0.560492605149543 |
| 32 | 0.38050742337445 | 0.7610148467489 | 0.61949257662555 |
| 33 | 0.460627656975827 | 0.921255313951654 | 0.539372343024173 |
| 34 | 0.411283373982435 | 0.822566747964871 | 0.588716626017564 |
| 35 | 0.359489490350102 | 0.718978980700204 | 0.640510509649898 |
| 36 | 0.458670540355778 | 0.917341080711556 | 0.541329459644222 |
| 37 | 0.387222019687191 | 0.774444039374382 | 0.612777980312809 |
| 38 | 0.3541597302081 | 0.7083194604162 | 0.6458402697919 |
| 39 | 0.383724165982367 | 0.767448331964733 | 0.616275834017633 |
| 40 | 0.445317713452923 | 0.890635426905845 | 0.554682286547078 |
| 41 | 0.95982781111477 | 0.0803443777704597 | 0.0401721888852298 |
| 42 | 0.96848679505443 | 0.063026409891139 | 0.0315132049455695 |
| 43 | 0.997278067458547 | 0.00544386508290606 | 0.00272193254145303 |
| 44 | 0.986257928310456 | 0.0274841433790885 | 0.0137420716895443 |
| Meta Analysis of Goldfeld-Quandt test for Heteroskedasticity | |||
| Description | # significant tests | % significant tests | OK/NOK |
| 1% type I error level | 1 | 0.0344827586206897 | NOK |
| 5% type I error level | 2 | 0.0689655172413793 | NOK |
| 10% type I error level | 4 | 0.137931034482759 | NOK |