Free Statistics

of Irreproducible Research!

Author's title

Author*The author of this computation has been verified*
R Software Modulerwasp_multipleregression.wasp
Title produced by softwareMultiple Regression
Date of computationFri, 26 Nov 2010 12:03:41 +0000
Cite this page as followsStatistical Computations at FreeStatistics.org, Office for Research Development and Education, URL https://freestatistics.org/blog/index.php?v=date/2010/Nov/26/t1290772960ux03i34e0hc0umz.htm/, Retrieved Fri, 03 May 2024 18:54:43 +0000
Statistical Computations at FreeStatistics.org, Office for Research Development and Education, URL https://freestatistics.org/blog/index.php?pk=101786, Retrieved Fri, 03 May 2024 18:54:43 +0000
QR Codes:

Original text written by user:
IsPrivate?No (this computation is public)
User-defined keywords
Estimated Impact165
Family? (F = Feedback message, R = changed R code, M = changed R Module, P = changed Parameters, D = changed Data)
-     [Multiple Regression] [HPC Retail Sales] [2008-03-08 13:40:54] [1c0f2c85e8a48e42648374b3bcceca26]
-  M D  [Multiple Regression] [W8 Regressiemodel] [2010-11-26 11:00:47] [56d90b683fcd93137645f9226b43c62b]
-   PD      [Multiple Regression] [W8 Regressiemodel] [2010-11-26 12:03:41] [59f7d3e7fcb6374015f4e6b9053b0f01] [Current]
-    D        [Multiple Regression] [Paper Multiple Re...] [2010-12-11 10:24:16] [56d90b683fcd93137645f9226b43c62b]
-    D        [Multiple Regression] [Paper MR Time Series] [2010-12-11 10:40:35] [56d90b683fcd93137645f9226b43c62b]
Feedback Forum

Post a new message
Dataseries X:
10057
10900
11771
11992
11993
14504
11727
11477
13578
11555
11846
11397
10066
10269
14279
13870
13695
14420
11424
9704
12464
14301
13464
9893
11572
12380
16692
16052
16459
14761
13654
13480
18068
16560
14530
10650
11651
13735
13360
17818
20613
16231
13862
12004
17734
15034
12609
12320
10833
11350
13648
14890
16325
18045
15616
11926
16855
15083
12520
12355


Summary of computational transaction
Raw Inputview raw input (R code)
Raw Outputview raw output of R engine
Computing time5 seconds
R Server'Sir Ronald Aylmer Fisher' @ 193.190.124.24

\begin{tabular}{lllllllll}
\hline
Summary of computational transaction \tabularnewline
Raw Input & view raw input (R code)  \tabularnewline
Raw Output & view raw output of R engine  \tabularnewline
Computing time & 5 seconds \tabularnewline
R Server & 'Sir Ronald Aylmer Fisher' @ 193.190.124.24 \tabularnewline
\hline
\end{tabular}
%Source: https://freestatistics.org/blog/index.php?pk=101786&T=0

[TABLE]
[ROW][C]Summary of computational transaction[/C][/ROW]
[ROW][C]Raw Input[/C][C]view raw input (R code) [/C][/ROW]
[ROW][C]Raw Output[/C][C]view raw output of R engine [/C][/ROW]
[ROW][C]Computing time[/C][C]5 seconds[/C][/ROW]
[ROW][C]R Server[/C][C]'Sir Ronald Aylmer Fisher' @ 193.190.124.24[/C][/ROW]
[/TABLE]
Source: https://freestatistics.org/blog/index.php?pk=101786&T=0

Globally Unique Identifier (entire table): ba.freestatistics.org/blog/index.php?pk=101786&T=0

As an alternative you can also use a QR Code:  

The GUIDs for individual cells are displayed in the table below:

Summary of computational transaction
Raw Inputview raw input (R code)
Raw Outputview raw output of R engine
Computing time5 seconds
R Server'Sir Ronald Aylmer Fisher' @ 193.190.124.24


Multiple Linear Regression - Estimated Regression Equation
Pas[t] = + 9262.5 + 142.397222222219M1[t] + 976.161111111111M2[t] + 3142.125M3[t] + 4059.28888888889M4[t] + 4894.65277777778M5[t] + 4612.61666666667M6[t] + 2219.78055555556M7[t] + 624.144444444445M8[t] + 4588.50833333333M9[t] + 3298.07222222222M10[t] + 1728.03611111111M11[t] + 57.2361111111111t + e[t]

\begin{tabular}{lllllllll}
\hline
Multiple Linear Regression - Estimated Regression Equation \tabularnewline
Pas[t] =  +  9262.5 +  142.397222222219M1[t] +  976.161111111111M2[t] +  3142.125M3[t] +  4059.28888888889M4[t] +  4894.65277777778M5[t] +  4612.61666666667M6[t] +  2219.78055555556M7[t] +  624.144444444445M8[t] +  4588.50833333333M9[t] +  3298.07222222222M10[t] +  1728.03611111111M11[t] +  57.2361111111111t  + e[t] \tabularnewline
\hline
\end{tabular}
%Source: https://freestatistics.org/blog/index.php?pk=101786&T=1

[TABLE]
[ROW][C]Multiple Linear Regression - Estimated Regression Equation[/C][/ROW]
[ROW][C]Pas[t] =  +  9262.5 +  142.397222222219M1[t] +  976.161111111111M2[t] +  3142.125M3[t] +  4059.28888888889M4[t] +  4894.65277777778M5[t] +  4612.61666666667M6[t] +  2219.78055555556M7[t] +  624.144444444445M8[t] +  4588.50833333333M9[t] +  3298.07222222222M10[t] +  1728.03611111111M11[t] +  57.2361111111111t  + e[t][/C][/ROW]
[/TABLE]
Source: https://freestatistics.org/blog/index.php?pk=101786&T=1

Globally Unique Identifier (entire table): ba.freestatistics.org/blog/index.php?pk=101786&T=1

As an alternative you can also use a QR Code:  

The GUIDs for individual cells are displayed in the table below:

Multiple Linear Regression - Estimated Regression Equation
Pas[t] = + 9262.5 + 142.397222222219M1[t] + 976.161111111111M2[t] + 3142.125M3[t] + 4059.28888888889M4[t] + 4894.65277777778M5[t] + 4612.61666666667M6[t] + 2219.78055555556M7[t] + 624.144444444445M8[t] + 4588.50833333333M9[t] + 3298.07222222222M10[t] + 1728.03611111111M11[t] + 57.2361111111111t + e[t]


Multiple Linear Regression - Ordinary Least Squares
VariableParameterS.D.T-STATH0: parameter = 02-tail p-value1-tail p-value
(Intercept)9262.5785.45914311.792500
M1142.397222222219955.5550060.1490.8821750.441088
M2976.161111111111954.1273321.02310.3115010.155751
M33142.125952.8337843.29770.0018620.000931
M44059.28888888889951.6749094.26549.6e-054.8e-05
M54894.65277777778950.6511995.14875e-063e-06
M64612.61666666667949.763094.85661.4e-057e-06
M72219.78055555556949.0109652.3390.0236360.011818
M8624.144444444445948.3951460.65810.5136810.25684
M94588.50833333333947.91594.84061.4e-057e-06
M103298.07222222222947.5734323.48050.0010910.000546
M111728.03611111111947.3678921.8240.0745080.037254
t57.236111111111111.3942415.02328e-064e-06

\begin{tabular}{lllllllll}
\hline
Multiple Linear Regression - Ordinary Least Squares \tabularnewline
Variable & Parameter & S.D. & T-STATH0: parameter = 0 & 2-tail p-value & 1-tail p-value \tabularnewline
(Intercept) & 9262.5 & 785.459143 & 11.7925 & 0 & 0 \tabularnewline
M1 & 142.397222222219 & 955.555006 & 0.149 & 0.882175 & 0.441088 \tabularnewline
M2 & 976.161111111111 & 954.127332 & 1.0231 & 0.311501 & 0.155751 \tabularnewline
M3 & 3142.125 & 952.833784 & 3.2977 & 0.001862 & 0.000931 \tabularnewline
M4 & 4059.28888888889 & 951.674909 & 4.2654 & 9.6e-05 & 4.8e-05 \tabularnewline
M5 & 4894.65277777778 & 950.651199 & 5.1487 & 5e-06 & 3e-06 \tabularnewline
M6 & 4612.61666666667 & 949.76309 & 4.8566 & 1.4e-05 & 7e-06 \tabularnewline
M7 & 2219.78055555556 & 949.010965 & 2.339 & 0.023636 & 0.011818 \tabularnewline
M8 & 624.144444444445 & 948.395146 & 0.6581 & 0.513681 & 0.25684 \tabularnewline
M9 & 4588.50833333333 & 947.9159 & 4.8406 & 1.4e-05 & 7e-06 \tabularnewline
M10 & 3298.07222222222 & 947.573432 & 3.4805 & 0.001091 & 0.000546 \tabularnewline
M11 & 1728.03611111111 & 947.367892 & 1.824 & 0.074508 & 0.037254 \tabularnewline
t & 57.2361111111111 & 11.394241 & 5.0232 & 8e-06 & 4e-06 \tabularnewline
\hline
\end{tabular}
%Source: https://freestatistics.org/blog/index.php?pk=101786&T=2

[TABLE]
[ROW][C]Multiple Linear Regression - Ordinary Least Squares[/C][/ROW]
[ROW][C]Variable[/C][C]Parameter[/C][C]S.D.[/C][C]T-STATH0: parameter = 0[/C][C]2-tail p-value[/C][C]1-tail p-value[/C][/ROW]
[ROW][C](Intercept)[/C][C]9262.5[/C][C]785.459143[/C][C]11.7925[/C][C]0[/C][C]0[/C][/ROW]
[ROW][C]M1[/C][C]142.397222222219[/C][C]955.555006[/C][C]0.149[/C][C]0.882175[/C][C]0.441088[/C][/ROW]
[ROW][C]M2[/C][C]976.161111111111[/C][C]954.127332[/C][C]1.0231[/C][C]0.311501[/C][C]0.155751[/C][/ROW]
[ROW][C]M3[/C][C]3142.125[/C][C]952.833784[/C][C]3.2977[/C][C]0.001862[/C][C]0.000931[/C][/ROW]
[ROW][C]M4[/C][C]4059.28888888889[/C][C]951.674909[/C][C]4.2654[/C][C]9.6e-05[/C][C]4.8e-05[/C][/ROW]
[ROW][C]M5[/C][C]4894.65277777778[/C][C]950.651199[/C][C]5.1487[/C][C]5e-06[/C][C]3e-06[/C][/ROW]
[ROW][C]M6[/C][C]4612.61666666667[/C][C]949.76309[/C][C]4.8566[/C][C]1.4e-05[/C][C]7e-06[/C][/ROW]
[ROW][C]M7[/C][C]2219.78055555556[/C][C]949.010965[/C][C]2.339[/C][C]0.023636[/C][C]0.011818[/C][/ROW]
[ROW][C]M8[/C][C]624.144444444445[/C][C]948.395146[/C][C]0.6581[/C][C]0.513681[/C][C]0.25684[/C][/ROW]
[ROW][C]M9[/C][C]4588.50833333333[/C][C]947.9159[/C][C]4.8406[/C][C]1.4e-05[/C][C]7e-06[/C][/ROW]
[ROW][C]M10[/C][C]3298.07222222222[/C][C]947.573432[/C][C]3.4805[/C][C]0.001091[/C][C]0.000546[/C][/ROW]
[ROW][C]M11[/C][C]1728.03611111111[/C][C]947.367892[/C][C]1.824[/C][C]0.074508[/C][C]0.037254[/C][/ROW]
[ROW][C]t[/C][C]57.2361111111111[/C][C]11.394241[/C][C]5.0232[/C][C]8e-06[/C][C]4e-06[/C][/ROW]
[/TABLE]
Source: https://freestatistics.org/blog/index.php?pk=101786&T=2

Globally Unique Identifier (entire table): ba.freestatistics.org/blog/index.php?pk=101786&T=2

As an alternative you can also use a QR Code:  

The GUIDs for individual cells are displayed in the table below:

Multiple Linear Regression - Ordinary Least Squares
VariableParameterS.D.T-STATH0: parameter = 02-tail p-value1-tail p-value
(Intercept)9262.5785.45914311.792500
M1142.397222222219955.5550060.1490.8821750.441088
M2976.161111111111954.1273321.02310.3115010.155751
M33142.125952.8337843.29770.0018620.000931
M44059.28888888889951.6749094.26549.6e-054.8e-05
M54894.65277777778950.6511995.14875e-063e-06
M64612.61666666667949.763094.85661.4e-057e-06
M72219.78055555556949.0109652.3390.0236360.011818
M8624.144444444445948.3951460.65810.5136810.25684
M94588.50833333333947.91594.84061.4e-057e-06
M103298.07222222222947.5734323.48050.0010910.000546
M111728.03611111111947.3678921.8240.0745080.037254
t57.236111111111111.3942415.02328e-064e-06


Multiple Linear Regression - Regression Statistics
Multiple R0.832961651367764
R-squared0.693825112649312
Adjusted R-squared0.615652800985307
F-TEST (value)8.87558648171313
F-TEST (DF numerator)12
F-TEST (DF denominator)47
p-value1.58685422579907e-08
Multiple Linear Regression - Residual Statistics
Residual Standard Deviation1497.81181577026
Sum Squared Residuals105441691.066667

\begin{tabular}{lllllllll}
\hline
Multiple Linear Regression - Regression Statistics \tabularnewline
Multiple R & 0.832961651367764 \tabularnewline
R-squared & 0.693825112649312 \tabularnewline
Adjusted R-squared & 0.615652800985307 \tabularnewline
F-TEST (value) & 8.87558648171313 \tabularnewline
F-TEST (DF numerator) & 12 \tabularnewline
F-TEST (DF denominator) & 47 \tabularnewline
p-value & 1.58685422579907e-08 \tabularnewline
Multiple Linear Regression - Residual Statistics \tabularnewline
Residual Standard Deviation & 1497.81181577026 \tabularnewline
Sum Squared Residuals & 105441691.066667 \tabularnewline
\hline
\end{tabular}
%Source: https://freestatistics.org/blog/index.php?pk=101786&T=3

[TABLE]
[ROW][C]Multiple Linear Regression - Regression Statistics[/C][/ROW]
[ROW][C]Multiple R[/C][C]0.832961651367764[/C][/ROW]
[ROW][C]R-squared[/C][C]0.693825112649312[/C][/ROW]
[ROW][C]Adjusted R-squared[/C][C]0.615652800985307[/C][/ROW]
[ROW][C]F-TEST (value)[/C][C]8.87558648171313[/C][/ROW]
[ROW][C]F-TEST (DF numerator)[/C][C]12[/C][/ROW]
[ROW][C]F-TEST (DF denominator)[/C][C]47[/C][/ROW]
[ROW][C]p-value[/C][C]1.58685422579907e-08[/C][/ROW]
[ROW][C]Multiple Linear Regression - Residual Statistics[/C][/ROW]
[ROW][C]Residual Standard Deviation[/C][C]1497.81181577026[/C][/ROW]
[ROW][C]Sum Squared Residuals[/C][C]105441691.066667[/C][/ROW]
[/TABLE]
Source: https://freestatistics.org/blog/index.php?pk=101786&T=3

Globally Unique Identifier (entire table): ba.freestatistics.org/blog/index.php?pk=101786&T=3

As an alternative you can also use a QR Code:  

The GUIDs for individual cells are displayed in the table below:

Multiple Linear Regression - Regression Statistics
Multiple R0.832961651367764
R-squared0.693825112649312
Adjusted R-squared0.615652800985307
F-TEST (value)8.87558648171313
F-TEST (DF numerator)12
F-TEST (DF denominator)47
p-value1.58685422579907e-08
Multiple Linear Regression - Residual Statistics
Residual Standard Deviation1497.81181577026
Sum Squared Residuals105441691.066667


Multiple Linear Regression - Actuals, Interpolation, and Residuals
Time or IndexActualsInterpolationForecastResidualsPrediction Error
1100579462.13333333335594.866666666652
21090010353.1333333333546.866666666667
31177112576.3333333333-805.333333333334
41199213550.7333333333-1558.73333333333
51199314443.3333333333-2450.33333333333
61450414218.5333333333285.466666666667
71172711882.9333333333-155.933333333333
81147710344.53333333331132.46666666667
91357814366.1333333333-788.133333333332
101155513132.9333333333-1577.93333333333
111184611620.1333333333225.866666666667
12113979949.333333333331447.66666666667
131006610148.9666666667-82.9666666666618
141026911039.9666666667-770.966666666667
151427913263.16666666671015.83333333333
161387014237.5666666667-367.566666666666
171369515130.1666666667-1435.16666666667
181442014905.3666666667-485.366666666666
191142412569.7666666667-1145.76666666667
20970411031.3666666667-1327.36666666667
211246415052.9666666667-2588.96666666667
221430113819.7666666667481.233333333334
231346412306.96666666671157.03333333333
24989310636.1666666667-743.166666666667
251157210835.8736.200000000004
261238011726.8653.2
2716692139502742
281605214924.41127.6
291645915817642.000000000001
301476115592.2-831.2
311365413256.6397.4
321348011718.21761.8
331806815739.82328.2
341656014506.62053.4
351453012993.81536.2
361065011323-673
371165111522.6333333333128.36666666667
381373512413.63333333331321.36666666667
391336014636.8333333333-1276.83333333333
401781815611.23333333332206.76666666667
412061316503.83333333334109.16666666667
421623116279.0333333333-48.0333333333335
431386213943.4333333333-81.4333333333333
441200412405.0333333333-401.033333333333
451773416426.63333333331307.36666666667
461503415193.4333333333-159.433333333334
471260913680.6333333333-1071.63333333333
481232012009.8333333333310.166666666667
491083312209.4666666667-1376.46666666666
501135013100.4666666667-1750.46666666667
511364815323.6666666667-1675.66666666667
521489016298.0666666667-1408.06666666667
531632517190.6666666667-865.666666666667
541804516965.86666666671079.13333333333
551561614630.2666666667985.733333333333
561192613091.8666666667-1165.86666666667
571685517113.4666666667-258.466666666668
581508315880.2666666667-797.266666666668
591252014367.4666666667-1847.46666666667
601235512696.6666666667-341.666666666668

\begin{tabular}{lllllllll}
\hline
Multiple Linear Regression - Actuals, Interpolation, and Residuals \tabularnewline
Time or Index & Actuals & InterpolationForecast & ResidualsPrediction Error \tabularnewline
1 & 10057 & 9462.13333333335 & 594.866666666652 \tabularnewline
2 & 10900 & 10353.1333333333 & 546.866666666667 \tabularnewline
3 & 11771 & 12576.3333333333 & -805.333333333334 \tabularnewline
4 & 11992 & 13550.7333333333 & -1558.73333333333 \tabularnewline
5 & 11993 & 14443.3333333333 & -2450.33333333333 \tabularnewline
6 & 14504 & 14218.5333333333 & 285.466666666667 \tabularnewline
7 & 11727 & 11882.9333333333 & -155.933333333333 \tabularnewline
8 & 11477 & 10344.5333333333 & 1132.46666666667 \tabularnewline
9 & 13578 & 14366.1333333333 & -788.133333333332 \tabularnewline
10 & 11555 & 13132.9333333333 & -1577.93333333333 \tabularnewline
11 & 11846 & 11620.1333333333 & 225.866666666667 \tabularnewline
12 & 11397 & 9949.33333333333 & 1447.66666666667 \tabularnewline
13 & 10066 & 10148.9666666667 & -82.9666666666618 \tabularnewline
14 & 10269 & 11039.9666666667 & -770.966666666667 \tabularnewline
15 & 14279 & 13263.1666666667 & 1015.83333333333 \tabularnewline
16 & 13870 & 14237.5666666667 & -367.566666666666 \tabularnewline
17 & 13695 & 15130.1666666667 & -1435.16666666667 \tabularnewline
18 & 14420 & 14905.3666666667 & -485.366666666666 \tabularnewline
19 & 11424 & 12569.7666666667 & -1145.76666666667 \tabularnewline
20 & 9704 & 11031.3666666667 & -1327.36666666667 \tabularnewline
21 & 12464 & 15052.9666666667 & -2588.96666666667 \tabularnewline
22 & 14301 & 13819.7666666667 & 481.233333333334 \tabularnewline
23 & 13464 & 12306.9666666667 & 1157.03333333333 \tabularnewline
24 & 9893 & 10636.1666666667 & -743.166666666667 \tabularnewline
25 & 11572 & 10835.8 & 736.200000000004 \tabularnewline
26 & 12380 & 11726.8 & 653.2 \tabularnewline
27 & 16692 & 13950 & 2742 \tabularnewline
28 & 16052 & 14924.4 & 1127.6 \tabularnewline
29 & 16459 & 15817 & 642.000000000001 \tabularnewline
30 & 14761 & 15592.2 & -831.2 \tabularnewline
31 & 13654 & 13256.6 & 397.4 \tabularnewline
32 & 13480 & 11718.2 & 1761.8 \tabularnewline
33 & 18068 & 15739.8 & 2328.2 \tabularnewline
34 & 16560 & 14506.6 & 2053.4 \tabularnewline
35 & 14530 & 12993.8 & 1536.2 \tabularnewline
36 & 10650 & 11323 & -673 \tabularnewline
37 & 11651 & 11522.6333333333 & 128.36666666667 \tabularnewline
38 & 13735 & 12413.6333333333 & 1321.36666666667 \tabularnewline
39 & 13360 & 14636.8333333333 & -1276.83333333333 \tabularnewline
40 & 17818 & 15611.2333333333 & 2206.76666666667 \tabularnewline
41 & 20613 & 16503.8333333333 & 4109.16666666667 \tabularnewline
42 & 16231 & 16279.0333333333 & -48.0333333333335 \tabularnewline
43 & 13862 & 13943.4333333333 & -81.4333333333333 \tabularnewline
44 & 12004 & 12405.0333333333 & -401.033333333333 \tabularnewline
45 & 17734 & 16426.6333333333 & 1307.36666666667 \tabularnewline
46 & 15034 & 15193.4333333333 & -159.433333333334 \tabularnewline
47 & 12609 & 13680.6333333333 & -1071.63333333333 \tabularnewline
48 & 12320 & 12009.8333333333 & 310.166666666667 \tabularnewline
49 & 10833 & 12209.4666666667 & -1376.46666666666 \tabularnewline
50 & 11350 & 13100.4666666667 & -1750.46666666667 \tabularnewline
51 & 13648 & 15323.6666666667 & -1675.66666666667 \tabularnewline
52 & 14890 & 16298.0666666667 & -1408.06666666667 \tabularnewline
53 & 16325 & 17190.6666666667 & -865.666666666667 \tabularnewline
54 & 18045 & 16965.8666666667 & 1079.13333333333 \tabularnewline
55 & 15616 & 14630.2666666667 & 985.733333333333 \tabularnewline
56 & 11926 & 13091.8666666667 & -1165.86666666667 \tabularnewline
57 & 16855 & 17113.4666666667 & -258.466666666668 \tabularnewline
58 & 15083 & 15880.2666666667 & -797.266666666668 \tabularnewline
59 & 12520 & 14367.4666666667 & -1847.46666666667 \tabularnewline
60 & 12355 & 12696.6666666667 & -341.666666666668 \tabularnewline
\hline
\end{tabular}
%Source: https://freestatistics.org/blog/index.php?pk=101786&T=4

[TABLE]
[ROW][C]Multiple Linear Regression - Actuals, Interpolation, and Residuals[/C][/ROW]
[ROW][C]Time or Index[/C][C]Actuals[/C][C]InterpolationForecast[/C][C]ResidualsPrediction Error[/C][/ROW]
[ROW][C]1[/C][C]10057[/C][C]9462.13333333335[/C][C]594.866666666652[/C][/ROW]
[ROW][C]2[/C][C]10900[/C][C]10353.1333333333[/C][C]546.866666666667[/C][/ROW]
[ROW][C]3[/C][C]11771[/C][C]12576.3333333333[/C][C]-805.333333333334[/C][/ROW]
[ROW][C]4[/C][C]11992[/C][C]13550.7333333333[/C][C]-1558.73333333333[/C][/ROW]
[ROW][C]5[/C][C]11993[/C][C]14443.3333333333[/C][C]-2450.33333333333[/C][/ROW]
[ROW][C]6[/C][C]14504[/C][C]14218.5333333333[/C][C]285.466666666667[/C][/ROW]
[ROW][C]7[/C][C]11727[/C][C]11882.9333333333[/C][C]-155.933333333333[/C][/ROW]
[ROW][C]8[/C][C]11477[/C][C]10344.5333333333[/C][C]1132.46666666667[/C][/ROW]
[ROW][C]9[/C][C]13578[/C][C]14366.1333333333[/C][C]-788.133333333332[/C][/ROW]
[ROW][C]10[/C][C]11555[/C][C]13132.9333333333[/C][C]-1577.93333333333[/C][/ROW]
[ROW][C]11[/C][C]11846[/C][C]11620.1333333333[/C][C]225.866666666667[/C][/ROW]
[ROW][C]12[/C][C]11397[/C][C]9949.33333333333[/C][C]1447.66666666667[/C][/ROW]
[ROW][C]13[/C][C]10066[/C][C]10148.9666666667[/C][C]-82.9666666666618[/C][/ROW]
[ROW][C]14[/C][C]10269[/C][C]11039.9666666667[/C][C]-770.966666666667[/C][/ROW]
[ROW][C]15[/C][C]14279[/C][C]13263.1666666667[/C][C]1015.83333333333[/C][/ROW]
[ROW][C]16[/C][C]13870[/C][C]14237.5666666667[/C][C]-367.566666666666[/C][/ROW]
[ROW][C]17[/C][C]13695[/C][C]15130.1666666667[/C][C]-1435.16666666667[/C][/ROW]
[ROW][C]18[/C][C]14420[/C][C]14905.3666666667[/C][C]-485.366666666666[/C][/ROW]
[ROW][C]19[/C][C]11424[/C][C]12569.7666666667[/C][C]-1145.76666666667[/C][/ROW]
[ROW][C]20[/C][C]9704[/C][C]11031.3666666667[/C][C]-1327.36666666667[/C][/ROW]
[ROW][C]21[/C][C]12464[/C][C]15052.9666666667[/C][C]-2588.96666666667[/C][/ROW]
[ROW][C]22[/C][C]14301[/C][C]13819.7666666667[/C][C]481.233333333334[/C][/ROW]
[ROW][C]23[/C][C]13464[/C][C]12306.9666666667[/C][C]1157.03333333333[/C][/ROW]
[ROW][C]24[/C][C]9893[/C][C]10636.1666666667[/C][C]-743.166666666667[/C][/ROW]
[ROW][C]25[/C][C]11572[/C][C]10835.8[/C][C]736.200000000004[/C][/ROW]
[ROW][C]26[/C][C]12380[/C][C]11726.8[/C][C]653.2[/C][/ROW]
[ROW][C]27[/C][C]16692[/C][C]13950[/C][C]2742[/C][/ROW]
[ROW][C]28[/C][C]16052[/C][C]14924.4[/C][C]1127.6[/C][/ROW]
[ROW][C]29[/C][C]16459[/C][C]15817[/C][C]642.000000000001[/C][/ROW]
[ROW][C]30[/C][C]14761[/C][C]15592.2[/C][C]-831.2[/C][/ROW]
[ROW][C]31[/C][C]13654[/C][C]13256.6[/C][C]397.4[/C][/ROW]
[ROW][C]32[/C][C]13480[/C][C]11718.2[/C][C]1761.8[/C][/ROW]
[ROW][C]33[/C][C]18068[/C][C]15739.8[/C][C]2328.2[/C][/ROW]
[ROW][C]34[/C][C]16560[/C][C]14506.6[/C][C]2053.4[/C][/ROW]
[ROW][C]35[/C][C]14530[/C][C]12993.8[/C][C]1536.2[/C][/ROW]
[ROW][C]36[/C][C]10650[/C][C]11323[/C][C]-673[/C][/ROW]
[ROW][C]37[/C][C]11651[/C][C]11522.6333333333[/C][C]128.36666666667[/C][/ROW]
[ROW][C]38[/C][C]13735[/C][C]12413.6333333333[/C][C]1321.36666666667[/C][/ROW]
[ROW][C]39[/C][C]13360[/C][C]14636.8333333333[/C][C]-1276.83333333333[/C][/ROW]
[ROW][C]40[/C][C]17818[/C][C]15611.2333333333[/C][C]2206.76666666667[/C][/ROW]
[ROW][C]41[/C][C]20613[/C][C]16503.8333333333[/C][C]4109.16666666667[/C][/ROW]
[ROW][C]42[/C][C]16231[/C][C]16279.0333333333[/C][C]-48.0333333333335[/C][/ROW]
[ROW][C]43[/C][C]13862[/C][C]13943.4333333333[/C][C]-81.4333333333333[/C][/ROW]
[ROW][C]44[/C][C]12004[/C][C]12405.0333333333[/C][C]-401.033333333333[/C][/ROW]
[ROW][C]45[/C][C]17734[/C][C]16426.6333333333[/C][C]1307.36666666667[/C][/ROW]
[ROW][C]46[/C][C]15034[/C][C]15193.4333333333[/C][C]-159.433333333334[/C][/ROW]
[ROW][C]47[/C][C]12609[/C][C]13680.6333333333[/C][C]-1071.63333333333[/C][/ROW]
[ROW][C]48[/C][C]12320[/C][C]12009.8333333333[/C][C]310.166666666667[/C][/ROW]
[ROW][C]49[/C][C]10833[/C][C]12209.4666666667[/C][C]-1376.46666666666[/C][/ROW]
[ROW][C]50[/C][C]11350[/C][C]13100.4666666667[/C][C]-1750.46666666667[/C][/ROW]
[ROW][C]51[/C][C]13648[/C][C]15323.6666666667[/C][C]-1675.66666666667[/C][/ROW]
[ROW][C]52[/C][C]14890[/C][C]16298.0666666667[/C][C]-1408.06666666667[/C][/ROW]
[ROW][C]53[/C][C]16325[/C][C]17190.6666666667[/C][C]-865.666666666667[/C][/ROW]
[ROW][C]54[/C][C]18045[/C][C]16965.8666666667[/C][C]1079.13333333333[/C][/ROW]
[ROW][C]55[/C][C]15616[/C][C]14630.2666666667[/C][C]985.733333333333[/C][/ROW]
[ROW][C]56[/C][C]11926[/C][C]13091.8666666667[/C][C]-1165.86666666667[/C][/ROW]
[ROW][C]57[/C][C]16855[/C][C]17113.4666666667[/C][C]-258.466666666668[/C][/ROW]
[ROW][C]58[/C][C]15083[/C][C]15880.2666666667[/C][C]-797.266666666668[/C][/ROW]
[ROW][C]59[/C][C]12520[/C][C]14367.4666666667[/C][C]-1847.46666666667[/C][/ROW]
[ROW][C]60[/C][C]12355[/C][C]12696.6666666667[/C][C]-341.666666666668[/C][/ROW]
[/TABLE]
Source: https://freestatistics.org/blog/index.php?pk=101786&T=4

Globally Unique Identifier (entire table): ba.freestatistics.org/blog/index.php?pk=101786&T=4

As an alternative you can also use a QR Code:  

The GUIDs for individual cells are displayed in the table below:

Multiple Linear Regression - Actuals, Interpolation, and Residuals
Time or IndexActualsInterpolationForecastResidualsPrediction Error
1100579462.13333333335594.866666666652
21090010353.1333333333546.866666666667
31177112576.3333333333-805.333333333334
41199213550.7333333333-1558.73333333333
51199314443.3333333333-2450.33333333333
61450414218.5333333333285.466666666667
71172711882.9333333333-155.933333333333
81147710344.53333333331132.46666666667
91357814366.1333333333-788.133333333332
101155513132.9333333333-1577.93333333333
111184611620.1333333333225.866666666667
12113979949.333333333331447.66666666667
131006610148.9666666667-82.9666666666618
141026911039.9666666667-770.966666666667
151427913263.16666666671015.83333333333
161387014237.5666666667-367.566666666666
171369515130.1666666667-1435.16666666667
181442014905.3666666667-485.366666666666
191142412569.7666666667-1145.76666666667
20970411031.3666666667-1327.36666666667
211246415052.9666666667-2588.96666666667
221430113819.7666666667481.233333333334
231346412306.96666666671157.03333333333
24989310636.1666666667-743.166666666667
251157210835.8736.200000000004
261238011726.8653.2
2716692139502742
281605214924.41127.6
291645915817642.000000000001
301476115592.2-831.2
311365413256.6397.4
321348011718.21761.8
331806815739.82328.2
341656014506.62053.4
351453012993.81536.2
361065011323-673
371165111522.6333333333128.36666666667
381373512413.63333333331321.36666666667
391336014636.8333333333-1276.83333333333
401781815611.23333333332206.76666666667
412061316503.83333333334109.16666666667
421623116279.0333333333-48.0333333333335
431386213943.4333333333-81.4333333333333
441200412405.0333333333-401.033333333333
451773416426.63333333331307.36666666667
461503415193.4333333333-159.433333333334
471260913680.6333333333-1071.63333333333
481232012009.8333333333310.166666666667
491083312209.4666666667-1376.46666666666
501135013100.4666666667-1750.46666666667
511364815323.6666666667-1675.66666666667
521489016298.0666666667-1408.06666666667
531632517190.6666666667-865.666666666667
541804516965.86666666671079.13333333333
551561614630.2666666667985.733333333333
561192613091.8666666667-1165.86666666667
571685517113.4666666667-258.466666666668
581508315880.2666666667-797.266666666668
591252014367.4666666667-1847.46666666667
601235512696.6666666667-341.666666666668


Goldfeld-Quandt test for Heteroskedasticity
p-valuesAlternative Hypothesis
breakpoint indexgreater2-sidedless
160.2634115503898860.5268231007797720.736588449610114
170.1678247414129130.3356494828258260.832175258587087
180.1103979361792230.2207958723584460.889602063820777
190.08159705496262530.1631941099252510.918402945037375
200.1375248492216640.2750496984433270.862475150778336
210.2308545731336650.461709146267330.769145426866335
220.3005935095089980.6011870190179950.699406490491002
230.2337230959164150.467446191832830.766276904083585
240.2816430162874250.5632860325748490.718356983712575
250.2133261848011590.4266523696023170.786673815198841
260.1627276705374810.3254553410749630.837272329462519
270.3138928676545230.6277857353090470.686107132345477
280.2910885395319030.5821770790638050.708911460468097
290.3575269172268460.7150538344536920.642473082773154
300.4599472107984340.9198944215968680.540052789201566
310.4395073948504570.8790147897009140.560492605149543
320.380507423374450.76101484674890.61949257662555
330.4606276569758270.9212553139516540.539372343024173
340.4112833739824350.8225667479648710.588716626017564
350.3594894903501020.7189789807002040.640510509649898
360.4586705403557780.9173410807115560.541329459644222
370.3872220196871910.7744440393743820.612777980312809
380.35415973020810.70831946041620.6458402697919
390.3837241659823670.7674483319647330.616275834017633
400.4453177134529230.8906354269058450.554682286547078
410.959827811114770.08034437777045970.0401721888852298
420.968486795054430.0630264098911390.0315132049455695
430.9972780674585470.005443865082906060.00272193254145303
440.9862579283104560.02748414337908850.0137420716895443

\begin{tabular}{lllllllll}
\hline
Goldfeld-Quandt test for Heteroskedasticity \tabularnewline
p-values & Alternative Hypothesis \tabularnewline
breakpoint index & greater & 2-sided & less \tabularnewline
16 & 0.263411550389886 & 0.526823100779772 & 0.736588449610114 \tabularnewline
17 & 0.167824741412913 & 0.335649482825826 & 0.832175258587087 \tabularnewline
18 & 0.110397936179223 & 0.220795872358446 & 0.889602063820777 \tabularnewline
19 & 0.0815970549626253 & 0.163194109925251 & 0.918402945037375 \tabularnewline
20 & 0.137524849221664 & 0.275049698443327 & 0.862475150778336 \tabularnewline
21 & 0.230854573133665 & 0.46170914626733 & 0.769145426866335 \tabularnewline
22 & 0.300593509508998 & 0.601187019017995 & 0.699406490491002 \tabularnewline
23 & 0.233723095916415 & 0.46744619183283 & 0.766276904083585 \tabularnewline
24 & 0.281643016287425 & 0.563286032574849 & 0.718356983712575 \tabularnewline
25 & 0.213326184801159 & 0.426652369602317 & 0.786673815198841 \tabularnewline
26 & 0.162727670537481 & 0.325455341074963 & 0.837272329462519 \tabularnewline
27 & 0.313892867654523 & 0.627785735309047 & 0.686107132345477 \tabularnewline
28 & 0.291088539531903 & 0.582177079063805 & 0.708911460468097 \tabularnewline
29 & 0.357526917226846 & 0.715053834453692 & 0.642473082773154 \tabularnewline
30 & 0.459947210798434 & 0.919894421596868 & 0.540052789201566 \tabularnewline
31 & 0.439507394850457 & 0.879014789700914 & 0.560492605149543 \tabularnewline
32 & 0.38050742337445 & 0.7610148467489 & 0.61949257662555 \tabularnewline
33 & 0.460627656975827 & 0.921255313951654 & 0.539372343024173 \tabularnewline
34 & 0.411283373982435 & 0.822566747964871 & 0.588716626017564 \tabularnewline
35 & 0.359489490350102 & 0.718978980700204 & 0.640510509649898 \tabularnewline
36 & 0.458670540355778 & 0.917341080711556 & 0.541329459644222 \tabularnewline
37 & 0.387222019687191 & 0.774444039374382 & 0.612777980312809 \tabularnewline
38 & 0.3541597302081 & 0.7083194604162 & 0.6458402697919 \tabularnewline
39 & 0.383724165982367 & 0.767448331964733 & 0.616275834017633 \tabularnewline
40 & 0.445317713452923 & 0.890635426905845 & 0.554682286547078 \tabularnewline
41 & 0.95982781111477 & 0.0803443777704597 & 0.0401721888852298 \tabularnewline
42 & 0.96848679505443 & 0.063026409891139 & 0.0315132049455695 \tabularnewline
43 & 0.997278067458547 & 0.00544386508290606 & 0.00272193254145303 \tabularnewline
44 & 0.986257928310456 & 0.0274841433790885 & 0.0137420716895443 \tabularnewline
\hline
\end{tabular}
%Source: https://freestatistics.org/blog/index.php?pk=101786&T=5

[TABLE]
[ROW][C]Goldfeld-Quandt test for Heteroskedasticity[/C][/ROW]
[ROW][C]p-values[/C][C]Alternative Hypothesis[/C][/ROW]
[ROW][C]breakpoint index[/C][C]greater[/C][C]2-sided[/C][C]less[/C][/ROW]
[ROW][C]16[/C][C]0.263411550389886[/C][C]0.526823100779772[/C][C]0.736588449610114[/C][/ROW]
[ROW][C]17[/C][C]0.167824741412913[/C][C]0.335649482825826[/C][C]0.832175258587087[/C][/ROW]
[ROW][C]18[/C][C]0.110397936179223[/C][C]0.220795872358446[/C][C]0.889602063820777[/C][/ROW]
[ROW][C]19[/C][C]0.0815970549626253[/C][C]0.163194109925251[/C][C]0.918402945037375[/C][/ROW]
[ROW][C]20[/C][C]0.137524849221664[/C][C]0.275049698443327[/C][C]0.862475150778336[/C][/ROW]
[ROW][C]21[/C][C]0.230854573133665[/C][C]0.46170914626733[/C][C]0.769145426866335[/C][/ROW]
[ROW][C]22[/C][C]0.300593509508998[/C][C]0.601187019017995[/C][C]0.699406490491002[/C][/ROW]
[ROW][C]23[/C][C]0.233723095916415[/C][C]0.46744619183283[/C][C]0.766276904083585[/C][/ROW]
[ROW][C]24[/C][C]0.281643016287425[/C][C]0.563286032574849[/C][C]0.718356983712575[/C][/ROW]
[ROW][C]25[/C][C]0.213326184801159[/C][C]0.426652369602317[/C][C]0.786673815198841[/C][/ROW]
[ROW][C]26[/C][C]0.162727670537481[/C][C]0.325455341074963[/C][C]0.837272329462519[/C][/ROW]
[ROW][C]27[/C][C]0.313892867654523[/C][C]0.627785735309047[/C][C]0.686107132345477[/C][/ROW]
[ROW][C]28[/C][C]0.291088539531903[/C][C]0.582177079063805[/C][C]0.708911460468097[/C][/ROW]
[ROW][C]29[/C][C]0.357526917226846[/C][C]0.715053834453692[/C][C]0.642473082773154[/C][/ROW]
[ROW][C]30[/C][C]0.459947210798434[/C][C]0.919894421596868[/C][C]0.540052789201566[/C][/ROW]
[ROW][C]31[/C][C]0.439507394850457[/C][C]0.879014789700914[/C][C]0.560492605149543[/C][/ROW]
[ROW][C]32[/C][C]0.38050742337445[/C][C]0.7610148467489[/C][C]0.61949257662555[/C][/ROW]
[ROW][C]33[/C][C]0.460627656975827[/C][C]0.921255313951654[/C][C]0.539372343024173[/C][/ROW]
[ROW][C]34[/C][C]0.411283373982435[/C][C]0.822566747964871[/C][C]0.588716626017564[/C][/ROW]
[ROW][C]35[/C][C]0.359489490350102[/C][C]0.718978980700204[/C][C]0.640510509649898[/C][/ROW]
[ROW][C]36[/C][C]0.458670540355778[/C][C]0.917341080711556[/C][C]0.541329459644222[/C][/ROW]
[ROW][C]37[/C][C]0.387222019687191[/C][C]0.774444039374382[/C][C]0.612777980312809[/C][/ROW]
[ROW][C]38[/C][C]0.3541597302081[/C][C]0.7083194604162[/C][C]0.6458402697919[/C][/ROW]
[ROW][C]39[/C][C]0.383724165982367[/C][C]0.767448331964733[/C][C]0.616275834017633[/C][/ROW]
[ROW][C]40[/C][C]0.445317713452923[/C][C]0.890635426905845[/C][C]0.554682286547078[/C][/ROW]
[ROW][C]41[/C][C]0.95982781111477[/C][C]0.0803443777704597[/C][C]0.0401721888852298[/C][/ROW]
[ROW][C]42[/C][C]0.96848679505443[/C][C]0.063026409891139[/C][C]0.0315132049455695[/C][/ROW]
[ROW][C]43[/C][C]0.997278067458547[/C][C]0.00544386508290606[/C][C]0.00272193254145303[/C][/ROW]
[ROW][C]44[/C][C]0.986257928310456[/C][C]0.0274841433790885[/C][C]0.0137420716895443[/C][/ROW]
[/TABLE]
Source: https://freestatistics.org/blog/index.php?pk=101786&T=5

Globally Unique Identifier (entire table): ba.freestatistics.org/blog/index.php?pk=101786&T=5

As an alternative you can also use a QR Code:  

The GUIDs for individual cells are displayed in the table below:

Goldfeld-Quandt test for Heteroskedasticity
p-valuesAlternative Hypothesis
breakpoint indexgreater2-sidedless
160.2634115503898860.5268231007797720.736588449610114
170.1678247414129130.3356494828258260.832175258587087
180.1103979361792230.2207958723584460.889602063820777
190.08159705496262530.1631941099252510.918402945037375
200.1375248492216640.2750496984433270.862475150778336
210.2308545731336650.461709146267330.769145426866335
220.3005935095089980.6011870190179950.699406490491002
230.2337230959164150.467446191832830.766276904083585
240.2816430162874250.5632860325748490.718356983712575
250.2133261848011590.4266523696023170.786673815198841
260.1627276705374810.3254553410749630.837272329462519
270.3138928676545230.6277857353090470.686107132345477
280.2910885395319030.5821770790638050.708911460468097
290.3575269172268460.7150538344536920.642473082773154
300.4599472107984340.9198944215968680.540052789201566
310.4395073948504570.8790147897009140.560492605149543
320.380507423374450.76101484674890.61949257662555
330.4606276569758270.9212553139516540.539372343024173
340.4112833739824350.8225667479648710.588716626017564
350.3594894903501020.7189789807002040.640510509649898
360.4586705403557780.9173410807115560.541329459644222
370.3872220196871910.7744440393743820.612777980312809
380.35415973020810.70831946041620.6458402697919
390.3837241659823670.7674483319647330.616275834017633
400.4453177134529230.8906354269058450.554682286547078
410.959827811114770.08034437777045970.0401721888852298
420.968486795054430.0630264098911390.0315132049455695
430.9972780674585470.005443865082906060.00272193254145303
440.9862579283104560.02748414337908850.0137420716895443


Meta Analysis of Goldfeld-Quandt test for Heteroskedasticity
Description# significant tests% significant testsOK/NOK
1% type I error level10.0344827586206897NOK
5% type I error level20.0689655172413793NOK
10% type I error level40.137931034482759NOK

\begin{tabular}{lllllllll}
\hline
Meta Analysis of Goldfeld-Quandt test for Heteroskedasticity \tabularnewline
Description & # significant tests & % significant tests & OK/NOK \tabularnewline
1% type I error level & 1 & 0.0344827586206897 & NOK \tabularnewline
5% type I error level & 2 & 0.0689655172413793 & NOK \tabularnewline
10% type I error level & 4 & 0.137931034482759 & NOK \tabularnewline
\hline
\end{tabular}
%Source: https://freestatistics.org/blog/index.php?pk=101786&T=6

[TABLE]
[ROW][C]Meta Analysis of Goldfeld-Quandt test for Heteroskedasticity[/C][/ROW]
[ROW][C]Description[/C][C]# significant tests[/C][C]% significant tests[/C][C]OK/NOK[/C][/ROW]
[ROW][C]1% type I error level[/C][C]1[/C][C]0.0344827586206897[/C][C]NOK[/C][/ROW]
[ROW][C]5% type I error level[/C][C]2[/C][C]0.0689655172413793[/C][C]NOK[/C][/ROW]
[ROW][C]10% type I error level[/C][C]4[/C][C]0.137931034482759[/C][C]NOK[/C][/ROW]
[/TABLE]
Source: https://freestatistics.org/blog/index.php?pk=101786&T=6

Globally Unique Identifier (entire table): ba.freestatistics.org/blog/index.php?pk=101786&T=6

As an alternative you can also use a QR Code:  

The GUIDs for individual cells are displayed in the table below:

Meta Analysis of Goldfeld-Quandt test for Heteroskedasticity
Description# significant tests% significant testsOK/NOK
1% type I error level10.0344827586206897NOK
5% type I error level20.0689655172413793NOK
10% type I error level40.137931034482759NOK


Parameters (Session):
par1 = 1 ; par2 = Include Monthly Dummies ; par3 = Linear Trend ;
Parameters (R input):
par1 = 1 ; par2 = Include Monthly Dummies ; par3 = Linear Trend ;
R code (references can be found in the software module):
library(lattice)
library(lmtest)
n25 <- 25 #minimum number of obs. for Goldfeld-Quandt test
par1 <- as.numeric(par1)
x <- t(y)
k <- length(x[1,])
n <- length(x[,1])
x1 <- cbind(x[,par1], x[,1:k!=par1])
mycolnames <- c(colnames(x)[par1], colnames(x)[1:k!=par1])
colnames(x1) <- mycolnames #colnames(x)[par1]
x <- x1
if (par3 == 'First Differences'){
x2 <- array(0, dim=c(n-1,k), dimnames=list(1:(n-1), paste('(1-B)',colnames(x),sep='')))
for (i in 1:n-1) {
for (j in 1:k) {
x2[i,j] <- x[i+1,j] - x[i,j]
}
}
x <- x2
}
if (par2 == 'Include Monthly Dummies'){
x2 <- array(0, dim=c(n,11), dimnames=list(1:n, paste('M', seq(1:11), sep ='')))
for (i in 1:11){
x2[seq(i,n,12),i] <- 1
}
x <- cbind(x, x2)
}
if (par2 == 'Include Quarterly Dummies'){
x2 <- array(0, dim=c(n,3), dimnames=list(1:n, paste('Q', seq(1:3), sep ='')))
for (i in 1:3){
x2[seq(i,n,4),i] <- 1
}
x <- cbind(x, x2)
}
k <- length(x[1,])
if (par3 == 'Linear Trend'){
x <- cbind(x, c(1:n))
colnames(x)[k+1] <- 't'
}
x
k <- length(x[1,])
df <- as.data.frame(x)
(mylm <- lm(df))
(mysum <- summary(mylm))
if (n > n25) {
kp3 <- k + 3
nmkm3 <- n - k - 3
gqarr <- array(NA, dim=c(nmkm3-kp3+1,3))
numgqtests <- 0
numsignificant1 <- 0
numsignificant5 <- 0
numsignificant10 <- 0
for (mypoint in kp3:nmkm3) {
j <- 0
numgqtests <- numgqtests + 1
for (myalt in c('greater', 'two.sided', 'less')) {
j <- j + 1
gqarr[mypoint-kp3+1,j] <- gqtest(mylm, point=mypoint, alternative=myalt)$p.value
}
if (gqarr[mypoint-kp3+1,2] < 0.01) numsignificant1 <- numsignificant1 + 1
if (gqarr[mypoint-kp3+1,2] < 0.05) numsignificant5 <- numsignificant5 + 1
if (gqarr[mypoint-kp3+1,2] < 0.10) numsignificant10 <- numsignificant10 + 1
}
gqarr
}
bitmap(file='test0.png')
plot(x[,1], type='l', main='Actuals and Interpolation', ylab='value of Actuals and Interpolation (dots)', xlab='time or index')
points(x[,1]-mysum$resid)
grid()
dev.off()
bitmap(file='test1.png')
plot(mysum$resid, type='b', pch=19, main='Residuals', ylab='value of Residuals', xlab='time or index')
grid()
dev.off()
bitmap(file='test2.png')
hist(mysum$resid, main='Residual Histogram', xlab='values of Residuals')
grid()
dev.off()
bitmap(file='test3.png')
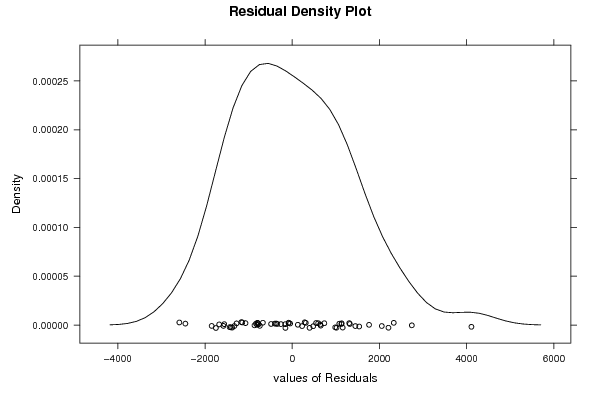
densityplot(~mysum$resid,col='black',main='Residual Density Plot', xlab='values of Residuals')
dev.off()
bitmap(file='test4.png')
qqnorm(mysum$resid, main='Residual Normal Q-Q Plot')
qqline(mysum$resid)
grid()
dev.off()
(myerror <- as.ts(mysum$resid))
bitmap(file='test5.png')
dum <- cbind(lag(myerror,k=1),myerror)
dum
dum1 <- dum[2:length(myerror),]
dum1
z <- as.data.frame(dum1)
z
plot(z,main=paste('Residual Lag plot, lowess, and regression line'), ylab='values of Residuals', xlab='lagged values of Residuals')
lines(lowess(z))
abline(lm(z))
grid()
dev.off()
bitmap(file='test6.png')
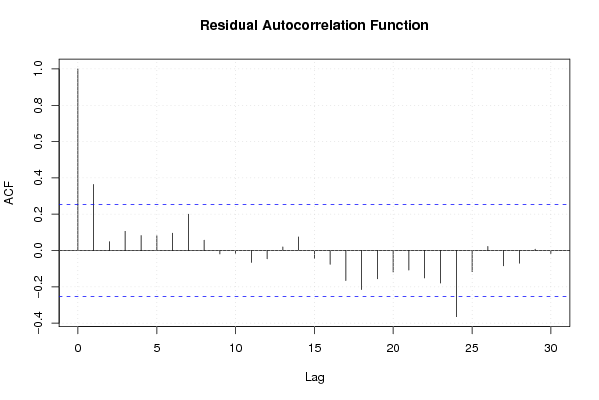
acf(mysum$resid, lag.max=length(mysum$resid)/2, main='Residual Autocorrelation Function')
grid()
dev.off()
bitmap(file='test7.png')
pacf(mysum$resid, lag.max=length(mysum$resid)/2, main='Residual Partial Autocorrelation Function')
grid()
dev.off()
bitmap(file='test8.png')
opar <- par(mfrow = c(2,2), oma = c(0, 0, 1.1, 0))
plot(mylm, las = 1, sub='Residual Diagnostics')
par(opar)
dev.off()
if (n > n25) {
bitmap(file='test9.png')
plot(kp3:nmkm3,gqarr[,2], main='Goldfeld-Quandt test',ylab='2-sided p-value',xlab='breakpoint')
grid()
dev.off()
}
load(file='createtable')
a<-table.start()
a<-table.row.start(a)
a<-table.element(a, 'Multiple Linear Regression - Estimated Regression Equation', 1, TRUE)
a<-table.row.end(a)
myeq <- colnames(x)[1]
myeq <- paste(myeq, '[t] = ', sep='')
for (i in 1:k){
if (mysum$coefficients[i,1] > 0) myeq <- paste(myeq, '+', '')
myeq <- paste(myeq, mysum$coefficients[i,1], sep=' ')
if (rownames(mysum$coefficients)[i] != '(Intercept)') {
myeq <- paste(myeq, rownames(mysum$coefficients)[i], sep='')
if (rownames(mysum$coefficients)[i] != 't') myeq <- paste(myeq, '[t]', sep='')
}
}
myeq <- paste(myeq, ' + e[t]')
a<-table.row.start(a)
a<-table.element(a, myeq)
a<-table.row.end(a)
a<-table.end(a)
table.save(a,file='mytable1.tab')
a<-table.start()
a<-table.row.start(a)
a<-table.element(a,hyperlink('ols1.htm','Multiple Linear Regression - Ordinary Least Squares',''), 6, TRUE)
a<-table.row.end(a)
a<-table.row.start(a)
a<-table.element(a,'Variable',header=TRUE)
a<-table.element(a,'Parameter',header=TRUE)
a<-table.element(a,'S.D.',header=TRUE)
a<-table.element(a,'T-STAT
H0: parameter = 0',header=TRUE)
a<-table.element(a,'2-tail p-value',header=TRUE)
a<-table.element(a,'1-tail p-value',header=TRUE)
a<-table.row.end(a)
for (i in 1:k){
a<-table.row.start(a)
a<-table.element(a,rownames(mysum$coefficients)[i],header=TRUE)
a<-table.element(a,mysum$coefficients[i,1])
a<-table.element(a, round(mysum$coefficients[i,2],6))
a<-table.element(a, round(mysum$coefficients[i,3],4))
a<-table.element(a, round(mysum$coefficients[i,4],6))
a<-table.element(a, round(mysum$coefficients[i,4]/2,6))
a<-table.row.end(a)
}
a<-table.end(a)
table.save(a,file='mytable2.tab')
a<-table.start()
a<-table.row.start(a)
a<-table.element(a, 'Multiple Linear Regression - Regression Statistics', 2, TRUE)
a<-table.row.end(a)
a<-table.row.start(a)
a<-table.element(a, 'Multiple R',1,TRUE)
a<-table.element(a, sqrt(mysum$r.squared))
a<-table.row.end(a)
a<-table.row.start(a)
a<-table.element(a, 'R-squared',1,TRUE)
a<-table.element(a, mysum$r.squared)
a<-table.row.end(a)
a<-table.row.start(a)
a<-table.element(a, 'Adjusted R-squared',1,TRUE)
a<-table.element(a, mysum$adj.r.squared)
a<-table.row.end(a)
a<-table.row.start(a)
a<-table.element(a, 'F-TEST (value)',1,TRUE)
a<-table.element(a, mysum$fstatistic[1])
a<-table.row.end(a)
a<-table.row.start(a)
a<-table.element(a, 'F-TEST (DF numerator)',1,TRUE)
a<-table.element(a, mysum$fstatistic[2])
a<-table.row.end(a)
a<-table.row.start(a)
a<-table.element(a, 'F-TEST (DF denominator)',1,TRUE)
a<-table.element(a, mysum$fstatistic[3])
a<-table.row.end(a)
a<-table.row.start(a)
a<-table.element(a, 'p-value',1,TRUE)
a<-table.element(a, 1-pf(mysum$fstatistic[1],mysum$fstatistic[2],mysum$fstatistic[3]))
a<-table.row.end(a)
a<-table.row.start(a)
a<-table.element(a, 'Multiple Linear Regression - Residual Statistics', 2, TRUE)
a<-table.row.end(a)
a<-table.row.start(a)
a<-table.element(a, 'Residual Standard Deviation',1,TRUE)
a<-table.element(a, mysum$sigma)
a<-table.row.end(a)
a<-table.row.start(a)
a<-table.element(a, 'Sum Squared Residuals',1,TRUE)
a<-table.element(a, sum(myerror*myerror))
a<-table.row.end(a)
a<-table.end(a)
table.save(a,file='mytable3.tab')
a<-table.start()
a<-table.row.start(a)
a<-table.element(a, 'Multiple Linear Regression - Actuals, Interpolation, and Residuals', 4, TRUE)
a<-table.row.end(a)
a<-table.row.start(a)
a<-table.element(a, 'Time or Index', 1, TRUE)
a<-table.element(a, 'Actuals', 1, TRUE)
a<-table.element(a, 'Interpolation
Forecast', 1, TRUE)
a<-table.element(a, 'Residuals
Prediction Error', 1, TRUE)
a<-table.row.end(a)
for (i in 1:n) {
a<-table.row.start(a)
a<-table.element(a,i, 1, TRUE)
a<-table.element(a,x[i])
a<-table.element(a,x[i]-mysum$resid[i])
a<-table.element(a,mysum$resid[i])
a<-table.row.end(a)
}
a<-table.end(a)
table.save(a,file='mytable4.tab')
if (n > n25) {
a<-table.start()
a<-table.row.start(a)
a<-table.element(a,'Goldfeld-Quandt test for Heteroskedasticity',4,TRUE)
a<-table.row.end(a)
a<-table.row.start(a)
a<-table.element(a,'p-values',header=TRUE)
a<-table.element(a,'Alternative Hypothesis',3,header=TRUE)
a<-table.row.end(a)
a<-table.row.start(a)
a<-table.element(a,'breakpoint index',header=TRUE)
a<-table.element(a,'greater',header=TRUE)
a<-table.element(a,'2-sided',header=TRUE)
a<-table.element(a,'less',header=TRUE)
a<-table.row.end(a)
for (mypoint in kp3:nmkm3) {
a<-table.row.start(a)
a<-table.element(a,mypoint,header=TRUE)
a<-table.element(a,gqarr[mypoint-kp3+1,1])
a<-table.element(a,gqarr[mypoint-kp3+1,2])
a<-table.element(a,gqarr[mypoint-kp3+1,3])
a<-table.row.end(a)
}
a<-table.end(a)
table.save(a,file='mytable5.tab')
a<-table.start()
a<-table.row.start(a)
a<-table.element(a,'Meta Analysis of Goldfeld-Quandt test for Heteroskedasticity',4,TRUE)
a<-table.row.end(a)
a<-table.row.start(a)
a<-table.element(a,'Description',header=TRUE)
a<-table.element(a,'# significant tests',header=TRUE)
a<-table.element(a,'% significant tests',header=TRUE)
a<-table.element(a,'OK/NOK',header=TRUE)
a<-table.row.end(a)
a<-table.row.start(a)
a<-table.element(a,'1% type I error level',header=TRUE)
a<-table.element(a,numsignificant1)
a<-table.element(a,numsignificant1/numgqtests)
if (numsignificant1/numgqtests < 0.01) dum <- 'OK' else dum <- 'NOK'
a<-table.element(a,dum)
a<-table.row.end(a)
a<-table.row.start(a)
a<-table.element(a,'5% type I error level',header=TRUE)
a<-table.element(a,numsignificant5)
a<-table.element(a,numsignificant5/numgqtests)
if (numsignificant5/numgqtests < 0.05) dum <- 'OK' else dum <- 'NOK'
a<-table.element(a,dum)
a<-table.row.end(a)
a<-table.row.start(a)
a<-table.element(a,'10% type I error level',header=TRUE)
a<-table.element(a,numsignificant10)
a<-table.element(a,numsignificant10/numgqtests)
if (numsignificant10/numgqtests < 0.1) dum <- 'OK' else dum <- 'NOK'
a<-table.element(a,dum)
a<-table.row.end(a)
a<-table.end(a)
table.save(a,file='mytable6.tab')
}