| Multiple Linear Regression - Estimated Regression Equation |
| uitvoer[t] = + 3664.99536024364 + 0.758111799349518invoer[t] -755.194173669824crisis[t] + 21.571095959747M1[t] + 712.153992678052M2[t] + 1108.98645761485M3[t] + 658.062497580011M4[t] + 943.435882803938M5[t] + 1543.21131640386M6[t] + 1336.55397969347M7[t] -396.939668264646M8[t] + 1307.00770491500M9[t] + 1409.14358383855M10[t] + 881.69742401456M11[t] -9.70329327631563t + e[t] |
| Multiple Linear Regression - Ordinary Least Squares | |||||
| Variable | Parameter | S.D. | T-STAT H0: parameter = 0 | 2-tail p-value | 1-tail p-value |
| (Intercept) | 3664.99536024364 | 797.543088 | 4.5954 | 4.3e-05 | 2.1e-05 |
| invoer | 0.758111799349518 | 0.043388 | 17.4727 | 0 | 0 |
| crisis | -755.194173669824 | 204.573962 | -3.6915 | 0.000665 | 0.000332 |
| M1 | 21.571095959747 | 284.60683 | 0.0758 | 0.939962 | 0.469981 |
| M2 | 712.153992678052 | 287.242631 | 2.4793 | 0.017478 | 0.008739 |
| M3 | 1108.98645761485 | 288.252772 | 3.8473 | 0.00042 | 0.00021 |
| M4 | 658.062497580011 | 284.806008 | 2.3106 | 0.026096 | 0.013048 |
| M5 | 943.435882803938 | 285.08977 | 3.3093 | 0.001987 | 0.000993 |
| M6 | 1543.21131640386 | 287.199816 | 5.3733 | 4e-06 | 2e-06 |
| M7 | 1336.55397969347 | 287.302675 | 4.6521 | 3.6e-05 | 1.8e-05 |
| M8 | -396.939668264646 | 304.79381 | -1.3023 | 0.200255 | 0.100128 |
| M9 | 1307.00770491500 | 300.051546 | 4.3559 | 9e-05 | 4.5e-05 |
| M10 | 1409.14358383855 | 310.613321 | 4.5366 | 5.1e-05 | 2.6e-05 |
| M11 | 881.69742401456 | 299.413557 | 2.9447 | 0.005363 | 0.002682 |
| t | -9.70329327631563 | 4.310699 | -2.251 | 0.029951 | 0.014976 |
| Multiple Linear Regression - Regression Statistics | |
| Multiple R | 0.983895994867435 |
| R-squared | 0.96805132871618 |
| Adjusted R-squared | 0.956869293766844 |
| F-TEST (value) | 86.5720178037536 |
| F-TEST (DF numerator) | 14 |
| F-TEST (DF denominator) | 40 |
| p-value | 0 |
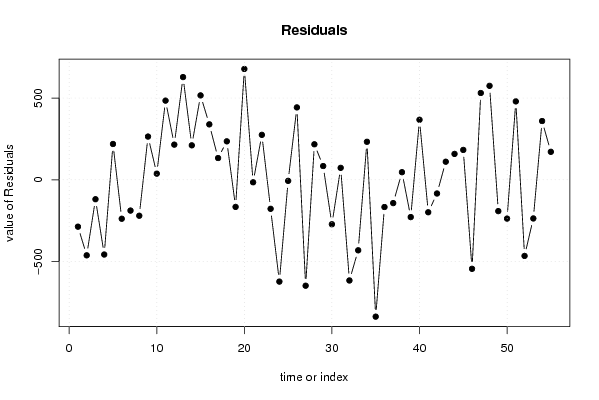
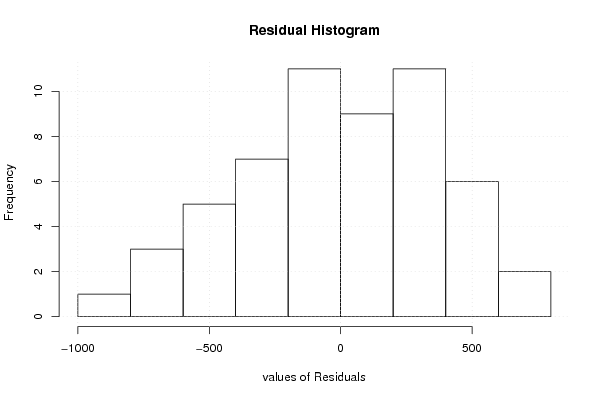
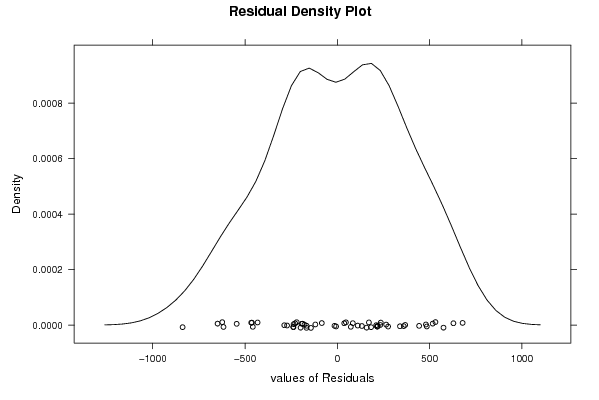
| Multiple Linear Regression - Residual Statistics | |
| Residual Standard Deviation | 419.317970863194 |
| Sum Squared Residuals | 7033102.42755304 |
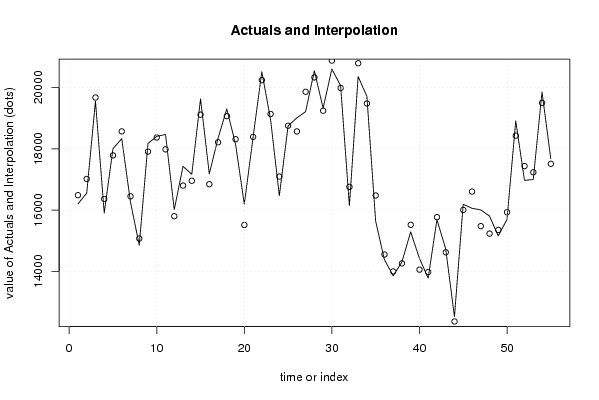
| Multiple Linear Regression - Actuals, Interpolation, and Residuals | |||
| Time or Index | Actuals | Interpolation Forecast | Residuals Prediction Error |
| 1 | 16198.9 | 16486.0717470964 | -287.171747096369 |
| 2 | 16554.2 | 17016.6935919073 | -462.493591907311 |
| 3 | 19554.2 | 19673.3062461005 | -119.106246100507 |
| 4 | 15903.8 | 16361.4963266158 | -457.696326615751 |
| 5 | 18003.8 | 17784.8718715986 | 218.928128401404 |
| 6 | 18329.6 | 18568.1108983965 | -238.510898396461 |
| 7 | 16260.7 | 16449.1928967622 | -188.492896762196 |
| 8 | 14851.9 | 15072.0881434337 | -220.188143433656 |
| 9 | 18174.1 | 17909.640627936 | 264.459372064009 |
| 10 | 18406.6 | 18369.0751356483 | 37.5248643516672 |
| 11 | 18466.5 | 17982.0318188192 | 484.468181180772 |
| 12 | 16016.5 | 15801.3861755546 | 215.113824445439 |
| 13 | 17428.5 | 16799.7848627315 | 628.715137268483 |
| 14 | 17167.2 | 16956.4301569233 | 210.769843076684 |
| 15 | 19630 | 19113.5987577051 | 516.401242294943 |
| 16 | 17183.6 | 16844.4199958657 | 339.180004134308 |
| 17 | 18344.7 | 18211.7710788766 | 132.928921123393 |
| 18 | 19301.4 | 19066.1209924535 | 235.279007546545 |
| 19 | 18147.5 | 18313.6236979668 | -166.123697966767 |
| 20 | 16192.9 | 15514.5286425983 | 678.371357401667 |
| 21 | 18374.4 | 18389.7592835283 | -15.3592835283374 |
| 22 | 20515.2 | 20240.1773206872 | 275.02267931283 |
| 23 | 18957.2 | 19134.9746963343 | -177.774696334272 |
| 24 | 16471.5 | 17094.7313583091 | -623.23135830914 |
| 25 | 18746.8 | 18753.5212338995 | -6.72123389946195 |
| 26 | 19009.5 | 18566.5902606261 | 442.909739373944 |
| 27 | 19211.2 | 19859.7388436892 | -648.53884368915 |
| 28 | 20547.7 | 20330.5277470588 | 217.172252941189 |
| 29 | 19325.8 | 19241.8240337171 | 83.9759662829041 |
| 30 | 20605.5 | 20877.7872124233 | -272.287212423297 |
| 31 | 20056.9 | 19983.9020673579 | 72.997932642079 |
| 32 | 16141.4 | 16757.9142577758 | -616.514257775773 |
| 33 | 20359.8 | 20791.6155392918 | -431.81553929178 |
| 34 | 19711.6 | 19479.0005168668 | 232.599483133215 |
| 35 | 15638.6 | 16476.5473034618 | -837.947303461783 |
| 36 | 14384.5 | 14551.3853365779 | -166.885336577903 |
| 37 | 13855.6 | 13998.4598487459 | -142.859848745944 |
| 38 | 14308.3 | 14261.8472842862 | 46.4527157138452 |
| 39 | 15290.6 | 15519.0613680601 | -228.461368060079 |
| 40 | 14423.8 | 14056.2861271888 | 367.513872811203 |
| 41 | 13779.7 | 13978.7519318195 | -199.051931819466 |
| 42 | 15686.3 | 15770.3554629321 | -84.0554629321238 |
| 43 | 14733.8 | 14623.260976884 | 110.539023115989 |
| 44 | 12522.5 | 12364.1689561922 | 158.331043807762 |
| 45 | 16189.4 | 16006.6845492439 | 182.715450756109 |
| 46 | 16059.1 | 16604.2470267977 | -545.147026797712 |
| 47 | 16007.1 | 15475.8461813847 | 531.253818615283 |
| 48 | 15806.8 | 15231.7971295584 | 575.002870441604 |
| 49 | 15160 | 15351.9623075267 | -191.962307526707 |
| 50 | 15692.1 | 15929.7387062572 | -237.638706257161 |
| 51 | 18908.9 | 18429.1947844452 | 479.705215554793 |
| 52 | 16969.9 | 17436.0698032710 | -466.169803270949 |
| 53 | 16997.5 | 17234.2810839882 | -236.781083988235 |
| 54 | 19858.9 | 19499.3254337947 | 359.574566205337 |
| 55 | 17681.2 | 17510.1203610291 | 171.079638970895 |
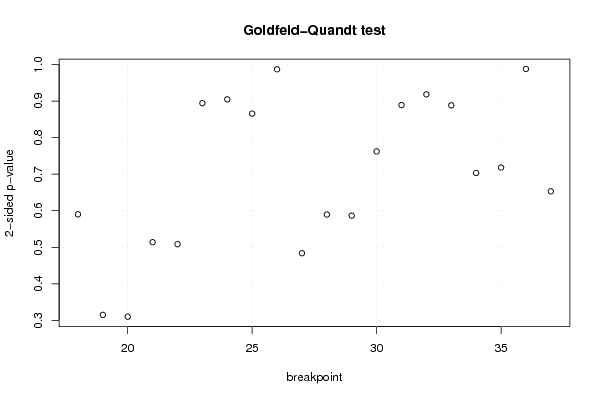
| Goldfeld-Quandt test for Heteroskedasticity | |||
| p-values | Alternative Hypothesis | ||
| breakpoint index | greater | 2-sided | less |
| 18 | 0.295082536029611 | 0.590165072059222 | 0.704917463970389 |
| 19 | 0.157557984069701 | 0.315115968139402 | 0.8424420159303 |
| 20 | 0.155081102443639 | 0.310162204887278 | 0.844918897556361 |
| 21 | 0.256960791574252 | 0.513921583148504 | 0.743039208425748 |
| 22 | 0.254223546898214 | 0.508447093796427 | 0.745776453101786 |
| 23 | 0.447228224732795 | 0.89445644946559 | 0.552771775267205 |
| 24 | 0.547566420102006 | 0.904867159795989 | 0.452433579897994 |
| 25 | 0.432920223010384 | 0.865840446020769 | 0.567079776989616 |
| 26 | 0.50647254150704 | 0.98705491698592 | 0.49352745849296 |
| 27 | 0.758145005951736 | 0.483709988096527 | 0.241854994048264 |
| 28 | 0.705164731732357 | 0.589670536535285 | 0.294835268267643 |
| 29 | 0.706696578313553 | 0.586606843372893 | 0.293303421686447 |
| 30 | 0.61884814777721 | 0.76230370444558 | 0.38115185222279 |
| 31 | 0.555410642595648 | 0.889178714808703 | 0.444589357404352 |
| 32 | 0.540763424406882 | 0.918473151186236 | 0.459236575593118 |
| 33 | 0.444200163565882 | 0.888400327131764 | 0.555799836434118 |
| 34 | 0.648289080717041 | 0.703421838565918 | 0.351710919282959 |
| 35 | 0.640960432398172 | 0.718079135203656 | 0.359039567601828 |
| 36 | 0.494015290538161 | 0.988030581076322 | 0.505984709461839 |
| 37 | 0.326574089116925 | 0.65314817823385 | 0.673425910883075 |
| Meta Analysis of Goldfeld-Quandt test for Heteroskedasticity | |||
| Description | # significant tests | % significant tests | OK/NOK |
| 1% type I error level | 0 | 0 | OK |
| 5% type I error level | 0 | 0 | OK |
| 10% type I error level | 0 | 0 | OK |