Free Statistics

of Irreproducible Research!

Author's title

Author*The author of this computation has been verified*
R Software Modulerwasp_multipleregression.wasp
Title produced by softwareMultiple Regression
Date of computationFri, 26 Nov 2010 09:37:04 +0000
Cite this page as followsStatistical Computations at FreeStatistics.org, Office for Research Development and Education, URL https://freestatistics.org/blog/index.php?v=date/2010/Nov/26/t1290764120j23m7itvv6845w8.htm/, Retrieved Sat, 04 May 2024 01:57:40 +0000
Statistical Computations at FreeStatistics.org, Office for Research Development and Education, URL https://freestatistics.org/blog/index.php?pk=101712, Retrieved Sat, 04 May 2024 01:57:40 +0000
QR Codes:

Original text written by user:
IsPrivate?No (this computation is public)
User-defined keywords
Estimated Impact147
Family? (F = Feedback message, R = changed R code, M = changed R Module, P = changed Parameters, D = changed Data)
-     [Multiple Regression] [Competence to learn] [2010-11-17 07:43:53] [b98453cac15ba1066b407e146608df68]
-   PD  [Multiple Regression] [Multiple Linear R...] [2010-11-20 08:26:22] [aeb27d5c05332f2e597ad139ee63fbe4]
-   PD    [Multiple Regression] [Multiple Linear R...] [2010-11-20 09:33:22] [aeb27d5c05332f2e597ad139ee63fbe4]
F   PD      [Multiple Regression] [] [2010-11-23 17:21:24] [cbb1f7583f1ea41fcafd5f9709bd0e0a]
-   P           [Multiple Regression] [Workshop 7 review] [2010-11-26 09:37:04] [c52f616cc59ab01e55ce1a10b5754887] [Current]
Feedback Forum

Post a new message
Dataseries X:
43071	990633
45552	1047696
36329	835567
37703	867169
50519	1161937
36798	846354
37056	852288
44927	1033321
37635	865605
62924	1447252
8170	187910
27438	631074
27429	630867
33666	774318
27733	637859
33228	764244
25699	591077
303936	6990528
30169	693887
35117	807691
34870	802010
56676	1303548
7054	162242
29722	683606
41629	957467
41117	945691
39341	904843
39486	908178
48138	1107174
45633	1049559
41756	960388
47221	1086083
50530	1162190
68184	1568232
8771	201733
37898	871654
41888	963424
40439	930097
40898	940654
38401	883223
52073	1197679
41547	955581
38529	886167
51321	1180383
41519	954937
69116	1589668
12657	291111
34801	800423
37967	873241
39401	906223
33425	768775
36222	833106
48428	1113844
40891	940493
36432	837936
50669	1165387
39556	909788
68906	1584838


Summary of computational transaction
Raw Inputview raw input (R code)
Raw Outputview raw output of R engine
Computing time6 seconds
R Server'RServer@AstonUniversity' @ vre.aston.ac.uk

\begin{tabular}{lllllllll}
\hline
Summary of computational transaction \tabularnewline
Raw Input & view raw input (R code)  \tabularnewline
Raw Output & view raw output of R engine  \tabularnewline
Computing time & 6 seconds \tabularnewline
R Server & 'RServer@AstonUniversity' @ vre.aston.ac.uk \tabularnewline
\hline
\end{tabular}
%Source: https://freestatistics.org/blog/index.php?pk=101712&T=0

[TABLE]
[ROW][C]Summary of computational transaction[/C][/ROW]
[ROW][C]Raw Input[/C][C]view raw input (R code) [/C][/ROW]
[ROW][C]Raw Output[/C][C]view raw output of R engine [/C][/ROW]
[ROW][C]Computing time[/C][C]6 seconds[/C][/ROW]
[ROW][C]R Server[/C][C]'RServer@AstonUniversity' @ vre.aston.ac.uk[/C][/ROW]
[/TABLE]
Source: https://freestatistics.org/blog/index.php?pk=101712&T=0

Globally Unique Identifier (entire table): ba.freestatistics.org/blog/index.php?pk=101712&T=0

As an alternative you can also use a QR Code:  

The GUIDs for individual cells are displayed in the table below:

Summary of computational transaction
Raw Inputview raw input (R code)
Raw Outputview raw output of R engine
Computing time6 seconds
R Server'RServer@AstonUniversity' @ vre.aston.ac.uk


Multiple Linear Regression - Estimated Regression Equation
Verkoopcijfers[t] = -2.16080094974641e-12 + 0.0434782608695652`Totaleuitstootkm/u`[t] + e[t]

\begin{tabular}{lllllllll}
\hline
Multiple Linear Regression - Estimated Regression Equation \tabularnewline
Verkoopcijfers[t] =  -2.16080094974641e-12 +  0.0434782608695652`Totaleuitstootkm/u`[t]  + e[t] \tabularnewline
\hline
\end{tabular}
%Source: https://freestatistics.org/blog/index.php?pk=101712&T=1

[TABLE]
[ROW][C]Multiple Linear Regression - Estimated Regression Equation[/C][/ROW]
[ROW][C]Verkoopcijfers[t] =  -2.16080094974641e-12 +  0.0434782608695652`Totaleuitstootkm/u`[t]  + e[t][/C][/ROW]
[/TABLE]
Source: https://freestatistics.org/blog/index.php?pk=101712&T=1

Globally Unique Identifier (entire table): ba.freestatistics.org/blog/index.php?pk=101712&T=1

As an alternative you can also use a QR Code:  

The GUIDs for individual cells are displayed in the table below:

Multiple Linear Regression - Estimated Regression Equation
Verkoopcijfers[t] = -2.16080094974641e-12 + 0.0434782608695652`Totaleuitstootkm/u`[t] + e[t]


Multiple Linear Regression - Ordinary Least Squares
VariableParameterS.D.T-STATH0: parameter = 02-tail p-value1-tail p-value
(Intercept)-2.16080094974641e-120-1.98930.0515560.025778
`Totaleuitstootkm/u`0.043478260869565205279036419448320800

\begin{tabular}{lllllllll}
\hline
Multiple Linear Regression - Ordinary Least Squares \tabularnewline
Variable & Parameter & S.D. & T-STATH0: parameter = 0 & 2-tail p-value & 1-tail p-value \tabularnewline
(Intercept) & -2.16080094974641e-12 & 0 & -1.9893 & 0.051556 & 0.025778 \tabularnewline
`Totaleuitstootkm/u` & 0.0434782608695652 & 0 & 52790364194483208 & 0 & 0 \tabularnewline
\hline
\end{tabular}
%Source: https://freestatistics.org/blog/index.php?pk=101712&T=2

[TABLE]
[ROW][C]Multiple Linear Regression - Ordinary Least Squares[/C][/ROW]
[ROW][C]Variable[/C][C]Parameter[/C][C]S.D.[/C][C]T-STATH0: parameter = 0[/C][C]2-tail p-value[/C][C]1-tail p-value[/C][/ROW]
[ROW][C](Intercept)[/C][C]-2.16080094974641e-12[/C][C]0[/C][C]-1.9893[/C][C]0.051556[/C][C]0.025778[/C][/ROW]
[ROW][C]`Totaleuitstootkm/u`[/C][C]0.0434782608695652[/C][C]0[/C][C]52790364194483208[/C][C]0[/C][C]0[/C][/ROW]
[/TABLE]
Source: https://freestatistics.org/blog/index.php?pk=101712&T=2

Globally Unique Identifier (entire table): ba.freestatistics.org/blog/index.php?pk=101712&T=2

As an alternative you can also use a QR Code:  

The GUIDs for individual cells are displayed in the table below:

Multiple Linear Regression - Ordinary Least Squares
VariableParameterS.D.T-STATH0: parameter = 02-tail p-value1-tail p-value
(Intercept)-2.16080094974641e-120-1.98930.0515560.025778
`Totaleuitstootkm/u`0.043478260869565205279036419448320800


Multiple Linear Regression - Regression Statistics
Multiple R1
R-squared1
Adjusted R-squared1
F-TEST (value)2.78682255178618e+33
F-TEST (DF numerator)1
F-TEST (DF denominator)56
p-value0
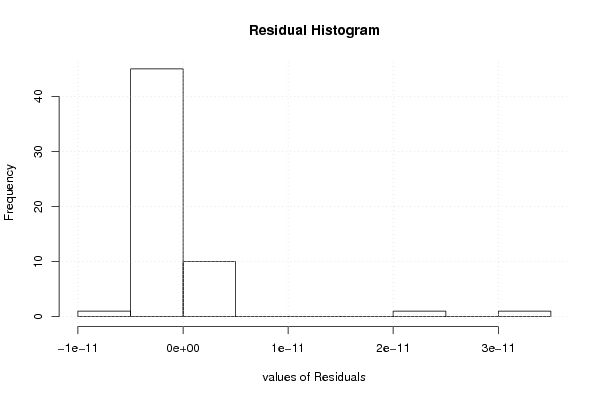
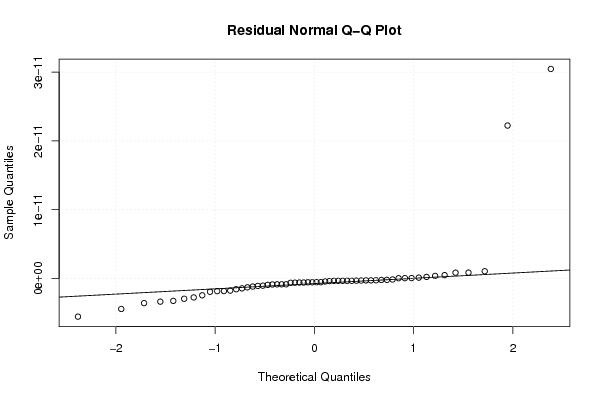
Multiple Linear Regression - Residual Statistics
Residual Standard Deviation5.28579786031869e-12
Sum Squared Residuals1.56462090512838e-21

\begin{tabular}{lllllllll}
\hline
Multiple Linear Regression - Regression Statistics \tabularnewline
Multiple R & 1 \tabularnewline
R-squared & 1 \tabularnewline
Adjusted R-squared & 1 \tabularnewline
F-TEST (value) & 2.78682255178618e+33 \tabularnewline
F-TEST (DF numerator) & 1 \tabularnewline
F-TEST (DF denominator) & 56 \tabularnewline
p-value & 0 \tabularnewline
Multiple Linear Regression - Residual Statistics \tabularnewline
Residual Standard Deviation & 5.28579786031869e-12 \tabularnewline
Sum Squared Residuals & 1.56462090512838e-21 \tabularnewline
\hline
\end{tabular}
%Source: https://freestatistics.org/blog/index.php?pk=101712&T=3

[TABLE]
[ROW][C]Multiple Linear Regression - Regression Statistics[/C][/ROW]
[ROW][C]Multiple R[/C][C]1[/C][/ROW]
[ROW][C]R-squared[/C][C]1[/C][/ROW]
[ROW][C]Adjusted R-squared[/C][C]1[/C][/ROW]
[ROW][C]F-TEST (value)[/C][C]2.78682255178618e+33[/C][/ROW]
[ROW][C]F-TEST (DF numerator)[/C][C]1[/C][/ROW]
[ROW][C]F-TEST (DF denominator)[/C][C]56[/C][/ROW]
[ROW][C]p-value[/C][C]0[/C][/ROW]
[ROW][C]Multiple Linear Regression - Residual Statistics[/C][/ROW]
[ROW][C]Residual Standard Deviation[/C][C]5.28579786031869e-12[/C][/ROW]
[ROW][C]Sum Squared Residuals[/C][C]1.56462090512838e-21[/C][/ROW]
[/TABLE]
Source: https://freestatistics.org/blog/index.php?pk=101712&T=3

Globally Unique Identifier (entire table): ba.freestatistics.org/blog/index.php?pk=101712&T=3

As an alternative you can also use a QR Code:  

The GUIDs for individual cells are displayed in the table below:

Multiple Linear Regression - Regression Statistics
Multiple R1
R-squared1
Adjusted R-squared1
F-TEST (value)2.78682255178618e+33
F-TEST (DF numerator)1
F-TEST (DF denominator)56
p-value0
Multiple Linear Regression - Residual Statistics
Residual Standard Deviation5.28579786031869e-12
Sum Squared Residuals1.56462090512838e-21


Multiple Linear Regression - Actuals, Interpolation, and Residuals
Time or IndexActualsInterpolationForecastResidualsPrediction Error
143071430712.2236603765632e-11
245552455523.04672082062726e-11
336329363294.26423361600248e-14
43770337703-2.13385244240005e-13
550519505194.86497751854067e-13
63679836798-3.00659056435213e-13
73705637056-5.38808164607463e-13
84492744927-3.45455282489792e-13
93763537635-5.55874485369407e-13
106292462924-3.58401426601991e-12
1181708170-3.35495697743738e-13
122743827438-4.43717423682596e-12
132742927429-3.25679135312986e-12
143366633666-1.43703305610115e-12
152773327733-2.7549572778756e-12
163322833228-8.52619085953262e-13
172569925699-3.37009792118209e-12
18303936303936-1.8404020615302e-12
193016930169-1.76324649894296e-12
2035117351173.74277331771232e-13
213487034870-6.13054784378416e-13
225667656676-5.41200710054708e-13
2370547054-1.2848435245694e-12
242972229722-1.93645495688464e-12
254162941629-2.60871677557611e-13
264111741117-8.459932444068e-13
273934139341-8.48630114417741e-13
283948639486-3.75031859962197e-13
294813848138-3.41651401952082e-13
304563345633-2.00131334769363e-13
314175641756-3.33293578783459e-13
324722147221-1.47454984751153e-13
3350530505302.28686915795456e-13
346818468184-2.95114455345813e-12
3587718771-1.83540998967634e-12
3637898378985.6460051058624e-14
374188841888-2.80651559699103e-13
384043940439-9.28915592800195e-13
394089840898-5.5356421472793e-13
403840138401-1.08371119844505e-12
4152073520738.52319786951532e-13
424154741547-2.75238036430598e-13
433852938529-1.17934840379857e-12
4451321513211.05158952856091e-12
454151941519-5.87106749390906e-13
466911669116-1.56000611288703e-12
471265712657-5.55082962443998e-12
4834801348013.55637114880694e-14
493796737967-5.92602534017711e-13
503940139401-3.19086172637381e-13
513342533425-6.28760309700135e-13
523622236222-3.53904781871073e-13
5348428484281.21931957432289e-13
544089140891-8.7356001233629e-13
553643236432-4.35175628351609e-13
5650669506698.43353351856457e-13
573955639556-1.04753179377113e-12
586890668906-2.44596156545993e-12

\begin{tabular}{lllllllll}
\hline
Multiple Linear Regression - Actuals, Interpolation, and Residuals \tabularnewline
Time or Index & Actuals & InterpolationForecast & ResidualsPrediction Error \tabularnewline
1 & 43071 & 43071 & 2.2236603765632e-11 \tabularnewline
2 & 45552 & 45552 & 3.04672082062726e-11 \tabularnewline
3 & 36329 & 36329 & 4.26423361600248e-14 \tabularnewline
4 & 37703 & 37703 & -2.13385244240005e-13 \tabularnewline
5 & 50519 & 50519 & 4.86497751854067e-13 \tabularnewline
6 & 36798 & 36798 & -3.00659056435213e-13 \tabularnewline
7 & 37056 & 37056 & -5.38808164607463e-13 \tabularnewline
8 & 44927 & 44927 & -3.45455282489792e-13 \tabularnewline
9 & 37635 & 37635 & -5.55874485369407e-13 \tabularnewline
10 & 62924 & 62924 & -3.58401426601991e-12 \tabularnewline
11 & 8170 & 8170 & -3.35495697743738e-13 \tabularnewline
12 & 27438 & 27438 & -4.43717423682596e-12 \tabularnewline
13 & 27429 & 27429 & -3.25679135312986e-12 \tabularnewline
14 & 33666 & 33666 & -1.43703305610115e-12 \tabularnewline
15 & 27733 & 27733 & -2.7549572778756e-12 \tabularnewline
16 & 33228 & 33228 & -8.52619085953262e-13 \tabularnewline
17 & 25699 & 25699 & -3.37009792118209e-12 \tabularnewline
18 & 303936 & 303936 & -1.8404020615302e-12 \tabularnewline
19 & 30169 & 30169 & -1.76324649894296e-12 \tabularnewline
20 & 35117 & 35117 & 3.74277331771232e-13 \tabularnewline
21 & 34870 & 34870 & -6.13054784378416e-13 \tabularnewline
22 & 56676 & 56676 & -5.41200710054708e-13 \tabularnewline
23 & 7054 & 7054 & -1.2848435245694e-12 \tabularnewline
24 & 29722 & 29722 & -1.93645495688464e-12 \tabularnewline
25 & 41629 & 41629 & -2.60871677557611e-13 \tabularnewline
26 & 41117 & 41117 & -8.459932444068e-13 \tabularnewline
27 & 39341 & 39341 & -8.48630114417741e-13 \tabularnewline
28 & 39486 & 39486 & -3.75031859962197e-13 \tabularnewline
29 & 48138 & 48138 & -3.41651401952082e-13 \tabularnewline
30 & 45633 & 45633 & -2.00131334769363e-13 \tabularnewline
31 & 41756 & 41756 & -3.33293578783459e-13 \tabularnewline
32 & 47221 & 47221 & -1.47454984751153e-13 \tabularnewline
33 & 50530 & 50530 & 2.28686915795456e-13 \tabularnewline
34 & 68184 & 68184 & -2.95114455345813e-12 \tabularnewline
35 & 8771 & 8771 & -1.83540998967634e-12 \tabularnewline
36 & 37898 & 37898 & 5.6460051058624e-14 \tabularnewline
37 & 41888 & 41888 & -2.80651559699103e-13 \tabularnewline
38 & 40439 & 40439 & -9.28915592800195e-13 \tabularnewline
39 & 40898 & 40898 & -5.5356421472793e-13 \tabularnewline
40 & 38401 & 38401 & -1.08371119844505e-12 \tabularnewline
41 & 52073 & 52073 & 8.52319786951532e-13 \tabularnewline
42 & 41547 & 41547 & -2.75238036430598e-13 \tabularnewline
43 & 38529 & 38529 & -1.17934840379857e-12 \tabularnewline
44 & 51321 & 51321 & 1.05158952856091e-12 \tabularnewline
45 & 41519 & 41519 & -5.87106749390906e-13 \tabularnewline
46 & 69116 & 69116 & -1.56000611288703e-12 \tabularnewline
47 & 12657 & 12657 & -5.55082962443998e-12 \tabularnewline
48 & 34801 & 34801 & 3.55637114880694e-14 \tabularnewline
49 & 37967 & 37967 & -5.92602534017711e-13 \tabularnewline
50 & 39401 & 39401 & -3.19086172637381e-13 \tabularnewline
51 & 33425 & 33425 & -6.28760309700135e-13 \tabularnewline
52 & 36222 & 36222 & -3.53904781871073e-13 \tabularnewline
53 & 48428 & 48428 & 1.21931957432289e-13 \tabularnewline
54 & 40891 & 40891 & -8.7356001233629e-13 \tabularnewline
55 & 36432 & 36432 & -4.35175628351609e-13 \tabularnewline
56 & 50669 & 50669 & 8.43353351856457e-13 \tabularnewline
57 & 39556 & 39556 & -1.04753179377113e-12 \tabularnewline
58 & 68906 & 68906 & -2.44596156545993e-12 \tabularnewline
\hline
\end{tabular}
%Source: https://freestatistics.org/blog/index.php?pk=101712&T=4

[TABLE]
[ROW][C]Multiple Linear Regression - Actuals, Interpolation, and Residuals[/C][/ROW]
[ROW][C]Time or Index[/C][C]Actuals[/C][C]InterpolationForecast[/C][C]ResidualsPrediction Error[/C][/ROW]
[ROW][C]1[/C][C]43071[/C][C]43071[/C][C]2.2236603765632e-11[/C][/ROW]
[ROW][C]2[/C][C]45552[/C][C]45552[/C][C]3.04672082062726e-11[/C][/ROW]
[ROW][C]3[/C][C]36329[/C][C]36329[/C][C]4.26423361600248e-14[/C][/ROW]
[ROW][C]4[/C][C]37703[/C][C]37703[/C][C]-2.13385244240005e-13[/C][/ROW]
[ROW][C]5[/C][C]50519[/C][C]50519[/C][C]4.86497751854067e-13[/C][/ROW]
[ROW][C]6[/C][C]36798[/C][C]36798[/C][C]-3.00659056435213e-13[/C][/ROW]
[ROW][C]7[/C][C]37056[/C][C]37056[/C][C]-5.38808164607463e-13[/C][/ROW]
[ROW][C]8[/C][C]44927[/C][C]44927[/C][C]-3.45455282489792e-13[/C][/ROW]
[ROW][C]9[/C][C]37635[/C][C]37635[/C][C]-5.55874485369407e-13[/C][/ROW]
[ROW][C]10[/C][C]62924[/C][C]62924[/C][C]-3.58401426601991e-12[/C][/ROW]
[ROW][C]11[/C][C]8170[/C][C]8170[/C][C]-3.35495697743738e-13[/C][/ROW]
[ROW][C]12[/C][C]27438[/C][C]27438[/C][C]-4.43717423682596e-12[/C][/ROW]
[ROW][C]13[/C][C]27429[/C][C]27429[/C][C]-3.25679135312986e-12[/C][/ROW]
[ROW][C]14[/C][C]33666[/C][C]33666[/C][C]-1.43703305610115e-12[/C][/ROW]
[ROW][C]15[/C][C]27733[/C][C]27733[/C][C]-2.7549572778756e-12[/C][/ROW]
[ROW][C]16[/C][C]33228[/C][C]33228[/C][C]-8.52619085953262e-13[/C][/ROW]
[ROW][C]17[/C][C]25699[/C][C]25699[/C][C]-3.37009792118209e-12[/C][/ROW]
[ROW][C]18[/C][C]303936[/C][C]303936[/C][C]-1.8404020615302e-12[/C][/ROW]
[ROW][C]19[/C][C]30169[/C][C]30169[/C][C]-1.76324649894296e-12[/C][/ROW]
[ROW][C]20[/C][C]35117[/C][C]35117[/C][C]3.74277331771232e-13[/C][/ROW]
[ROW][C]21[/C][C]34870[/C][C]34870[/C][C]-6.13054784378416e-13[/C][/ROW]
[ROW][C]22[/C][C]56676[/C][C]56676[/C][C]-5.41200710054708e-13[/C][/ROW]
[ROW][C]23[/C][C]7054[/C][C]7054[/C][C]-1.2848435245694e-12[/C][/ROW]
[ROW][C]24[/C][C]29722[/C][C]29722[/C][C]-1.93645495688464e-12[/C][/ROW]
[ROW][C]25[/C][C]41629[/C][C]41629[/C][C]-2.60871677557611e-13[/C][/ROW]
[ROW][C]26[/C][C]41117[/C][C]41117[/C][C]-8.459932444068e-13[/C][/ROW]
[ROW][C]27[/C][C]39341[/C][C]39341[/C][C]-8.48630114417741e-13[/C][/ROW]
[ROW][C]28[/C][C]39486[/C][C]39486[/C][C]-3.75031859962197e-13[/C][/ROW]
[ROW][C]29[/C][C]48138[/C][C]48138[/C][C]-3.41651401952082e-13[/C][/ROW]
[ROW][C]30[/C][C]45633[/C][C]45633[/C][C]-2.00131334769363e-13[/C][/ROW]
[ROW][C]31[/C][C]41756[/C][C]41756[/C][C]-3.33293578783459e-13[/C][/ROW]
[ROW][C]32[/C][C]47221[/C][C]47221[/C][C]-1.47454984751153e-13[/C][/ROW]
[ROW][C]33[/C][C]50530[/C][C]50530[/C][C]2.28686915795456e-13[/C][/ROW]
[ROW][C]34[/C][C]68184[/C][C]68184[/C][C]-2.95114455345813e-12[/C][/ROW]
[ROW][C]35[/C][C]8771[/C][C]8771[/C][C]-1.83540998967634e-12[/C][/ROW]
[ROW][C]36[/C][C]37898[/C][C]37898[/C][C]5.6460051058624e-14[/C][/ROW]
[ROW][C]37[/C][C]41888[/C][C]41888[/C][C]-2.80651559699103e-13[/C][/ROW]
[ROW][C]38[/C][C]40439[/C][C]40439[/C][C]-9.28915592800195e-13[/C][/ROW]
[ROW][C]39[/C][C]40898[/C][C]40898[/C][C]-5.5356421472793e-13[/C][/ROW]
[ROW][C]40[/C][C]38401[/C][C]38401[/C][C]-1.08371119844505e-12[/C][/ROW]
[ROW][C]41[/C][C]52073[/C][C]52073[/C][C]8.52319786951532e-13[/C][/ROW]
[ROW][C]42[/C][C]41547[/C][C]41547[/C][C]-2.75238036430598e-13[/C][/ROW]
[ROW][C]43[/C][C]38529[/C][C]38529[/C][C]-1.17934840379857e-12[/C][/ROW]
[ROW][C]44[/C][C]51321[/C][C]51321[/C][C]1.05158952856091e-12[/C][/ROW]
[ROW][C]45[/C][C]41519[/C][C]41519[/C][C]-5.87106749390906e-13[/C][/ROW]
[ROW][C]46[/C][C]69116[/C][C]69116[/C][C]-1.56000611288703e-12[/C][/ROW]
[ROW][C]47[/C][C]12657[/C][C]12657[/C][C]-5.55082962443998e-12[/C][/ROW]
[ROW][C]48[/C][C]34801[/C][C]34801[/C][C]3.55637114880694e-14[/C][/ROW]
[ROW][C]49[/C][C]37967[/C][C]37967[/C][C]-5.92602534017711e-13[/C][/ROW]
[ROW][C]50[/C][C]39401[/C][C]39401[/C][C]-3.19086172637381e-13[/C][/ROW]
[ROW][C]51[/C][C]33425[/C][C]33425[/C][C]-6.28760309700135e-13[/C][/ROW]
[ROW][C]52[/C][C]36222[/C][C]36222[/C][C]-3.53904781871073e-13[/C][/ROW]
[ROW][C]53[/C][C]48428[/C][C]48428[/C][C]1.21931957432289e-13[/C][/ROW]
[ROW][C]54[/C][C]40891[/C][C]40891[/C][C]-8.7356001233629e-13[/C][/ROW]
[ROW][C]55[/C][C]36432[/C][C]36432[/C][C]-4.35175628351609e-13[/C][/ROW]
[ROW][C]56[/C][C]50669[/C][C]50669[/C][C]8.43353351856457e-13[/C][/ROW]
[ROW][C]57[/C][C]39556[/C][C]39556[/C][C]-1.04753179377113e-12[/C][/ROW]
[ROW][C]58[/C][C]68906[/C][C]68906[/C][C]-2.44596156545993e-12[/C][/ROW]
[/TABLE]
Source: https://freestatistics.org/blog/index.php?pk=101712&T=4

Globally Unique Identifier (entire table): ba.freestatistics.org/blog/index.php?pk=101712&T=4

As an alternative you can also use a QR Code:  

The GUIDs for individual cells are displayed in the table below:

Multiple Linear Regression - Actuals, Interpolation, and Residuals
Time or IndexActualsInterpolationForecastResidualsPrediction Error
143071430712.2236603765632e-11
245552455523.04672082062726e-11
336329363294.26423361600248e-14
43770337703-2.13385244240005e-13
550519505194.86497751854067e-13
63679836798-3.00659056435213e-13
73705637056-5.38808164607463e-13
84492744927-3.45455282489792e-13
93763537635-5.55874485369407e-13
106292462924-3.58401426601991e-12
1181708170-3.35495697743738e-13
122743827438-4.43717423682596e-12
132742927429-3.25679135312986e-12
143366633666-1.43703305610115e-12
152773327733-2.7549572778756e-12
163322833228-8.52619085953262e-13
172569925699-3.37009792118209e-12
18303936303936-1.8404020615302e-12
193016930169-1.76324649894296e-12
2035117351173.74277331771232e-13
213487034870-6.13054784378416e-13
225667656676-5.41200710054708e-13
2370547054-1.2848435245694e-12
242972229722-1.93645495688464e-12
254162941629-2.60871677557611e-13
264111741117-8.459932444068e-13
273934139341-8.48630114417741e-13
283948639486-3.75031859962197e-13
294813848138-3.41651401952082e-13
304563345633-2.00131334769363e-13
314175641756-3.33293578783459e-13
324722147221-1.47454984751153e-13
3350530505302.28686915795456e-13
346818468184-2.95114455345813e-12
3587718771-1.83540998967634e-12
3637898378985.6460051058624e-14
374188841888-2.80651559699103e-13
384043940439-9.28915592800195e-13
394089840898-5.5356421472793e-13
403840138401-1.08371119844505e-12
4152073520738.52319786951532e-13
424154741547-2.75238036430598e-13
433852938529-1.17934840379857e-12
4451321513211.05158952856091e-12
454151941519-5.87106749390906e-13
466911669116-1.56000611288703e-12
471265712657-5.55082962443998e-12
4834801348013.55637114880694e-14
493796737967-5.92602534017711e-13
503940139401-3.19086172637381e-13
513342533425-6.28760309700135e-13
523622236222-3.53904781871073e-13
5348428484281.21931957432289e-13
544089140891-8.7356001233629e-13
553643236432-4.35175628351609e-13
5650669506698.43353351856457e-13
573955639556-1.04753179377113e-12
586890668906-2.44596156545993e-12


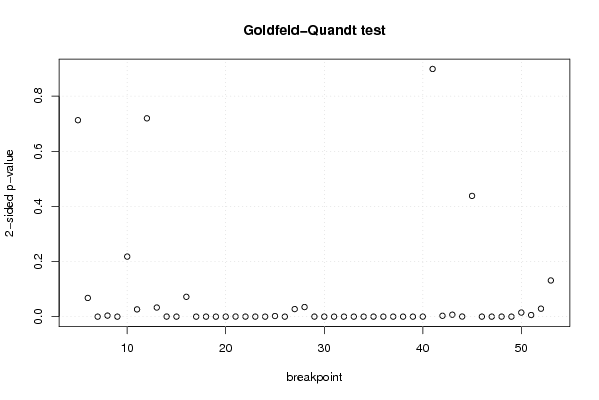
Goldfeld-Quandt test for Heteroskedasticity
p-valuesAlternative Hypothesis
breakpoint indexgreater2-sidedless
50.6436247806016130.7127504387967740.356375219398387
60.03389929377184420.06779858754368850.966100706228156
71.7533612454129e-053.50672249082579e-050.999982466387546
80.001884253071514250.003768506143028510.998115746928486
91.09350040670322e-092.18700081340644e-090.9999999989065
100.1089472738464990.2178945476929980.891052726153501
110.01319260876323180.02638521752646360.986807391236768
120.6402307148617530.7195385702764930.359769285138247
130.01656231247969770.03312462495939540.983437687520302
140.0001557030031925060.0003114060063850120.999844296996808
151.5621927153799e-083.1243854307598e-080.999999984378073
160.03597121224103090.07194242448206180.96402878775897
174.07618659292687e-078.15237318585373e-070.99999959238134
180.9999999999999251.49815667557007e-137.49078337785034e-14
190.9999999986491472.70170686905424e-091.35085343452712e-09
200.999999768574964.62850081089316e-072.31425040544658e-07
210.999840276515350.0003194469692997840.000159723484649892
220.9999288243625180.0001423512749650287.11756374825139e-05
230.999922756965760.0001544860684812917.72430342406453e-05
240.9999778961461524.42077076953096e-052.21038538476548e-05
250.9988776224573040.002244755085391260.00112237754269563
260.999999999527219.45578953534809e-104.72789476767404e-10
270.01373535998516160.02747071997032310.986264640014838
280.9825920967132310.0348158065735370.0174079032867685
290.999939999919730.0001200001605416836.00000802708417e-05
300.999999997100135.7997410264901e-092.89987051324505e-09
310.9999999999477821.04436260243385e-105.22181301216923e-11
320.9999999998325953.34809765406716e-101.67404882703358e-10
330.999998142678453.71464310169238e-061.85732155084619e-06
349.21861805467312e-061.84372361093462e-050.999990781381945
350.9999987970525682.40589486466529e-061.20294743233265e-06
360.9999999999999911.73178949193526e-148.65894745967632e-15
370.9999975863144484.8273711033365e-062.41368555166825e-06
380.999999551773018.96453980864269e-074.48226990432135e-07
3917.86957129418019e-163.93478564709009e-16
400.9999837515187373.24969625257086e-051.62484812628543e-05
410.4492982409516770.8985964819033540.550701759048323
420.9984214256217580.00315714875648420.0015785743782421
430.003503825499577360.007007650999154710.996496174500423
440.0001940355307491080.0003880710614982160.999805964469251
450.2189864511631510.4379729023263030.781013548836849
460.999959551445038.08971099405522e-054.04485549702761e-05
470.9999963423511227.3152977555781e-063.65764887778905e-06
480.9999496535644210.0001006928711571855.03464355785925e-05
490.9999900026713231.99946573549931e-059.99732867749656e-06
500.992568460363670.01486307927265880.00743153963632939
510.9970319851106870.005936029778625270.00296801488931263
520.9855695550623740.02886088987525130.0144304449376257
530.06562836009682980.131256720193660.93437163990317

\begin{tabular}{lllllllll}
\hline
Goldfeld-Quandt test for Heteroskedasticity \tabularnewline
p-values & Alternative Hypothesis \tabularnewline
breakpoint index & greater & 2-sided & less \tabularnewline
5 & 0.643624780601613 & 0.712750438796774 & 0.356375219398387 \tabularnewline
6 & 0.0338992937718442 & 0.0677985875436885 & 0.966100706228156 \tabularnewline
7 & 1.7533612454129e-05 & 3.50672249082579e-05 & 0.999982466387546 \tabularnewline
8 & 0.00188425307151425 & 0.00376850614302851 & 0.998115746928486 \tabularnewline
9 & 1.09350040670322e-09 & 2.18700081340644e-09 & 0.9999999989065 \tabularnewline
10 & 0.108947273846499 & 0.217894547692998 & 0.891052726153501 \tabularnewline
11 & 0.0131926087632318 & 0.0263852175264636 & 0.986807391236768 \tabularnewline
12 & 0.640230714861753 & 0.719538570276493 & 0.359769285138247 \tabularnewline
13 & 0.0165623124796977 & 0.0331246249593954 & 0.983437687520302 \tabularnewline
14 & 0.000155703003192506 & 0.000311406006385012 & 0.999844296996808 \tabularnewline
15 & 1.5621927153799e-08 & 3.1243854307598e-08 & 0.999999984378073 \tabularnewline
16 & 0.0359712122410309 & 0.0719424244820618 & 0.96402878775897 \tabularnewline
17 & 4.07618659292687e-07 & 8.15237318585373e-07 & 0.99999959238134 \tabularnewline
18 & 0.999999999999925 & 1.49815667557007e-13 & 7.49078337785034e-14 \tabularnewline
19 & 0.999999998649147 & 2.70170686905424e-09 & 1.35085343452712e-09 \tabularnewline
20 & 0.99999976857496 & 4.62850081089316e-07 & 2.31425040544658e-07 \tabularnewline
21 & 0.99984027651535 & 0.000319446969299784 & 0.000159723484649892 \tabularnewline
22 & 0.999928824362518 & 0.000142351274965028 & 7.11756374825139e-05 \tabularnewline
23 & 0.99992275696576 & 0.000154486068481291 & 7.72430342406453e-05 \tabularnewline
24 & 0.999977896146152 & 4.42077076953096e-05 & 2.21038538476548e-05 \tabularnewline
25 & 0.998877622457304 & 0.00224475508539126 & 0.00112237754269563 \tabularnewline
26 & 0.99999999952721 & 9.45578953534809e-10 & 4.72789476767404e-10 \tabularnewline
27 & 0.0137353599851616 & 0.0274707199703231 & 0.986264640014838 \tabularnewline
28 & 0.982592096713231 & 0.034815806573537 & 0.0174079032867685 \tabularnewline
29 & 0.99993999991973 & 0.000120000160541683 & 6.00000802708417e-05 \tabularnewline
30 & 0.99999999710013 & 5.7997410264901e-09 & 2.89987051324505e-09 \tabularnewline
31 & 0.999999999947782 & 1.04436260243385e-10 & 5.22181301216923e-11 \tabularnewline
32 & 0.999999999832595 & 3.34809765406716e-10 & 1.67404882703358e-10 \tabularnewline
33 & 0.99999814267845 & 3.71464310169238e-06 & 1.85732155084619e-06 \tabularnewline
34 & 9.21861805467312e-06 & 1.84372361093462e-05 & 0.999990781381945 \tabularnewline
35 & 0.999998797052568 & 2.40589486466529e-06 & 1.20294743233265e-06 \tabularnewline
36 & 0.999999999999991 & 1.73178949193526e-14 & 8.65894745967632e-15 \tabularnewline
37 & 0.999997586314448 & 4.8273711033365e-06 & 2.41368555166825e-06 \tabularnewline
38 & 0.99999955177301 & 8.96453980864269e-07 & 4.48226990432135e-07 \tabularnewline
39 & 1 & 7.86957129418019e-16 & 3.93478564709009e-16 \tabularnewline
40 & 0.999983751518737 & 3.24969625257086e-05 & 1.62484812628543e-05 \tabularnewline
41 & 0.449298240951677 & 0.898596481903354 & 0.550701759048323 \tabularnewline
42 & 0.998421425621758 & 0.0031571487564842 & 0.0015785743782421 \tabularnewline
43 & 0.00350382549957736 & 0.00700765099915471 & 0.996496174500423 \tabularnewline
44 & 0.000194035530749108 & 0.000388071061498216 & 0.999805964469251 \tabularnewline
45 & 0.218986451163151 & 0.437972902326303 & 0.781013548836849 \tabularnewline
46 & 0.99995955144503 & 8.08971099405522e-05 & 4.04485549702761e-05 \tabularnewline
47 & 0.999996342351122 & 7.3152977555781e-06 & 3.65764887778905e-06 \tabularnewline
48 & 0.999949653564421 & 0.000100692871157185 & 5.03464355785925e-05 \tabularnewline
49 & 0.999990002671323 & 1.99946573549931e-05 & 9.99732867749656e-06 \tabularnewline
50 & 0.99256846036367 & 0.0148630792726588 & 0.00743153963632939 \tabularnewline
51 & 0.997031985110687 & 0.00593602977862527 & 0.00296801488931263 \tabularnewline
52 & 0.985569555062374 & 0.0288608898752513 & 0.0144304449376257 \tabularnewline
53 & 0.0656283600968298 & 0.13125672019366 & 0.93437163990317 \tabularnewline
\hline
\end{tabular}
%Source: https://freestatistics.org/blog/index.php?pk=101712&T=5

[TABLE]
[ROW][C]Goldfeld-Quandt test for Heteroskedasticity[/C][/ROW]
[ROW][C]p-values[/C][C]Alternative Hypothesis[/C][/ROW]
[ROW][C]breakpoint index[/C][C]greater[/C][C]2-sided[/C][C]less[/C][/ROW]
[ROW][C]5[/C][C]0.643624780601613[/C][C]0.712750438796774[/C][C]0.356375219398387[/C][/ROW]
[ROW][C]6[/C][C]0.0338992937718442[/C][C]0.0677985875436885[/C][C]0.966100706228156[/C][/ROW]
[ROW][C]7[/C][C]1.7533612454129e-05[/C][C]3.50672249082579e-05[/C][C]0.999982466387546[/C][/ROW]
[ROW][C]8[/C][C]0.00188425307151425[/C][C]0.00376850614302851[/C][C]0.998115746928486[/C][/ROW]
[ROW][C]9[/C][C]1.09350040670322e-09[/C][C]2.18700081340644e-09[/C][C]0.9999999989065[/C][/ROW]
[ROW][C]10[/C][C]0.108947273846499[/C][C]0.217894547692998[/C][C]0.891052726153501[/C][/ROW]
[ROW][C]11[/C][C]0.0131926087632318[/C][C]0.0263852175264636[/C][C]0.986807391236768[/C][/ROW]
[ROW][C]12[/C][C]0.640230714861753[/C][C]0.719538570276493[/C][C]0.359769285138247[/C][/ROW]
[ROW][C]13[/C][C]0.0165623124796977[/C][C]0.0331246249593954[/C][C]0.983437687520302[/C][/ROW]
[ROW][C]14[/C][C]0.000155703003192506[/C][C]0.000311406006385012[/C][C]0.999844296996808[/C][/ROW]
[ROW][C]15[/C][C]1.5621927153799e-08[/C][C]3.1243854307598e-08[/C][C]0.999999984378073[/C][/ROW]
[ROW][C]16[/C][C]0.0359712122410309[/C][C]0.0719424244820618[/C][C]0.96402878775897[/C][/ROW]
[ROW][C]17[/C][C]4.07618659292687e-07[/C][C]8.15237318585373e-07[/C][C]0.99999959238134[/C][/ROW]
[ROW][C]18[/C][C]0.999999999999925[/C][C]1.49815667557007e-13[/C][C]7.49078337785034e-14[/C][/ROW]
[ROW][C]19[/C][C]0.999999998649147[/C][C]2.70170686905424e-09[/C][C]1.35085343452712e-09[/C][/ROW]
[ROW][C]20[/C][C]0.99999976857496[/C][C]4.62850081089316e-07[/C][C]2.31425040544658e-07[/C][/ROW]
[ROW][C]21[/C][C]0.99984027651535[/C][C]0.000319446969299784[/C][C]0.000159723484649892[/C][/ROW]
[ROW][C]22[/C][C]0.999928824362518[/C][C]0.000142351274965028[/C][C]7.11756374825139e-05[/C][/ROW]
[ROW][C]23[/C][C]0.99992275696576[/C][C]0.000154486068481291[/C][C]7.72430342406453e-05[/C][/ROW]
[ROW][C]24[/C][C]0.999977896146152[/C][C]4.42077076953096e-05[/C][C]2.21038538476548e-05[/C][/ROW]
[ROW][C]25[/C][C]0.998877622457304[/C][C]0.00224475508539126[/C][C]0.00112237754269563[/C][/ROW]
[ROW][C]26[/C][C]0.99999999952721[/C][C]9.45578953534809e-10[/C][C]4.72789476767404e-10[/C][/ROW]
[ROW][C]27[/C][C]0.0137353599851616[/C][C]0.0274707199703231[/C][C]0.986264640014838[/C][/ROW]
[ROW][C]28[/C][C]0.982592096713231[/C][C]0.034815806573537[/C][C]0.0174079032867685[/C][/ROW]
[ROW][C]29[/C][C]0.99993999991973[/C][C]0.000120000160541683[/C][C]6.00000802708417e-05[/C][/ROW]
[ROW][C]30[/C][C]0.99999999710013[/C][C]5.7997410264901e-09[/C][C]2.89987051324505e-09[/C][/ROW]
[ROW][C]31[/C][C]0.999999999947782[/C][C]1.04436260243385e-10[/C][C]5.22181301216923e-11[/C][/ROW]
[ROW][C]32[/C][C]0.999999999832595[/C][C]3.34809765406716e-10[/C][C]1.67404882703358e-10[/C][/ROW]
[ROW][C]33[/C][C]0.99999814267845[/C][C]3.71464310169238e-06[/C][C]1.85732155084619e-06[/C][/ROW]
[ROW][C]34[/C][C]9.21861805467312e-06[/C][C]1.84372361093462e-05[/C][C]0.999990781381945[/C][/ROW]
[ROW][C]35[/C][C]0.999998797052568[/C][C]2.40589486466529e-06[/C][C]1.20294743233265e-06[/C][/ROW]
[ROW][C]36[/C][C]0.999999999999991[/C][C]1.73178949193526e-14[/C][C]8.65894745967632e-15[/C][/ROW]
[ROW][C]37[/C][C]0.999997586314448[/C][C]4.8273711033365e-06[/C][C]2.41368555166825e-06[/C][/ROW]
[ROW][C]38[/C][C]0.99999955177301[/C][C]8.96453980864269e-07[/C][C]4.48226990432135e-07[/C][/ROW]
[ROW][C]39[/C][C]1[/C][C]7.86957129418019e-16[/C][C]3.93478564709009e-16[/C][/ROW]
[ROW][C]40[/C][C]0.999983751518737[/C][C]3.24969625257086e-05[/C][C]1.62484812628543e-05[/C][/ROW]
[ROW][C]41[/C][C]0.449298240951677[/C][C]0.898596481903354[/C][C]0.550701759048323[/C][/ROW]
[ROW][C]42[/C][C]0.998421425621758[/C][C]0.0031571487564842[/C][C]0.0015785743782421[/C][/ROW]
[ROW][C]43[/C][C]0.00350382549957736[/C][C]0.00700765099915471[/C][C]0.996496174500423[/C][/ROW]
[ROW][C]44[/C][C]0.000194035530749108[/C][C]0.000388071061498216[/C][C]0.999805964469251[/C][/ROW]
[ROW][C]45[/C][C]0.218986451163151[/C][C]0.437972902326303[/C][C]0.781013548836849[/C][/ROW]
[ROW][C]46[/C][C]0.99995955144503[/C][C]8.08971099405522e-05[/C][C]4.04485549702761e-05[/C][/ROW]
[ROW][C]47[/C][C]0.999996342351122[/C][C]7.3152977555781e-06[/C][C]3.65764887778905e-06[/C][/ROW]
[ROW][C]48[/C][C]0.999949653564421[/C][C]0.000100692871157185[/C][C]5.03464355785925e-05[/C][/ROW]
[ROW][C]49[/C][C]0.999990002671323[/C][C]1.99946573549931e-05[/C][C]9.99732867749656e-06[/C][/ROW]
[ROW][C]50[/C][C]0.99256846036367[/C][C]0.0148630792726588[/C][C]0.00743153963632939[/C][/ROW]
[ROW][C]51[/C][C]0.997031985110687[/C][C]0.00593602977862527[/C][C]0.00296801488931263[/C][/ROW]
[ROW][C]52[/C][C]0.985569555062374[/C][C]0.0288608898752513[/C][C]0.0144304449376257[/C][/ROW]
[ROW][C]53[/C][C]0.0656283600968298[/C][C]0.13125672019366[/C][C]0.93437163990317[/C][/ROW]
[/TABLE]
Source: https://freestatistics.org/blog/index.php?pk=101712&T=5

Globally Unique Identifier (entire table): ba.freestatistics.org/blog/index.php?pk=101712&T=5

As an alternative you can also use a QR Code:  

The GUIDs for individual cells are displayed in the table below:

Goldfeld-Quandt test for Heteroskedasticity
p-valuesAlternative Hypothesis
breakpoint indexgreater2-sidedless
50.6436247806016130.7127504387967740.356375219398387
60.03389929377184420.06779858754368850.966100706228156
71.7533612454129e-053.50672249082579e-050.999982466387546
80.001884253071514250.003768506143028510.998115746928486
91.09350040670322e-092.18700081340644e-090.9999999989065
100.1089472738464990.2178945476929980.891052726153501
110.01319260876323180.02638521752646360.986807391236768
120.6402307148617530.7195385702764930.359769285138247
130.01656231247969770.03312462495939540.983437687520302
140.0001557030031925060.0003114060063850120.999844296996808
151.5621927153799e-083.1243854307598e-080.999999984378073
160.03597121224103090.07194242448206180.96402878775897
174.07618659292687e-078.15237318585373e-070.99999959238134
180.9999999999999251.49815667557007e-137.49078337785034e-14
190.9999999986491472.70170686905424e-091.35085343452712e-09
200.999999768574964.62850081089316e-072.31425040544658e-07
210.999840276515350.0003194469692997840.000159723484649892
220.9999288243625180.0001423512749650287.11756374825139e-05
230.999922756965760.0001544860684812917.72430342406453e-05
240.9999778961461524.42077076953096e-052.21038538476548e-05
250.9988776224573040.002244755085391260.00112237754269563
260.999999999527219.45578953534809e-104.72789476767404e-10
270.01373535998516160.02747071997032310.986264640014838
280.9825920967132310.0348158065735370.0174079032867685
290.999939999919730.0001200001605416836.00000802708417e-05
300.999999997100135.7997410264901e-092.89987051324505e-09
310.9999999999477821.04436260243385e-105.22181301216923e-11
320.9999999998325953.34809765406716e-101.67404882703358e-10
330.999998142678453.71464310169238e-061.85732155084619e-06
349.21861805467312e-061.84372361093462e-050.999990781381945
350.9999987970525682.40589486466529e-061.20294743233265e-06
360.9999999999999911.73178949193526e-148.65894745967632e-15
370.9999975863144484.8273711033365e-062.41368555166825e-06
380.999999551773018.96453980864269e-074.48226990432135e-07
3917.86957129418019e-163.93478564709009e-16
400.9999837515187373.24969625257086e-051.62484812628543e-05
410.4492982409516770.8985964819033540.550701759048323
420.9984214256217580.00315714875648420.0015785743782421
430.003503825499577360.007007650999154710.996496174500423
440.0001940355307491080.0003880710614982160.999805964469251
450.2189864511631510.4379729023263030.781013548836849
460.999959551445038.08971099405522e-054.04485549702761e-05
470.9999963423511227.3152977555781e-063.65764887778905e-06
480.9999496535644210.0001006928711571855.03464355785925e-05
490.9999900026713231.99946573549931e-059.99732867749656e-06
500.992568460363670.01486307927265880.00743153963632939
510.9970319851106870.005936029778625270.00296801488931263
520.9855695550623740.02886088987525130.0144304449376257
530.06562836009682980.131256720193660.93437163990317


Meta Analysis of Goldfeld-Quandt test for Heteroskedasticity
Description# significant tests% significant testsOK/NOK
1% type I error level350.714285714285714NOK
5% type I error level410.836734693877551NOK
10% type I error level430.877551020408163NOK

\begin{tabular}{lllllllll}
\hline
Meta Analysis of Goldfeld-Quandt test for Heteroskedasticity \tabularnewline
Description & # significant tests & % significant tests & OK/NOK \tabularnewline
1% type I error level & 35 & 0.714285714285714 & NOK \tabularnewline
5% type I error level & 41 & 0.836734693877551 & NOK \tabularnewline
10% type I error level & 43 & 0.877551020408163 & NOK \tabularnewline
\hline
\end{tabular}
%Source: https://freestatistics.org/blog/index.php?pk=101712&T=6

[TABLE]
[ROW][C]Meta Analysis of Goldfeld-Quandt test for Heteroskedasticity[/C][/ROW]
[ROW][C]Description[/C][C]# significant tests[/C][C]% significant tests[/C][C]OK/NOK[/C][/ROW]
[ROW][C]1% type I error level[/C][C]35[/C][C]0.714285714285714[/C][C]NOK[/C][/ROW]
[ROW][C]5% type I error level[/C][C]41[/C][C]0.836734693877551[/C][C]NOK[/C][/ROW]
[ROW][C]10% type I error level[/C][C]43[/C][C]0.877551020408163[/C][C]NOK[/C][/ROW]
[/TABLE]
Source: https://freestatistics.org/blog/index.php?pk=101712&T=6

Globally Unique Identifier (entire table): ba.freestatistics.org/blog/index.php?pk=101712&T=6

As an alternative you can also use a QR Code:  

The GUIDs for individual cells are displayed in the table below:

Meta Analysis of Goldfeld-Quandt test for Heteroskedasticity
Description# significant tests% significant testsOK/NOK
1% type I error level350.714285714285714NOK
5% type I error level410.836734693877551NOK
10% type I error level430.877551020408163NOK


Parameters (Session):
par1 = 1 ; par2 = Do not include Seasonal Dummies ; par3 = No Linear Trend ;
Parameters (R input):
par1 = 1 ; par2 = Do not include Seasonal Dummies ; par3 = No Linear Trend ;
R code (references can be found in the software module):
library(lattice)
library(lmtest)
n25 <- 25 #minimum number of obs. for Goldfeld-Quandt test
par1 <- as.numeric(par1)
x <- t(y)
k <- length(x[1,])
n <- length(x[,1])
x1 <- cbind(x[,par1], x[,1:k!=par1])
mycolnames <- c(colnames(x)[par1], colnames(x)[1:k!=par1])
colnames(x1) <- mycolnames #colnames(x)[par1]
x <- x1
if (par3 == 'First Differences'){
x2 <- array(0, dim=c(n-1,k), dimnames=list(1:(n-1), paste('(1-B)',colnames(x),sep='')))
for (i in 1:n-1) {
for (j in 1:k) {
x2[i,j] <- x[i+1,j] - x[i,j]
}
}
x <- x2
}
if (par2 == 'Include Monthly Dummies'){
x2 <- array(0, dim=c(n,11), dimnames=list(1:n, paste('M', seq(1:11), sep ='')))
for (i in 1:11){
x2[seq(i,n,12),i] <- 1
}
x <- cbind(x, x2)
}
if (par2 == 'Include Quarterly Dummies'){
x2 <- array(0, dim=c(n,3), dimnames=list(1:n, paste('Q', seq(1:3), sep ='')))
for (i in 1:3){
x2[seq(i,n,4),i] <- 1
}
x <- cbind(x, x2)
}
k <- length(x[1,])
if (par3 == 'Linear Trend'){
x <- cbind(x, c(1:n))
colnames(x)[k+1] <- 't'
}
x
k <- length(x[1,])
df <- as.data.frame(x)
(mylm <- lm(df))
(mysum <- summary(mylm))
if (n > n25) {
kp3 <- k + 3
nmkm3 <- n - k - 3
gqarr <- array(NA, dim=c(nmkm3-kp3+1,3))
numgqtests <- 0
numsignificant1 <- 0
numsignificant5 <- 0
numsignificant10 <- 0
for (mypoint in kp3:nmkm3) {
j <- 0
numgqtests <- numgqtests + 1
for (myalt in c('greater', 'two.sided', 'less')) {
j <- j + 1
gqarr[mypoint-kp3+1,j] <- gqtest(mylm, point=mypoint, alternative=myalt)$p.value
}
if (gqarr[mypoint-kp3+1,2] < 0.01) numsignificant1 <- numsignificant1 + 1
if (gqarr[mypoint-kp3+1,2] < 0.05) numsignificant5 <- numsignificant5 + 1
if (gqarr[mypoint-kp3+1,2] < 0.10) numsignificant10 <- numsignificant10 + 1
}
gqarr
}
bitmap(file='test0.png')
plot(x[,1], type='l', main='Actuals and Interpolation', ylab='value of Actuals and Interpolation (dots)', xlab='time or index')
points(x[,1]-mysum$resid)
grid()
dev.off()
bitmap(file='test1.png')
plot(mysum$resid, type='b', pch=19, main='Residuals', ylab='value of Residuals', xlab='time or index')
grid()
dev.off()
bitmap(file='test2.png')
hist(mysum$resid, main='Residual Histogram', xlab='values of Residuals')
grid()
dev.off()
bitmap(file='test3.png')
densityplot(~mysum$resid,col='black',main='Residual Density Plot', xlab='values of Residuals')
dev.off()
bitmap(file='test4.png')
qqnorm(mysum$resid, main='Residual Normal Q-Q Plot')
qqline(mysum$resid)
grid()
dev.off()
(myerror <- as.ts(mysum$resid))
bitmap(file='test5.png')
dum <- cbind(lag(myerror,k=1),myerror)
dum
dum1 <- dum[2:length(myerror),]
dum1
z <- as.data.frame(dum1)
z
plot(z,main=paste('Residual Lag plot, lowess, and regression line'), ylab='values of Residuals', xlab='lagged values of Residuals')
lines(lowess(z))
abline(lm(z))
grid()
dev.off()
bitmap(file='test6.png')
acf(mysum$resid, lag.max=length(mysum$resid)/2, main='Residual Autocorrelation Function')
grid()
dev.off()
bitmap(file='test7.png')
pacf(mysum$resid, lag.max=length(mysum$resid)/2, main='Residual Partial Autocorrelation Function')
grid()
dev.off()
bitmap(file='test8.png')
opar <- par(mfrow = c(2,2), oma = c(0, 0, 1.1, 0))
plot(mylm, las = 1, sub='Residual Diagnostics')
par(opar)
dev.off()
if (n > n25) {
bitmap(file='test9.png')
plot(kp3:nmkm3,gqarr[,2], main='Goldfeld-Quandt test',ylab='2-sided p-value',xlab='breakpoint')
grid()
dev.off()
}
load(file='createtable')
a<-table.start()
a<-table.row.start(a)
a<-table.element(a, 'Multiple Linear Regression - Estimated Regression Equation', 1, TRUE)
a<-table.row.end(a)
myeq <- colnames(x)[1]
myeq <- paste(myeq, '[t] = ', sep='')
for (i in 1:k){
if (mysum$coefficients[i,1] > 0) myeq <- paste(myeq, '+', '')
myeq <- paste(myeq, mysum$coefficients[i,1], sep=' ')
if (rownames(mysum$coefficients)[i] != '(Intercept)') {
myeq <- paste(myeq, rownames(mysum$coefficients)[i], sep='')
if (rownames(mysum$coefficients)[i] != 't') myeq <- paste(myeq, '[t]', sep='')
}
}
myeq <- paste(myeq, ' + e[t]')
a<-table.row.start(a)
a<-table.element(a, myeq)
a<-table.row.end(a)
a<-table.end(a)
table.save(a,file='mytable1.tab')
a<-table.start()
a<-table.row.start(a)
a<-table.element(a,hyperlink('ols1.htm','Multiple Linear Regression - Ordinary Least Squares',''), 6, TRUE)
a<-table.row.end(a)
a<-table.row.start(a)
a<-table.element(a,'Variable',header=TRUE)
a<-table.element(a,'Parameter',header=TRUE)
a<-table.element(a,'S.D.',header=TRUE)
a<-table.element(a,'T-STAT
H0: parameter = 0',header=TRUE)
a<-table.element(a,'2-tail p-value',header=TRUE)
a<-table.element(a,'1-tail p-value',header=TRUE)
a<-table.row.end(a)
for (i in 1:k){
a<-table.row.start(a)
a<-table.element(a,rownames(mysum$coefficients)[i],header=TRUE)
a<-table.element(a,mysum$coefficients[i,1])
a<-table.element(a, round(mysum$coefficients[i,2],6))
a<-table.element(a, round(mysum$coefficients[i,3],4))
a<-table.element(a, round(mysum$coefficients[i,4],6))
a<-table.element(a, round(mysum$coefficients[i,4]/2,6))
a<-table.row.end(a)
}
a<-table.end(a)
table.save(a,file='mytable2.tab')
a<-table.start()
a<-table.row.start(a)
a<-table.element(a, 'Multiple Linear Regression - Regression Statistics', 2, TRUE)
a<-table.row.end(a)
a<-table.row.start(a)
a<-table.element(a, 'Multiple R',1,TRUE)
a<-table.element(a, sqrt(mysum$r.squared))
a<-table.row.end(a)
a<-table.row.start(a)
a<-table.element(a, 'R-squared',1,TRUE)
a<-table.element(a, mysum$r.squared)
a<-table.row.end(a)
a<-table.row.start(a)
a<-table.element(a, 'Adjusted R-squared',1,TRUE)
a<-table.element(a, mysum$adj.r.squared)
a<-table.row.end(a)
a<-table.row.start(a)
a<-table.element(a, 'F-TEST (value)',1,TRUE)
a<-table.element(a, mysum$fstatistic[1])
a<-table.row.end(a)
a<-table.row.start(a)
a<-table.element(a, 'F-TEST (DF numerator)',1,TRUE)
a<-table.element(a, mysum$fstatistic[2])
a<-table.row.end(a)
a<-table.row.start(a)
a<-table.element(a, 'F-TEST (DF denominator)',1,TRUE)
a<-table.element(a, mysum$fstatistic[3])
a<-table.row.end(a)
a<-table.row.start(a)
a<-table.element(a, 'p-value',1,TRUE)
a<-table.element(a, 1-pf(mysum$fstatistic[1],mysum$fstatistic[2],mysum$fstatistic[3]))
a<-table.row.end(a)
a<-table.row.start(a)
a<-table.element(a, 'Multiple Linear Regression - Residual Statistics', 2, TRUE)
a<-table.row.end(a)
a<-table.row.start(a)
a<-table.element(a, 'Residual Standard Deviation',1,TRUE)
a<-table.element(a, mysum$sigma)
a<-table.row.end(a)
a<-table.row.start(a)
a<-table.element(a, 'Sum Squared Residuals',1,TRUE)
a<-table.element(a, sum(myerror*myerror))
a<-table.row.end(a)
a<-table.end(a)
table.save(a,file='mytable3.tab')
a<-table.start()
a<-table.row.start(a)
a<-table.element(a, 'Multiple Linear Regression - Actuals, Interpolation, and Residuals', 4, TRUE)
a<-table.row.end(a)
a<-table.row.start(a)
a<-table.element(a, 'Time or Index', 1, TRUE)
a<-table.element(a, 'Actuals', 1, TRUE)
a<-table.element(a, 'Interpolation
Forecast', 1, TRUE)
a<-table.element(a, 'Residuals
Prediction Error', 1, TRUE)
a<-table.row.end(a)
for (i in 1:n) {
a<-table.row.start(a)
a<-table.element(a,i, 1, TRUE)
a<-table.element(a,x[i])
a<-table.element(a,x[i]-mysum$resid[i])
a<-table.element(a,mysum$resid[i])
a<-table.row.end(a)
}
a<-table.end(a)
table.save(a,file='mytable4.tab')
if (n > n25) {
a<-table.start()
a<-table.row.start(a)
a<-table.element(a,'Goldfeld-Quandt test for Heteroskedasticity',4,TRUE)
a<-table.row.end(a)
a<-table.row.start(a)
a<-table.element(a,'p-values',header=TRUE)
a<-table.element(a,'Alternative Hypothesis',3,header=TRUE)
a<-table.row.end(a)
a<-table.row.start(a)
a<-table.element(a,'breakpoint index',header=TRUE)
a<-table.element(a,'greater',header=TRUE)
a<-table.element(a,'2-sided',header=TRUE)
a<-table.element(a,'less',header=TRUE)
a<-table.row.end(a)
for (mypoint in kp3:nmkm3) {
a<-table.row.start(a)
a<-table.element(a,mypoint,header=TRUE)
a<-table.element(a,gqarr[mypoint-kp3+1,1])
a<-table.element(a,gqarr[mypoint-kp3+1,2])
a<-table.element(a,gqarr[mypoint-kp3+1,3])
a<-table.row.end(a)
}
a<-table.end(a)
table.save(a,file='mytable5.tab')
a<-table.start()
a<-table.row.start(a)
a<-table.element(a,'Meta Analysis of Goldfeld-Quandt test for Heteroskedasticity',4,TRUE)
a<-table.row.end(a)
a<-table.row.start(a)
a<-table.element(a,'Description',header=TRUE)
a<-table.element(a,'# significant tests',header=TRUE)
a<-table.element(a,'% significant tests',header=TRUE)
a<-table.element(a,'OK/NOK',header=TRUE)
a<-table.row.end(a)
a<-table.row.start(a)
a<-table.element(a,'1% type I error level',header=TRUE)
a<-table.element(a,numsignificant1)
a<-table.element(a,numsignificant1/numgqtests)
if (numsignificant1/numgqtests < 0.01) dum <- 'OK' else dum <- 'NOK'
a<-table.element(a,dum)
a<-table.row.end(a)
a<-table.row.start(a)
a<-table.element(a,'5% type I error level',header=TRUE)
a<-table.element(a,numsignificant5)
a<-table.element(a,numsignificant5/numgqtests)
if (numsignificant5/numgqtests < 0.05) dum <- 'OK' else dum <- 'NOK'
a<-table.element(a,dum)
a<-table.row.end(a)
a<-table.row.start(a)
a<-table.element(a,'10% type I error level',header=TRUE)
a<-table.element(a,numsignificant10)
a<-table.element(a,numsignificant10/numgqtests)
if (numsignificant10/numgqtests < 0.1) dum <- 'OK' else dum <- 'NOK'
a<-table.element(a,dum)
a<-table.row.end(a)
a<-table.end(a)
table.save(a,file='mytable6.tab')
}