| Tabulation of Results | ||
| happiness x depression | ||
| HI | LO | HI | 57 | 46 | LO | 43 | 16 |
| Tabulation of Expected Results | ||
| happiness x depression | ||
| HI | LO | HI | 63.58 | 39.42 | LO | 36.42 | 22.58 |
| Statistical Results | |
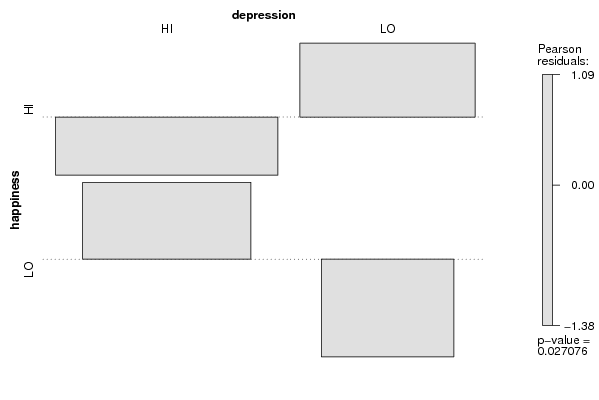
| Pearson's Chi-squared test with simulated p-value (based on 2000 replicates) | |
| Chi Square Statistic | 4.89 |
| P value | 0.02 |