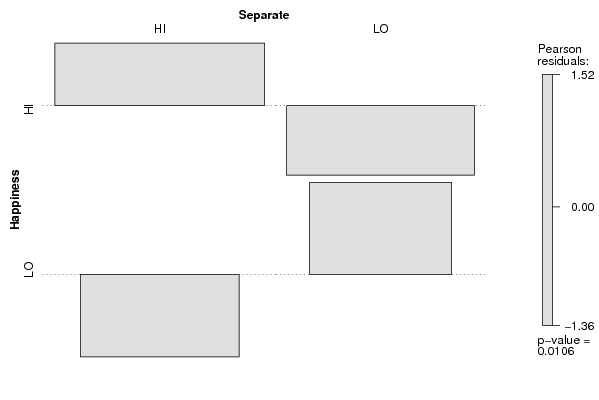
| Tabulation of Results | ||
| Happiness x Separate | ||
| HI | LO | HI | 65 | 38 | LO | 25 | 34 |
| Tabulation of Expected Results | ||
| Happiness x Separate | ||
| HI | LO | HI | 57.22 | 45.78 | LO | 32.78 | 26.22 |
| Statistical Results | |
| Pearson's Chi-squared test with simulated p-value (based on 2000 replicates) | |
| Chi Square Statistic | 6.53 |
| P value | 0.01 |