| Multiple Linear Regression - Estimated Regression Equation |
| suiker[t] = + 114.597307770066 + 0.00106518222376726month[t] + 0.166950547178408Bier[t] + 0.00186452253761169Tarwe[t] -0.338281167276215minerwater[t] + 0.0455394914285356fruit[t] + e[t] |
| Multiple Linear Regression - Ordinary Least Squares | |||||
| Variable | Parameter | S.D. | T-STAT H0: parameter = 0 | 2-tail p-value | 1-tail p-value |
| (Intercept) | 114.597307770066 | 2.694921 | 42.5234 | 0 | 0 |
| month | 0.00106518222376726 | 0.030571 | 0.0348 | 0.972338 | 0.486169 |
| Bier | 0.166950547178408 | 0.128996 | 1.2942 | 0.201304 | 0.100652 |
| Tarwe | 0.00186452253761169 | 0.001782 | 1.046 | 0.300388 | 0.150194 |
| minerwater | -0.338281167276215 | 0.126346 | -2.6774 | 0.009904 | 0.004952 |
| fruit | 0.0455394914285356 | 0.023818 | 1.912 | 0.061397 | 0.030698 |
| Multiple Linear Regression - Regression Statistics | |
| Multiple R | 0.78793835686911 |
| R-squared | 0.620846854225593 |
| Adjusted R-squared | 0.584389820978054 |
| F-TEST (value) | 17.0295495524859 |
| F-TEST (DF numerator) | 5 |
| F-TEST (DF denominator) | 52 |
| p-value | 6.06275363246311e-10 |
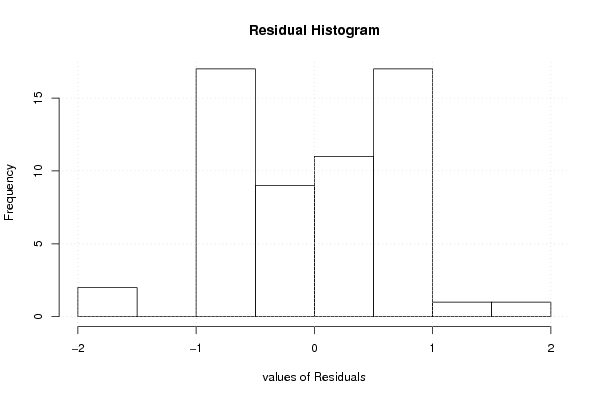
| Multiple Linear Regression - Residual Statistics | |
| Residual Standard Deviation | 0.773754810920322 |
| Sum Squared Residuals | 31.1322183859618 |
| Multiple Linear Regression - Actuals, Interpolation, and Residuals | |||
| Time or Index | Actuals | Interpolation Forecast | Residuals Prediction Error |
| 1 | 100.7 | 100.380850098035 | 0.319149901965114 |
| 2 | 100.12 | 100.081618495202 | 0.0383815047983082 |
| 3 | 99.1 | 99.9500178665064 | -0.850017866506393 |
| 4 | 99.84 | 98.9063591457828 | 0.933640854217241 |
| 5 | 97.9 | 98.0316186894967 | -0.131618689496714 |
| 6 | 99.62 | 100.353157489607 | -0.733157489607435 |
| 7 | 100.4 | 99.9993431524093 | 0.400656847590722 |
| 8 | 99.48 | 100.380940868717 | -0.900940868716924 |
| 9 | 99.68 | 98.9728849339224 | 0.707115066077574 |
| 10 | 97.88 | 98.1645587445768 | -0.284558744576831 |
| 11 | 99.83 | 100.438599570397 | -0.608599570397354 |
| 12 | 100.51 | 99.766645408269 | 0.743354591731047 |
| 13 | 99.74 | 100.356965894853 | -0.61696589485302 |
| 14 | 99.74 | 98.9216756290631 | 0.818324370936845 |
| 15 | 97.56 | 98.0546746486633 | -0.494674648663261 |
| 16 | 100.74 | 100.425783667417 | 0.314216332582715 |
| 17 | 100.7 | 99.7775531305426 | 0.922446869457393 |
| 18 | 100.42 | 100.081813067156 | 0.338186932844415 |
| 19 | 99.71 | 99.0413305760682 | 0.668669423931821 |
| 20 | 96.86 | 97.858610266615 | -0.998610266614945 |
| 21 | 100.84 | 100.924995149695 | -0.084995149694932 |
| 22 | 100.62 | 99.7264670941453 | 0.893532905854665 |
| 23 | 100.8 | 100.1193364543 | 0.680663545700315 |
| 24 | 99.35 | 99.3800118985328 | -0.0300118985328279 |
| 25 | 96.86 | 98.5321779933276 | -1.67217799332755 |
| 26 | 100.85 | 100.54388520004 | 0.306114799960005 |
| 27 | 99.7 | 100.01487309595 | -0.314873095949539 |
| 28 | 100.66 | 100.070203637615 | 0.589796362384588 |
| 29 | 99.21 | 99.1476330084688 | 0.0623669915312252 |
| 30 | 96.75 | 98.4367807425143 | -1.68678074251432 |
| 31 | 99.71 | 100.681457181647 | -0.971457181646782 |
| 32 | 99.48 | 100.031484673017 | -0.551484673016562 |
| 33 | 101.03 | 100.085836780075 | 0.94416321992501 |
| 34 | 99.21 | 98.6270955846882 | 0.582904415311775 |
| 35 | 97.12 | 97.8635961344115 | -0.743596134411503 |
| 36 | 100.8 | 100.638555248394 | 0.161444751605555 |
| 37 | 99.36 | 99.8640290122612 | -0.504029012261163 |
| 38 | 101.22 | 99.818666177038 | 1.40133382296201 |
| 39 | 99.16 | 98.4815436065466 | 0.678456393453394 |
| 40 | 97.22 | 98.0406608705551 | -0.820660870555144 |
| 41 | 100.06 | 100.617857146736 | -0.557857146735523 |
| 42 | 99.39 | 99.9759365988755 | -0.58593659887552 |
| 43 | 101.23 | 99.7050366009956 | 1.52496339900443 |
| 44 | 99.2 | 98.4028074206525 | 0.79719257934755 |
| 45 | 97.52 | 97.480983474113 | 0.0390165258869077 |
| 46 | 100.57 | 100.55638828787 | 0.0136117121296998 |
| 47 | 99.45 | 100.202620522544 | -0.752620522543992 |
| 48 | 100.1 | 99.4733943762418 | 0.626605623758204 |
| 49 | 99.08 | 98.3674826704247 | 0.712517329575329 |
| 50 | 97.57 | 97.562944480744 | 0.00705551925601923 |
| 51 | 99.79 | 100.422324974208 | -0.632324974207634 |
| 52 | 99.28 | 100.12219865646 | -0.84219865646044 |
| 53 | 99.98 | 99.0437461505427 | 0.936253849457267 |
| 54 | 98.16 | 98.5341249919447 | -0.374124991944726 |
| 55 | 99.9 | 100.338779309043 | -0.438779309042806 |
| 56 | 99.4 | 100.038406283549 | -0.638406283548776 |
| 57 | 99.91 | 98.9855187161627 | 0.924481283837321 |
| 58 | 98 | 98.2651584523718 | -0.265158452371856 |
| Goldfeld-Quandt test for Heteroskedasticity | |||
| p-values | Alternative Hypothesis | ||
| breakpoint index | greater | 2-sided | less |
| 9 | 0.217491514081586 | 0.434983028163172 | 0.782508485918414 |
| 10 | 0.112980212900156 | 0.225960425800311 | 0.887019787099844 |
| 11 | 0.0518187612263096 | 0.103637522452619 | 0.94818123877369 |
| 12 | 0.241710515661302 | 0.483421031322604 | 0.758289484338698 |
| 13 | 0.209427070728857 | 0.418854141457714 | 0.790572929271143 |
| 14 | 0.168998591592344 | 0.337997183184687 | 0.831001408407656 |
| 15 | 0.127961300208441 | 0.255922600416882 | 0.87203869979156 |
| 16 | 0.113090322250809 | 0.226180644501619 | 0.88690967774919 |
| 17 | 0.117391285518436 | 0.234782571036871 | 0.882608714481564 |
| 18 | 0.0784448391371442 | 0.156889678274288 | 0.921555160862856 |
| 19 | 0.0681014820938346 | 0.136202964187669 | 0.931898517906165 |
| 20 | 0.0945466341298567 | 0.189093268259713 | 0.905453365870143 |
| 21 | 0.171629712814677 | 0.343259425629355 | 0.828370287185323 |
| 22 | 0.205150397948714 | 0.410300795897429 | 0.794849602051286 |
| 23 | 0.16256961557763 | 0.32513923115526 | 0.83743038442237 |
| 24 | 0.119949604656611 | 0.239899209313223 | 0.880050395343389 |
| 25 | 0.52280685732696 | 0.95438628534608 | 0.47719314267304 |
| 26 | 0.492793773375854 | 0.985587546751707 | 0.507206226624146 |
| 27 | 0.446963337895411 | 0.893926675790822 | 0.553036662104589 |
| 28 | 0.397744961796961 | 0.795489923593921 | 0.602255038203039 |
| 29 | 0.352112398994944 | 0.704224797989887 | 0.647887601005056 |
| 30 | 0.819372882938005 | 0.36125423412399 | 0.180627117061995 |
| 31 | 0.851809464631993 | 0.296381070736015 | 0.148190535368007 |
| 32 | 0.81339375318673 | 0.373212493626539 | 0.18660624681327 |
| 33 | 0.804099238788498 | 0.391801522423004 | 0.195900761211502 |
| 34 | 0.758136434133106 | 0.483727131733787 | 0.241863565866894 |
| 35 | 0.78895818839555 | 0.4220836232089 | 0.21104181160445 |
| 36 | 0.71876447443205 | 0.562471051135898 | 0.281235525567949 |
| 37 | 0.651517205553297 | 0.696965588893407 | 0.348482794446703 |
| 38 | 0.72652639266393 | 0.546947214672141 | 0.27347360733607 |
| 39 | 0.692803285464031 | 0.614393429071938 | 0.307196714535969 |
| 40 | 0.824213506001612 | 0.351572987996777 | 0.175786493998388 |
| 41 | 0.832416983075452 | 0.335166033849096 | 0.167583016924548 |
| 42 | 0.772679197532607 | 0.454641604934785 | 0.227320802467393 |
| 43 | 0.868726290322214 | 0.262547419355573 | 0.131273709677786 |
| 44 | 0.856338840514395 | 0.28732231897121 | 0.143661159485605 |
| 45 | 0.773253386530192 | 0.453493226939615 | 0.226746613469808 |
| 46 | 0.681127909572446 | 0.637744180855108 | 0.318872090427554 |
| 47 | 0.566753787873911 | 0.866492424252178 | 0.433246212126089 |
| 48 | 0.438447303637501 | 0.876894607275002 | 0.561552696362499 |
| 49 | 0.795705428215611 | 0.408589143568778 | 0.204294571784389 |
| Meta Analysis of Goldfeld-Quandt test for Heteroskedasticity | |||
| Description | # significant tests | % significant tests | OK/NOK |
| 1% type I error level | 0 | 0 | OK |
| 5% type I error level | 0 | 0 | OK |
| 10% type I error level | 0 | 0 | OK |