| Tabulation of Results | |||||
| learning x do | |||||
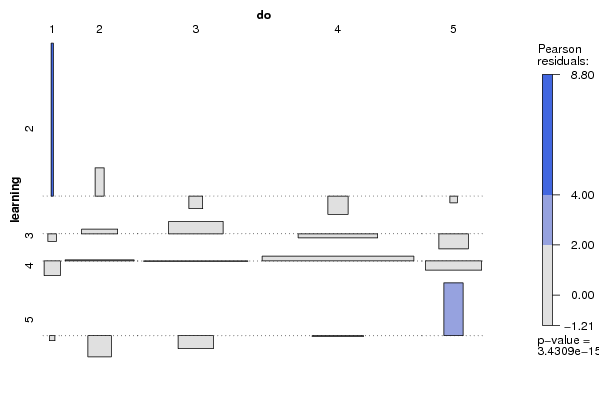
| 1 | 2 | 3 | 4 | 5 | 2 | 1 | 1 | 0 | 0 | 0 | 3 | 0 | 4 | 10 | 16 | 1 | 4 | 0 | 13 | 29 | 64 | 7 | 5 | 0 | 0 | 2 | 7 | 4 |
| Tabulation of Expected Results | |||||
| learning x do | |||||
| 1 | 2 | 3 | 4 | 5 | 2 | 0.01 | 0.23 | 0.52 | 1.09 | 0.15 | 3 | 0.19 | 3.51 | 7.99 | 16.96 | 2.34 | 4 | 0.71 | 12.79 | 29.14 | 61.83 | 8.53 | 5 | 0.08 | 1.47 | 3.35 | 7.11 | 0.98 |
| Statistical Results | |
| Pearson's Chi-squared test with simulated p-value (based on 2000 replicates) | |
| Chi Square Statistic | 95.96 |
| P value | 0 |