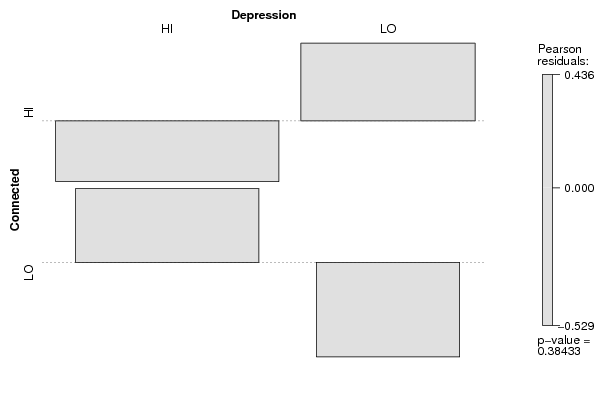
| Tabulation of Results | ||
| Connected x Depression | ||
| HI | LO | HI | 57 | 39 | LO | 43 | 22 |
| Tabulation of Expected Results | ||
| Connected x Depression | ||
| HI | LO | HI | 59.63 | 36.37 | LO | 40.37 | 24.63 |
| Statistical Results | |
| Pearson's Chi-squared test with Yates' continuity correction | |
| Chi Square Statistic | 0.5 |
| Degrees of Freedom | 1 |
| P value | 0.48 |