Free Statistics

of Irreproducible Research!

Author's title

Author*The author of this computation has been verified*
R Software Modulerwasp_linear_regression.wasp
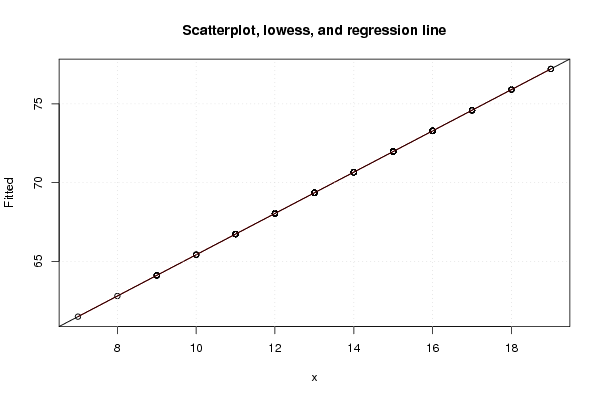
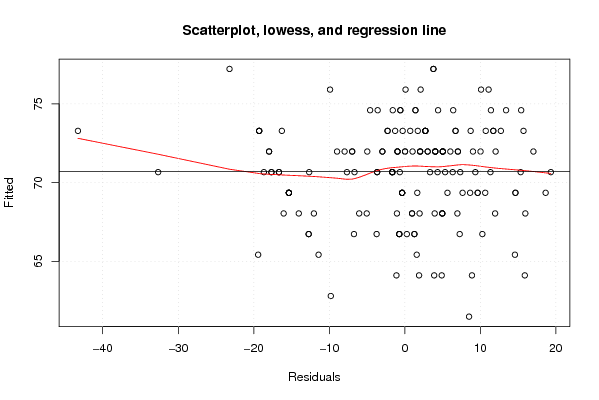
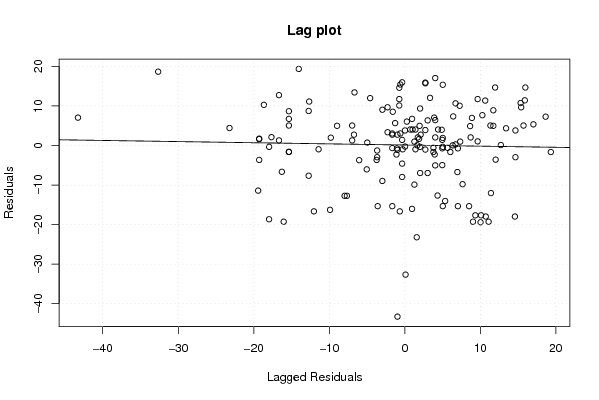
Title produced by softwareLinear Regression Graphical Model Validation
Date of computationTue, 16 Nov 2010 14:24:31 +0000
Cite this page as followsStatistical Computations at FreeStatistics.org, Office for Research Development and Education, URL https://freestatistics.org/blog/index.php?v=date/2010/Nov/16/t1289917876d7wjd15nnbejgz5.htm/, Retrieved Sun, 05 May 2024 07:58:40 +0000
Statistical Computations at FreeStatistics.org, Office for Research Development and Education, URL https://freestatistics.org/blog/index.php?pk=95843, Retrieved Sun, 05 May 2024 07:58:40 +0000
QR Codes:

Original text written by user:
IsPrivate?No (this computation is public)
User-defined keywords
Estimated Impact127
Family? (F = Feedback message, R = changed R code, M = changed R Module, P = changed Parameters, D = changed Data)
F       [Linear Regression Graphical Model Validation] [Workshop 6 Mini T...] [2010-11-16 14:24:31] [514029464b0621595fe21c9fa38c7009] [Current]
F    D    [Linear Regression Graphical Model Validation] [workshop 6 Mini T...] [2010-11-16 15:08:10] [945bcebba5e7ac34a41d6888338a1ba9]
Feedback Forum
2010-11-20 19:00:34 [48eb36e2c01435ad7e4ea7854a9d98fe] [reply
We zien hier bij 'slope' inderdaad een positief getal. Dit zou kunnen wijzen op een negatief verband tussen beiden. Zoals de student terecht heeft opgemerkt is de P waarde zeer klein, dit betekent inderdaad dat we de nulhypothese (beta = 0) mogen verwerpen en de alternatieve hypothese (beta = 1.31) mogen aanvaarden.

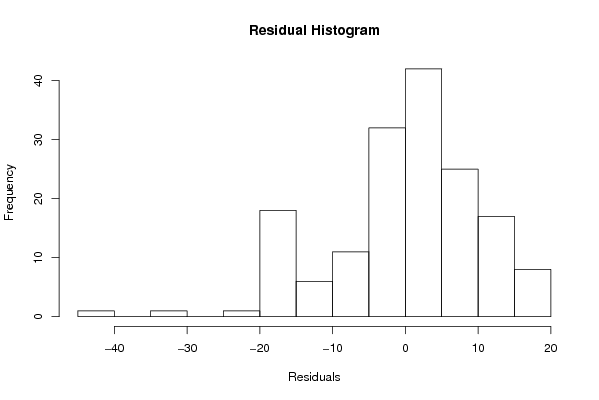
Echter vooraleer men voorspellingen mag doen op basis van dit model, dient men eerst na te gaan of alle onderliggende assumpties zijn voldaan. Dit wordt naar mijn mening niet voldoende behandeld door de student. Zo is een van de voorwaarden dat de residu's normaal moeten verdeeld zijn. De student schrijft in zijn of haar conclusie wel dat er geen normaalverdeling is, maar benadrukt niet dat dit een belangrijke voorwaarde is om het model te mogen gebruiken. Een andere voorwaarde waarover niks wordt gezegd is de autocorrelatie.

Voor de finale paper zou ik aanraden om hieraan meer aandacht te besteden en die onderliggende assumpties duidelijker te omschrijven.
2010-11-21 08:41:35 [48eb36e2c01435ad7e4ea7854a9d98fe] [reply
Errata: Het gaat hier, in de eerste zin, uiteraard niet om een negatief verband, maar om een positief verband.

Post a new message
Dataseries X:
14
18
11
12
16
18
14
14
15
15
17
19
10
16
18
14
14
17
14
16
18
11
14
12
17
9
16
14
15
11
16
13
17
15
14
16
9
15
17
13
15
16
16
12
12
11
15
15
17
13
16
14
11
12
12
15
16
15
12
12
8
13
11
14
15
10
11
12
15
15
14
16
15
15
13
12
17
13
15
13
15
16
15
16
15
14
15
14
13
7
17
13
15
14
13
16
12
14
17
15
17
12
16
11
15
9
16
15
10
10
15
11
13
14
18
16
14
14
14
14
12
14
15
15
15
13
17
17
19
15
13
9
15
15
15
16
11
14
11
15
13
15
16
14
15
16
16
11
12
9
16
13
16
12
9
13
13
14
19
13
12
13
Dataseries Y:
53
86
66
67
76
78
53
80
74
76
79
54
67
54
87
58
75
88
64
57
66
68
54
56
86
80
76
69
78
67
80
54
71
84
74
71
63
71
76
69
74
75
54
52
69
68
65
75
74
75
72
67
63
62
63
76
74
67
73
70
53
77
77
52
54
80
66
73
63
69
67
54
81
69
84
80
70
69
77
54
79
30
71
73
72
77
75
69
54
70
73
54
77
82
80
80
69
78
81
76
76
73
85
66
79
68
76
71
54
46
82
74
88
38
76
86
54
70
69
90
54
76
89
76
73
79
90
74
81
72
71
66
77
65
74
82
54
63
54
64
69
54
84
86
77
89
76
60
75
73
85
79
71
72
69
78
54
69
81
84
84
69


Summary of computational transaction
Raw Inputview raw input (R code)
Raw Outputview raw output of R engine
Computing time4 seconds
R Server'Sir Ronald Aylmer Fisher' @ 193.190.124.24

\begin{tabular}{lllllllll}
\hline
Summary of computational transaction \tabularnewline
Raw Input & view raw input (R code)  \tabularnewline
Raw Output & view raw output of R engine  \tabularnewline
Computing time & 4 seconds \tabularnewline
R Server & 'Sir Ronald Aylmer Fisher' @ 193.190.124.24 \tabularnewline
\hline
\end{tabular}
%Source: https://freestatistics.org/blog/index.php?pk=95843&T=0

[TABLE]
[ROW][C]Summary of computational transaction[/C][/ROW]
[ROW][C]Raw Input[/C][C]view raw input (R code) [/C][/ROW]
[ROW][C]Raw Output[/C][C]view raw output of R engine [/C][/ROW]
[ROW][C]Computing time[/C][C]4 seconds[/C][/ROW]
[ROW][C]R Server[/C][C]'Sir Ronald Aylmer Fisher' @ 193.190.124.24[/C][/ROW]
[/TABLE]
Source: https://freestatistics.org/blog/index.php?pk=95843&T=0

Globally Unique Identifier (entire table): ba.freestatistics.org/blog/index.php?pk=95843&T=0

As an alternative you can also use a QR Code:  

The GUIDs for individual cells are displayed in the table below:

Summary of computational transaction
Raw Inputview raw input (R code)
Raw Outputview raw output of R engine
Computing time4 seconds
R Server'Sir Ronald Aylmer Fisher' @ 193.190.124.24


Simple Linear Regression
StatisticsEstimateS.D.T-STAT (H0: coeff=0)P-value (two-sided)
constant term52.31765878027564.9453305334829610.57920363988870
slope1.31026353456260.3475488929384793.770012108179940.00022926833393333

\begin{tabular}{lllllllll}
\hline
Simple Linear Regression \tabularnewline
Statistics & Estimate & S.D. & T-STAT (H0: coeff=0) & P-value (two-sided) \tabularnewline
constant term & 52.3176587802756 & 4.94533053348296 & 10.5792036398887 & 0 \tabularnewline
slope & 1.3102635345626 & 0.347548892938479 & 3.77001210817994 & 0.00022926833393333 \tabularnewline
\hline
\end{tabular}
%Source: https://freestatistics.org/blog/index.php?pk=95843&T=1

[TABLE]
[ROW][C]Simple Linear Regression[/C][/ROW]
[ROW][C]Statistics[/C][C]Estimate[/C][C]S.D.[/C][C]T-STAT (H0: coeff=0)[/C][C]P-value (two-sided)[/C][/ROW]
[ROW][C]constant term[/C][C]52.3176587802756[/C][C]4.94533053348296[/C][C]10.5792036398887[/C][C]0[/C][/ROW]
[ROW][C]slope[/C][C]1.3102635345626[/C][C]0.347548892938479[/C][C]3.77001210817994[/C][C]0.00022926833393333[/C][/ROW]
[/TABLE]
Source: https://freestatistics.org/blog/index.php?pk=95843&T=1

Globally Unique Identifier (entire table): ba.freestatistics.org/blog/index.php?pk=95843&T=1

As an alternative you can also use a QR Code:  

The GUIDs for individual cells are displayed in the table below:

Simple Linear Regression
StatisticsEstimateS.D.T-STAT (H0: coeff=0)P-value (two-sided)
constant term52.31765878027564.9453305334829610.57920363988870
slope1.31026353456260.3475488929384793.770012108179940.00022926833393333


Parameters (Session):
par1 = 0 ;
Parameters (R input):
par1 = 0 ;
R code (references can be found in the software module):
par1 <- as.numeric(par1)
library(lattice)
z <- as.data.frame(cbind(x,y))
m <- lm(y~x)
summary(m)
bitmap(file='test1.png')
plot(z,main='Scatterplot, lowess, and regression line')
lines(lowess(z),col='red')
abline(m)
grid()
dev.off()
bitmap(file='test2.png')
m2 <- lm(m$fitted.values ~ x)
summary(m2)
z2 <- as.data.frame(cbind(x,m$fitted.values))
names(z2) <- list('x','Fitted')
plot(z2,main='Scatterplot, lowess, and regression line')
lines(lowess(z2),col='red')
abline(m2)
grid()
dev.off()
bitmap(file='test3.png')
m3 <- lm(m$residuals ~ x)
summary(m3)
z3 <- as.data.frame(cbind(x,m$residuals))
names(z3) <- list('x','Residuals')
plot(z3,main='Scatterplot, lowess, and regression line')
lines(lowess(z3),col='red')
abline(m3)
grid()
dev.off()
bitmap(file='test4.png')
m4 <- lm(m$fitted.values ~ m$residuals)
summary(m4)
z4 <- as.data.frame(cbind(m$residuals,m$fitted.values))
names(z4) <- list('Residuals','Fitted')
plot(z4,main='Scatterplot, lowess, and regression line')
lines(lowess(z4),col='red')
abline(m4)
grid()
dev.off()
bitmap(file='test5.png')
myr <- as.ts(m$residuals)
z5 <- as.data.frame(cbind(lag(myr,1),myr))
names(z5) <- list('Lagged Residuals','Residuals')
plot(z5,main='Lag plot')
m5 <- lm(z5)
summary(m5)
abline(m5)
grid()
dev.off()
bitmap(file='test6.png')
hist(m$residuals,main='Residual Histogram',xlab='Residuals')
dev.off()
bitmap(file='test7.png')
if (par1 > 0)
{
densityplot(~m$residuals,col='black',main=paste('Density Plot bw = ',par1),bw=par1)
} else {
densityplot(~m$residuals,col='black',main='Density Plot')
}
dev.off()
bitmap(file='test8.png')
acf(m$residuals,main='Residual Autocorrelation Function')
dev.off()
bitmap(file='test9.png')
qqnorm(x)
qqline(x)
grid()
dev.off()
load(file='createtable')
a<-table.start()
a<-table.row.start(a)
a<-table.element(a,'Simple Linear Regression',5,TRUE)
a<-table.row.end(a)
a<-table.row.start(a)
a<-table.element(a,'Statistics',1,TRUE)
a<-table.element(a,'Estimate',1,TRUE)
a<-table.element(a,'S.D.',1,TRUE)
a<-table.element(a,'T-STAT (H0: coeff=0)',1,TRUE)
a<-table.element(a,'P-value (two-sided)',1,TRUE)
a<-table.row.end(a)
a<-table.row.start(a)
a<-table.element(a,'constant term',header=TRUE)
a<-table.element(a,m$coefficients[[1]])
sd <- sqrt(vcov(m)[1,1])
a<-table.element(a,sd)
tstat <- m$coefficients[[1]]/sd
a<-table.element(a,tstat)
pval <- 2*(1-pt(abs(tstat),length(x)-2))
a<-table.element(a,pval)
a<-table.row.end(a)
a<-table.row.start(a)
a<-table.element(a,'slope',header=TRUE)
a<-table.element(a,m$coefficients[[2]])
sd <- sqrt(vcov(m)[2,2])
a<-table.element(a,sd)
tstat <- m$coefficients[[2]]/sd
a<-table.element(a,tstat)
pval <- 2*(1-pt(abs(tstat),length(x)-2))
a<-table.element(a,pval)
a<-table.row.end(a)
a<-table.end(a)
table.save(a,file='mytable.tab')