| Tabulation of Results | ||
| Depression x Seperate | ||
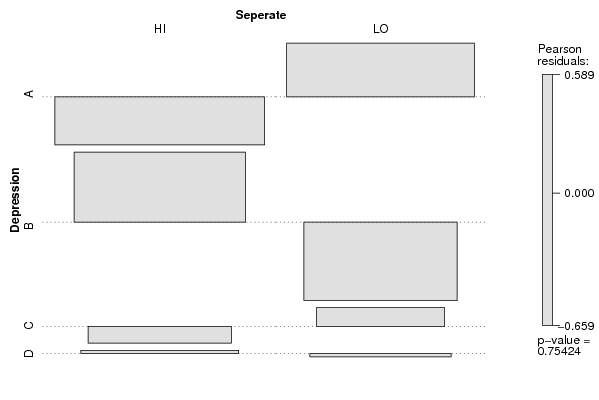
| HI | LO | A | 31 | 29 | B | 25 | 15 | C | 15 | 13 | D | 19 | 15 |
| Tabulation of Expected Results | ||
| Depression x Seperate | ||
| HI | LO | A | 33.33 | 26.67 | B | 22.22 | 17.78 | C | 15.56 | 12.44 | D | 18.89 | 15.11 |
| Statistical Results | |
| Pearson's Chi-squared test | |
| Chi Square Statistic | 1.19 |
| Degrees of Freedom | 3 |
| P value | 0.75 |