| Tabulation of Results | ||
| Stress x Depression | ||
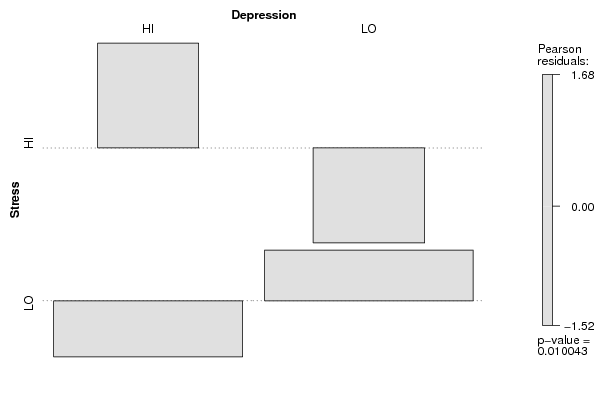
| HI | LO | HI | 23 | 13 | LO | 50 | 76 |
| Tabulation of Expected Results | ||
| Stress x Depression | ||
| HI | LO | HI | 16.22 | 19.78 | LO | 56.78 | 69.22 |
| Statistical Results | |
| Pearson's Chi-squared test with Yates' continuity correction | |
| Chi Square Statistic | 5.69 |
| Degrees of Freedom | 1 |
| P value | 0.02 |